Important Disclosures FORWARD LOOKING STATEMENTS The information in this presentation includes forward-looking statements within the meaning of Section 27A of the Securities Act of 1933, as amended, and Section 21E of the Securities…
Liberty: Energy Leadership in the 21st Century A Consistent Strategy Drives Compelling Value Creation SUPERIOR R E T U R N S Libertys proven performance across cycles with 23% average CROCI(1) driven by accretive investment in…
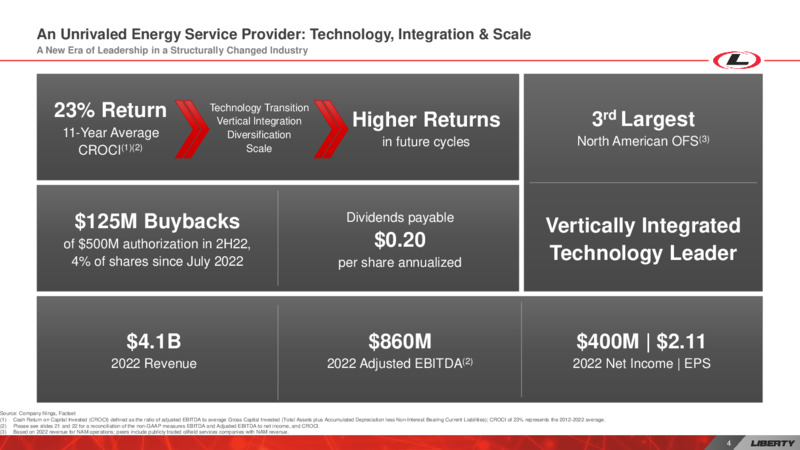
An Unrivaled Energy Service Provider: Technology, Integration & Scale A New Era of Leadership in a Structurally Changed Industry 23% Return Technology Transition Vertical Integration Higher Returns 3rd Largest 11-Year Average…
Libertys Unmatched Track Record of Attractive Returns Proven Steward of Capital in the Energy Sector Nearly 50% Higher Than The S&P Over The Last Decade Strategic Liberty Cash Return on Capital Invested(1) (CROCI) 47% Priorities…
Libertys Investment Philosophy Managing the Cycle for Long Term Returns How We Built 47% Liberty 45% 44% 44% 45% G E N E R AT E 1 Build the M A I N TA I N BDFC FCF BALANCE SHEET 35% STRENGTH 35% 2 Small Amount of 31%…
Worldwide Oil Supply and Demand Remain Tight Multi-Year Underinvestment Constrains Supply in a Rising Demand Environment Oil supply remains constrained Global Oil (Liquid Fuels) Production & Consumption Global underinvestment in…
Frac Market Dynamics Support a Strong Upcycle Industry Capacity to Remain Near Full Utilization Frac Horsepower at High Utilization Tight Frac Supply Near-term natural gas demand 30 90% pullback but long-term demand strong 80%…
A Strong Upcycle Ahead Industry Consolidation, Capital Discipline and Next Generation Transition Define the Next Decade WHY IS THIS CYCLE DIFFERENT 70%+ OF ACTIVE FRAC CAPACITY INDUSTRY IS WITH THE TOP 5 PLAYERS(1) C O N S O L…
A Reminder of Our Outlook in the Depths of the Covid Downturn (from Investor Day June 2021) Covid Downturn Weighed on Global Economies and OFS Sector Sentiment MACRO ENVIRONMENT Tough backdrop informing 2021 Investor Day…
Delivering on Returns Strategy: Ahead of Projections Strategic Investment Drives Long-Term Differential Returns CROCI(1): Investor Day vs. Current FCF Yield(3): Investor Day vs. Current Liberty Uniquely Positioned 40% to Lead…
Increasing Competitive Advantages to Enable Even Higher Returns Diversifying and Expanding Our Reach 2022: SCALE, 5-7 YEAR: A TECHNOLOGY VERTICAL INTEGRATION & TRANSITION WITH OUR DIGI SUITE, 2020: FRAC & ENGINEERING FOCUS…
Technology Transition Increases Competitiveness & Productivity Innovation and Portfolio Expansion Drives Higher Operating & Capital Efficiency Gas compression, processing and delivery complements digi investment Damp sand…
Increasing Competitiveness and Earnings Potential CROCI Potential Average of 25%-35% Over a 5 to 7-Year Technology Transition Scenario, Exceeding Prior 11-Year Average of 23% A D J U S T E D E B I T D A & E P S Adjusted EBITDA…
Compelling Value Creation and Returns Through Technology Transition Differentiated Returns Will Be Recognized by the Market Technology Transition Scenario: 2018-2022 (Covid) A 5-7 Year Cumulative Look(1) FCF Generation Underpins…
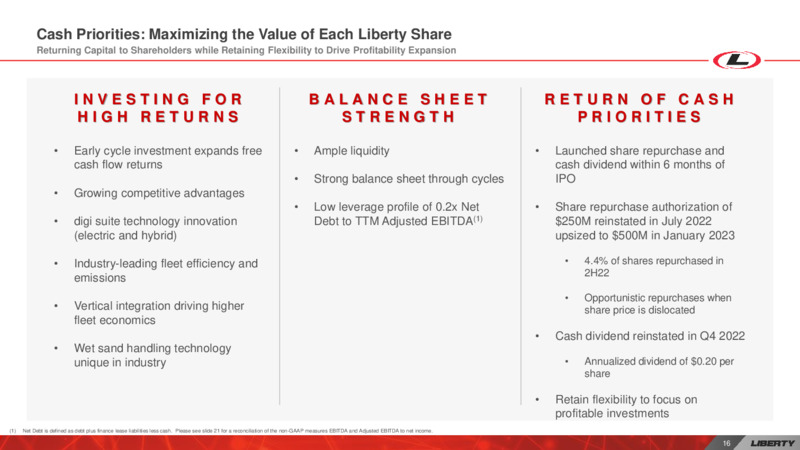
Cash Priorities: Maximizing the Value of Each Liberty Share Returning Capital to Shareholders while Retaining Flexibility to Drive Profitability Expansion INVESTING FOR BALANCE SHEET RETURN OF CASH HIGH RETURNS STRENGTH…
Scale & Balance Sheet Strength INVESTABLE The 3rd Largest North American Oilfield Service Company North American Oilfield Services Revenue (B)(1) Financial Leverage(2) HAL 9.6 0.1x SLB 6.0 0.2x LBRT 4.1 0.3x BKR 3.8 0.4x…
Strong Demonstrated Industry Leadership Competitive Advantages Create Value for the Long Term 2 0 1 8 - 2 0 2 2 AV E R A G E R O C E EVIBES EV / 2022E / 2023 EBITDA EBITDA 8.2xx 10.2 2.5x 7.8 x 2.8x 7.0 xLiberty 2.2x ROCE…
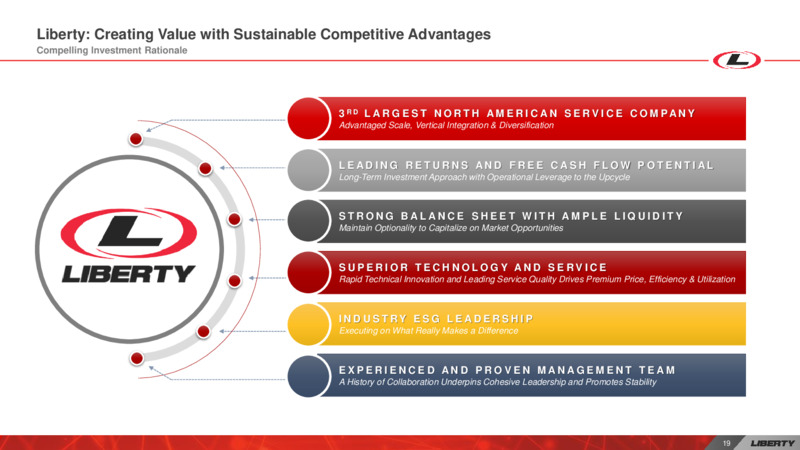
Liberty: Creating Value with Sustainable Competitive Advantages Compelling Investment Rationale 3 RD L A R G E S T N O R T H A M E R I C A N S E R V I C E C O M PA N Y Advantaged Scale, Vertical Integration & Diversification…
Appendix A: Supplemental Materials
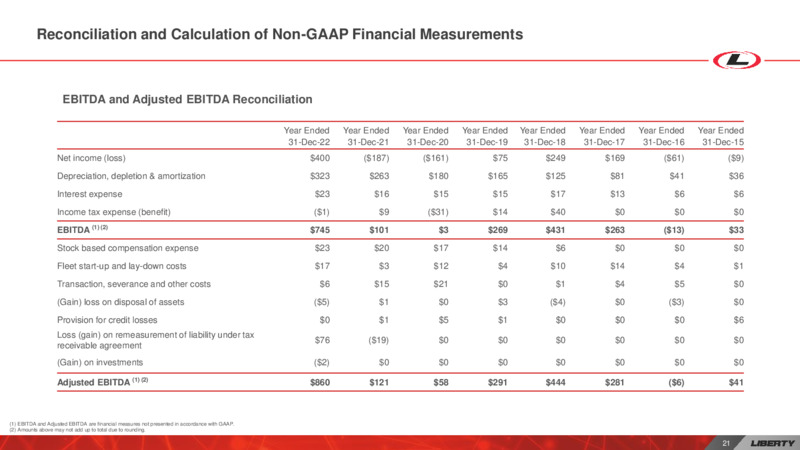
Reconciliation and Calculation of Non-GAAP Financial Measurements EBITDA and Adjusted EBITDA Reconciliation Year Ended Year Ended Year Ended Year Ended Year Ended Year Ended Year Ended Year Ended 31-Dec-22 31-Dec-21 31-Dec-20…
Reconciliation and Calculation of Non-GAAP Financial Measurements (Contd) CROCI Reconciliation Year Ended Year Ended Year Ended Year Ended Year Ended Year Ended Year Ended Year Ended 31-Dec-22 31-Dec-21 31-Dec-20 31-Dec-19…
Reconciliation and Calculation of Non-GAAP Financial Measurements (Contd) ROCE Reconciliation Year Ended Year Ended Year Ended Year Ended Year Ended Year Ended 30-Dec-22 31-Dec-21 31-Dec-20 31-Dec-19 31-Dec-18 31-Dec-17 Net…
 Loading...