Enable Midstream Partners, LP Second Quarter 2014 Conference Call August 5, 2014
Non-GAAP Financial Measures The Partnership has included the non-GAAP financial measures gross margin, Adjusted EBITDA and distributable cash flow in this presentation based on information in its condensed combined and consolidated…
Second Quarter Financial Highlights Adjusted EBITDA of 211 million, a 7% increase over pro forma second quarter 2013 DCF of 159 million, a 17% increase over pro forma second quarter 2013 Distributions of .2464/unit or .2950/unit on…
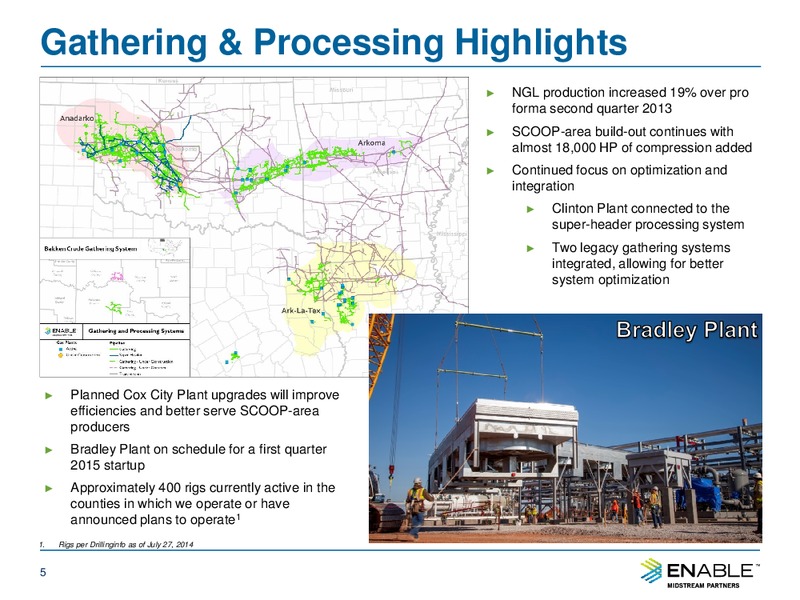
Gathering & Processing Highlights NGL production increased 19% over pro forma second quarter 2013 SCOOP-area build-out continues with almost 18,000 HP of compression added Continued focus on optimization and integration Clinton…
Transportation & Storage Highlights Acquired an additional 24.95% interest in SESH from CenterPoint Energy Proposed Bradley Lateral pipeline increased from 20 to 24 to accommodate strong SCOOP volume growth EOIT signed a long-term…
Growth Plan in Action: SCOOP Increased producer activity in dedicated acreage is expected to drive volume growth and create organic growth opportunities across the midstream value chain How Enable Capitalizes on the SCOOP SCOOP-area…
Second Quarter Operating Statistics Pro Forma Q2 2014 Q2 2013 Gathered Volumes (TBtu/d) 3.41 3.58 Natural gas processed volumes (TBtu/d) 1.55 1.42 NGLs Produced (MBbls/d)1 69.5 58.2 Condensate sold (MBbls/d) 4.28 3.23 Crude Oil…
Second Quarter Results Pro Forma in millions Q2 2014 Q2 2013 Gross Margin 349 327 Gathering and Processing 203 191 Transportation and Storage 146 136 Operation and Maintenance Expense 129 125 Net Income1,2 120 1,349 Adjusted…
2014 and 2015 Outlook in millions, except volume numbers 2014 2015 Natural Gas Gathered Volumes (TBtu/d) 3.3 3.5 3.5 3.7 Natural Gas Processed Volumes (TBtu/d) 1.5 1.7 1.9 2.2 Crude Oil Gathered Volumes (MBbl/d) 3.5 5.5 22.0 28.0…
Growth Capex Outlook 3.3 - 4.3 billion of growth capital potential through 2017 in millions 2014 2015 2016 2017 Total Contracted Expansion 725 775 800 1,000 700 1,000 2,225 2,775 Identified Opportunities 25 75 225 425 800 1,000…
Enables Growth Strategy Capture organic growth opportunities in our core basins Extend the value chain from wellhead to end users in our core commodities of gas, NGLs, and crude Establish a presence in high-growth basins Develop a…
Key Investment Highlights A compelling investment opportunity that doesnt require future drop-downs for growth Fully integrated suite of assets: 11,000 miles of gathering systems, 12 major processing plants, Significant Size, Scale and…
Question and Answer 14
Appendix 15
Non-GAAP Reconciliations Historical Pro Forma 3 Months 6 Months 3 Months Ended 6 Months Ended Ended Ended June 30, June 30, June 30, June 30, 2014 2013 2014 2013 2013 2013 Revenues 827 612 1,829 873 778 1,504 Cost of goods sold,…
 Loading...