2014 Wells Fargo Energy Symposium December 9, 2014
Partnership Structure Financial sponsor ownership through various holding companies Southcross Holdings LP (Holdings) 100% Interest Southcross Energy 57% LP Interest Partners GP, LLC Affiliate Assets Southcross…
President & Chief Executive Officer John E. Bonn 30+ Years Experience President & COO Southcross Energy President NiSource Midstream Services Owner, President Ranger Interests, Inc. VP, Commercial (Western Region) Enterprise Product…
The Southcross Advantage Conroe Houston San Antonio Transportation Lines / Storage Natural Gas End Users Lone Star Woodsboro NGL End Users Bonnie View Wellhead Gathering and Compression Gas Processing and…
Premier Strategic Footprint with Scale to Succeed in the Eagle Ford South Texas Assets Conroe Holdings SXE Pipeline (miles) 655 3,030 Gas Processing Capacity (MMcf/d) - 685 Houston Fractionation Capacity (MBbls/d) 63 27 San…
Eagle Ford Highlights The Eagle Ford is a major driver of U.S. oil and natural gas production growth U.S. Oil Production per Day U.S. Natural Gas Production per Day Source: EIA 6 2014 Wells Fargo Energy Symposium
Eagle Ford Has Attractive Producer Economics U.S. Oil PlayRequest Break-Even Assessment at December 1, 2014 Forward for Proposal Summary Strip Prices Proposed Contract and Deal Terms /Bbl (WTI) Marginal Economics 12-Month…
Texas Gulf Coast Production Expected to Exceed Processing Capacity Texas Gulf Coast Region Request is forecasted for Proposal Summary to need an additional 2.0 to 4.5Contract Proposed bcf/d ofand processing Deal Terms capacity by…
Well Positioned for Current Eagle Ford Activity Permits 2012-2014 9 2014 Wells Fargo Energy Symposium
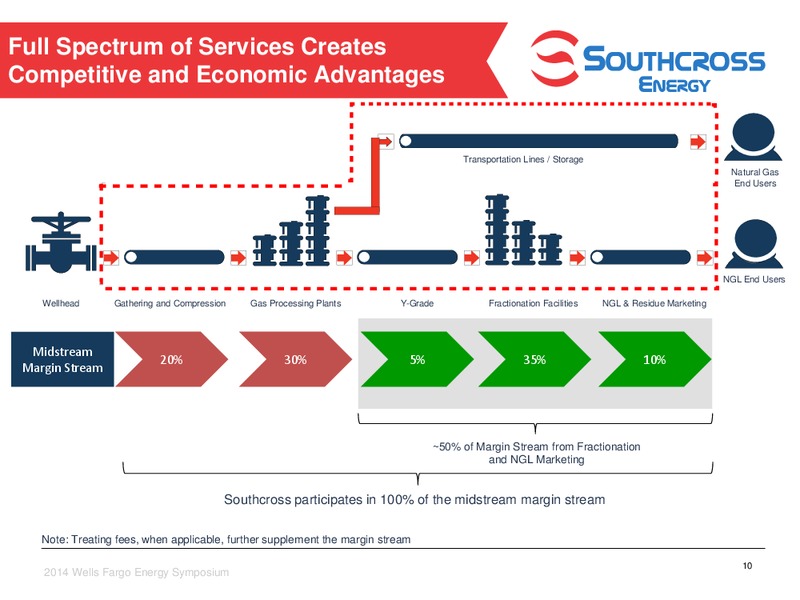
Full Spectrum of Services Creates Competitive and Economic Advantages Transportation Lines / Storage Natural Gas End Users NGL End Users Wellhead Gathering and Compression Gas Processing Plants Y-Grade Fractionation Facilities…
Lower Gulf Coast Projects Fuel Growth Lyondell / Equistar Ethylene Capacity Expansion Lyondell to add 800 million lbs/year of ethylene capacity at Corpus Christi plant by 2016 20,000 Bbl/d of estimated increase in ethane demand by…
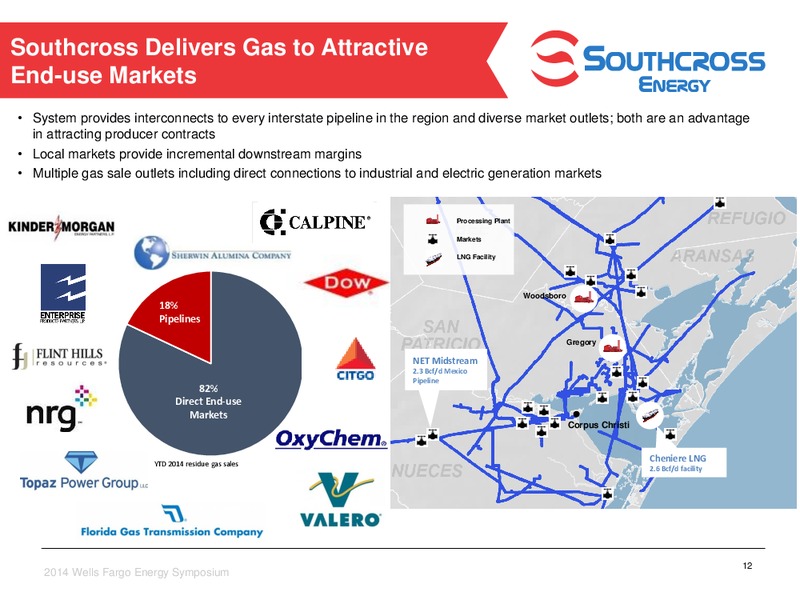
Southcross Delivers Gas to Attractive End-use Markets System provides interconnects to every interstate pipeline in the region and diverse market outlets; both are an advantage in attracting producer contracts Local markets provide…
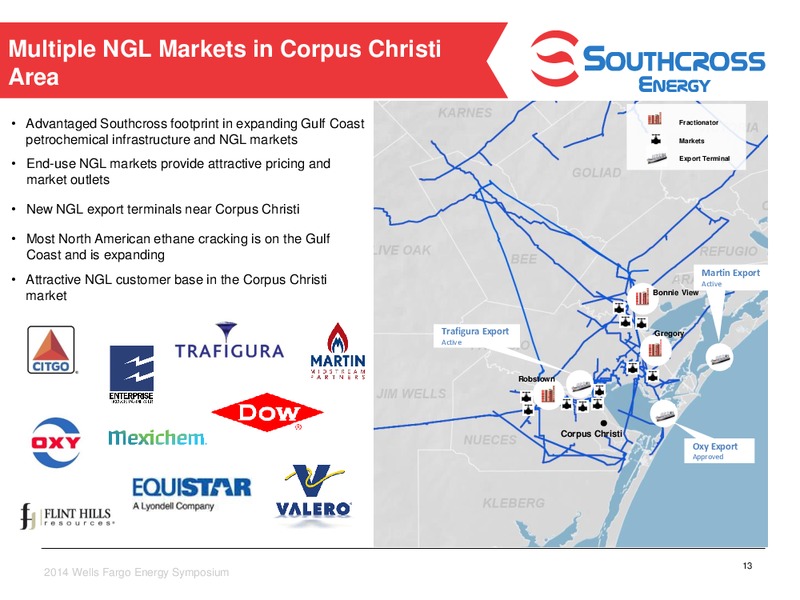
Multiple NGL Markets in Corpus Christi Area Advantaged Southcross footprint in expanding Gulf Coast Fractionator petrochemical infrastructure and NGL markets Markets End-use NGL markets provide attractive pricing and Export…
Blue Chip Customer and Contract Base Minimum volume commitments, acreage dedications and captive volumes should provide a solid and growing base of gas supply(1) Other Captive 3% Volumes 14% Minimum Commodity Volume…
Updates on Recent Key Projects Valley Wells System 100 MMcf/d sour gas treating facility; treated gas Conroe flows into SXE rich gas system Webb Pipeline Dedicated acreage in Dimmit and La Salle counties producing sour gas Houston…
Rapid Growth of Southcross Processed Gas Volumes 38% compound annual growth rate in average daily processed gas volumes since 2011 500 450 400 29% Organic CAGR (excluding 350 acquisition) 300 250 200 150 100 Average…
Significant Growth Achievable From Existing Capacity Significant available processing capacity presents cash flow growth opportunity 650 600 Adding 200 MMcf/d of 685 gas represents 36 MMcf/d 550 million to 55 million of 500…
Drop-Down Inventory Lancaster System 600 miles of sweet and sour gas gathering lines 28,000 hp of compression 100 MMcf/d sour gas treating facility; expandable to 300 MMcf/d 300,000 acres dedicated from 18 producers Valley…
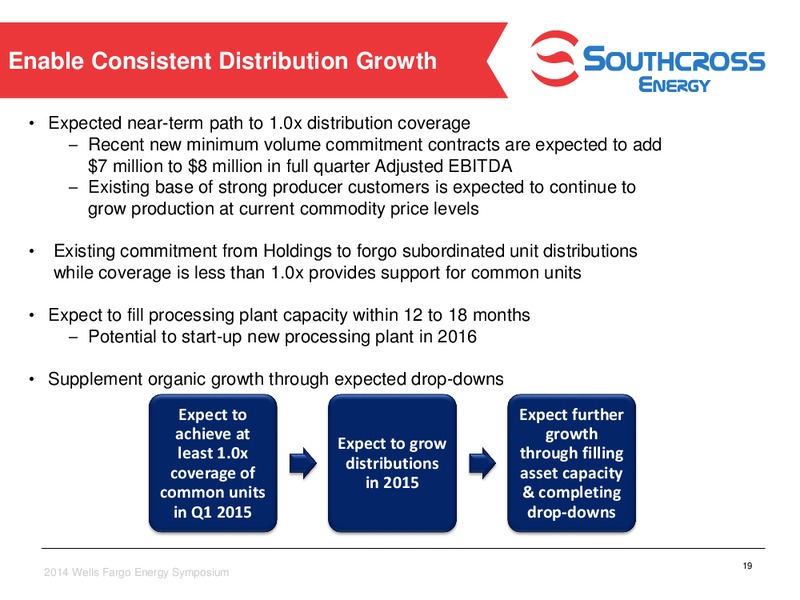
Enable Consistent Distribution Growth Expected near-term path to 1.0x distribution coverage Recent new minimum volume commitment contracts are expected to add 7 million to 8 million in full quarter Adjusted EBITDA Existing base of…
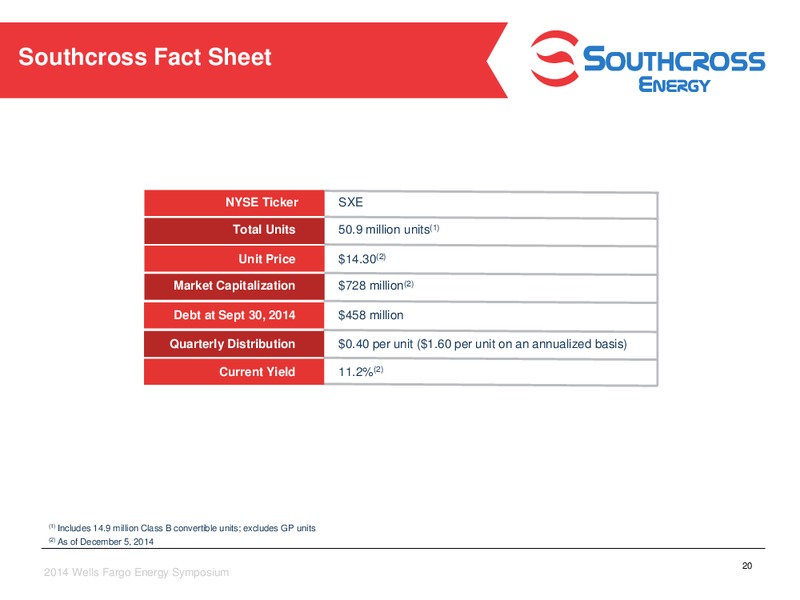
Southcross Fact Sheet NYSE Ticker SXE Total Units 50.9 million units(1) Unit Price 14.30(2) Market Capitalization 728 million(2) Debt at Sept 30, 2014 458 million Quarterly Distribution 0.40 per unit (1.60 per unit on an…
Non-GAAP Financial Measures We believe that Adjusted EBITDA is a widely accepted financial indicator of our operational performance and our ability to incur and service debt, fund capital expenditures and make distributions. We define…
Reconciliation to Adjusted EBITDA (Dollars in Thousands) Three Months Ended, 9/30/2013 12/31/2013 3/31/2014 6/30/2014 9/30/2014 Reconciliation of net loss to Adjusted EBITDA: Net (loss) income (4,069) 674 (1,289) (2,961) (24,778)…
 Loading...