OJSC Rosneft Q1 2014 IFRS results April 30, 2014 30.04.2014
Q114: Key Highlights Free cash flow growth and debt reduction Change Indicator Value Causes QoQ Growth of crude oil and petroleum product prices in Revenue, RUB bln 1,375 +1.9% rubles, changes in export mix Control of operating…
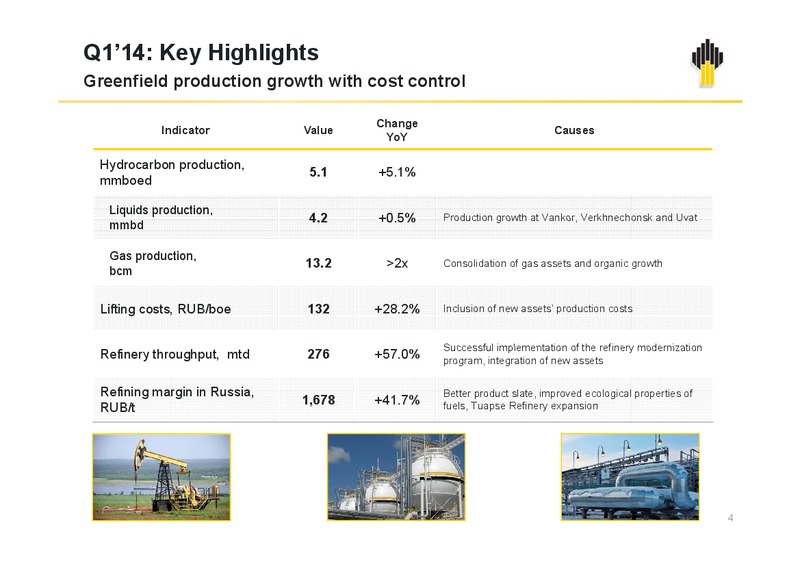
Q114: Key Highlights Greenfield p production growth g with cost control Change Indicator Value Causes YoY Hydrocarbon production, 5.1 +5.1% mmboed Liquids production, 42 4.2 +0 5% +0.5% Production growth at Vankor Vankor,…
Lifting Costs: Maintaining leadership positions in the industry Lifting costs Benchmarking(1) RUB/boe Electricityy Other /boe Peers Rosneft 20 38 34 38 15 38 10 106 104 111 94 5 4.3 3.8 2.8 2.9 0 Q2'13 Q3'13…
CAPEX: Discipline in major projects implementation CAPEX dynamics RUB bln Decline in Q114 vs. Q413 due to seasonality of work 182 Key priorities: 153 130 Sustain brownfield production (over Q113 Q114 RUB 268 bln; of this, RUB…
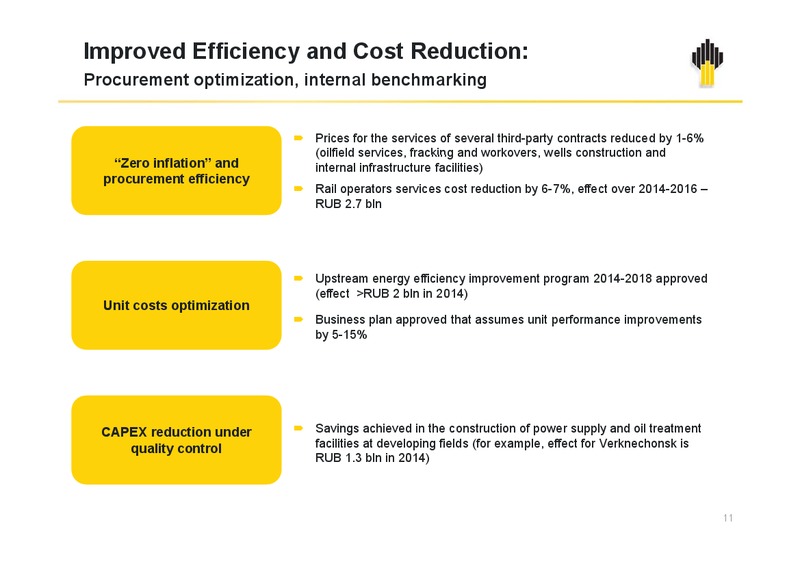
Improved Efficiency and Cost Reduction: Procurement optimization, internal benchmarking Prices for the services of several third-party contracts reduced by 1-6% (oilfield services, services fracking and workovers, workovers wells…
Synergies: Q114 results RUB bln CAPEX 26 2.6 23 1 23.1 Operating efficiency 1.8 1.1 3.6 1.7 11.7 0.4 U t Upstream R fi i Refining G projects Gas j t Commerce and C d HR M t i l supportt Material O Operating ti…
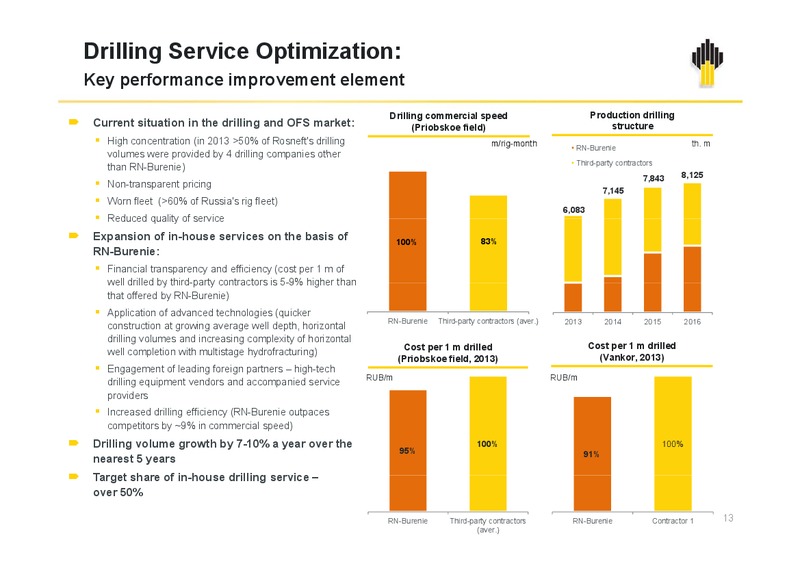
Drilling Service Optimization: Key performance improvement element Drilling commercial speed Production drilling Current situation in the drilling and OFS market: (Priobskoe field) structure High concentration (in 2013 50% of…
Asset Portfolio Development: Improving p g integrated g business performance p Transaction description Strategic rationale 6 licenses obtained for field development and 5 Support production level for geological…
Crude Production: Stabilization of production at key brownfields Oil production Key achievements in Q114 mbd Successful implementation of key workover solutions: 39.3% 39.5% 39.5% 39.2% Multistage hydrofracs: 2x growth YoY 39.1%…
Crude Production: Production growth drivers in Q114 Greenfield production Key achievements in Q114 mbd Uvat: 781 788 800 763 record commercial speed 1,513 m/day 731 shorter well development cycle (from 19.2 to 11.5 days)…
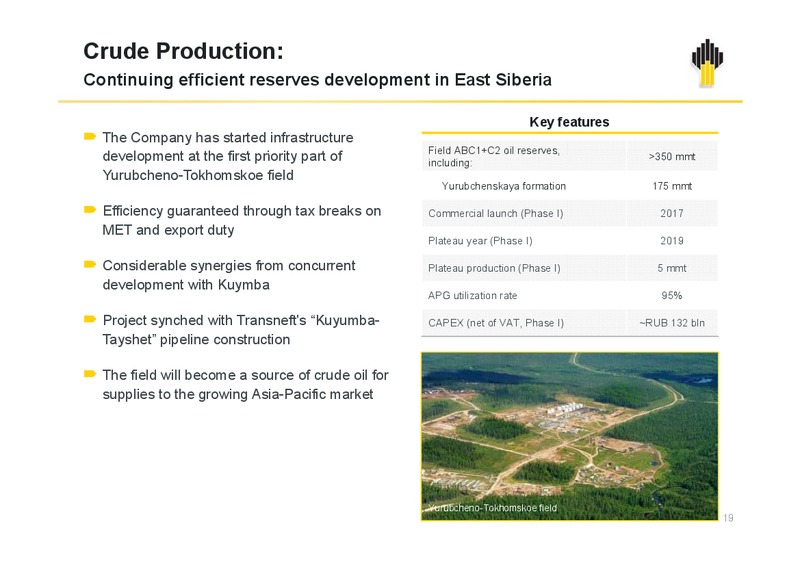
Crude Production: Continuing efficient reserves development in East Siberia Key features The Company has started infrastructure Field 1+2 oil reserves,, development at the first priority part of including: 350 mmt…
Gas Business: Efficient production growth Key achievements in Q114 Gas production bcm Gas processing and petrochemical agreement with SIBUR: +120 % closed sale of 49% in JV Yugragazpererabotka 12.1 13.2 10.8 signed long-term,…
Key projects: Sibneftegaz Mature gas asset with growth potential Gas MET breaks Beregovoe field (savings in 2014-2018 RUB 4 bln) Key objectives for 2014: Pyreinoe field start infrastructure development at Beregovoe and…
Key projects: Rospan Gas asset that will assure most of production Urengoyskoe field growth over the next 5 years East-Urengoyskoe+ as U e goys oe North-o Esetinskoe field MET breaks for gas and gas condensate (Savings in…
Gas Business: Organic growth is a base for further development Gas share in hydrocarbon reserves and production Target for 2020 100 bcm bcm Reserves(1) 120 100 Sakhalin and other KChLA 31% 14% Kharampur 80 Rospan…
Refining: High-margin monetization channel Monetization channels in Q114: refining Refinery throughput in Russia Production of motor fuels in Russia 91 9.1 1,678 43% 1,184 5.5 ck, /t 5/t 349 /t 347 /t +64%…
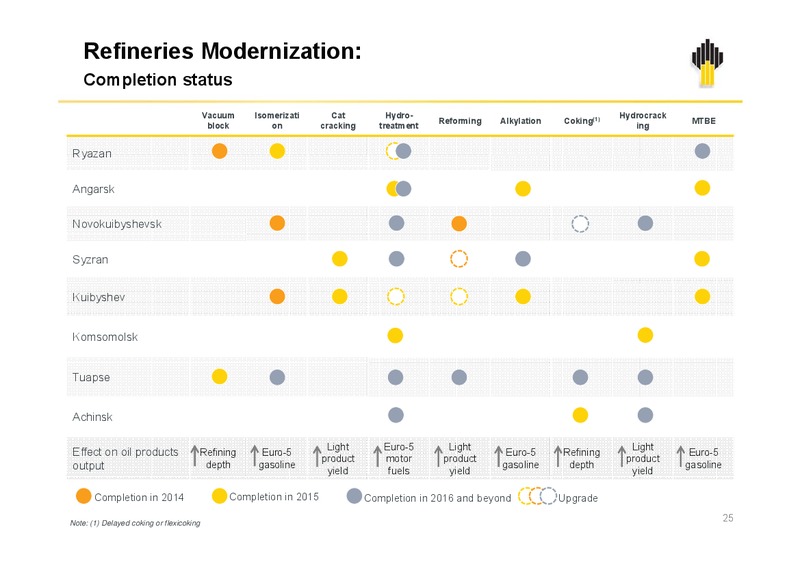
Refineries Modernization: Completion status Vacuum Isomerizati Cat Hydro- Hydrocrack Reforming Alkylation Coking(1) MTBE block on cracking treatment ing Ryazan Angarsk Novokuibyshevsk Syzran Kuibyshev Komsomolsk…
Trading in Crude Oil and Petroleum Products: Growth in premium channels Monetization channels in Q114: exports Crude export mix Exchange-based trading on Russian domestic market 344 /t 347 /t +38% 0.4 17.4% 24.9% 10% Nettback,…
Retail Operations: Improving fuel quality and class of service Key achievements in Q114 Retail sales via own network, t/day Retail margin grew to 5,200 RUB/t Premium 26.7 segment Aver. throughput per filling station Share 11%…
Premium Channels Expansion: 2 Key achievements in Q114 Sustainable development of B2B mln t 2.1 Share of into-plane sales of jet fuel up to 69% Storage cards opened in Ramenskoe and Chita +134% 0.7 airports 1.3 +37% Started…
Key Priorities for 2014 Growing efficiency at sustained CAPEX levels P Gradual deleveraging % Stabilizing production at key assets in West Siberia Optimizing drilling business structure and development of in-house in house…
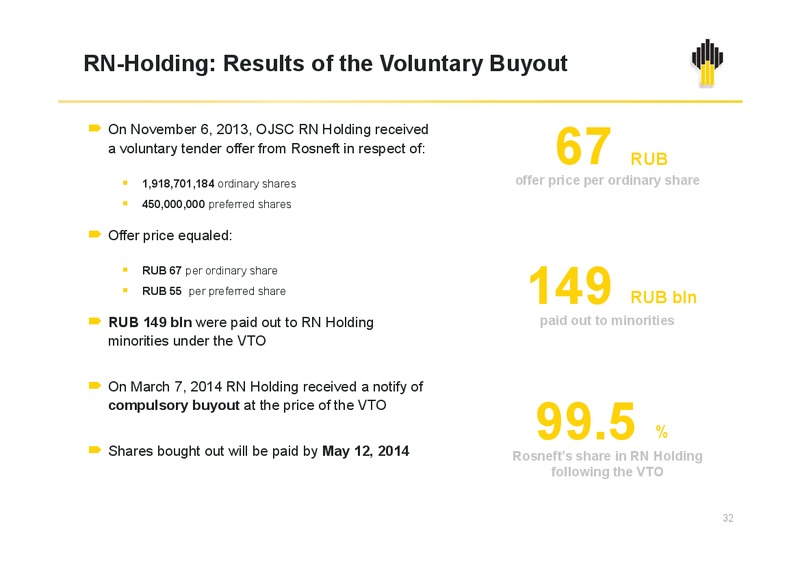
RN-Holding: Results of the Voluntary Buyout 67 On November 6, 2013, OJSC RN Holding received a voluntaryy tender offer from Rosneft in respect p of: RUB 1,918,701,184 ordinary shares offer price per ordinary share 450,000,000…
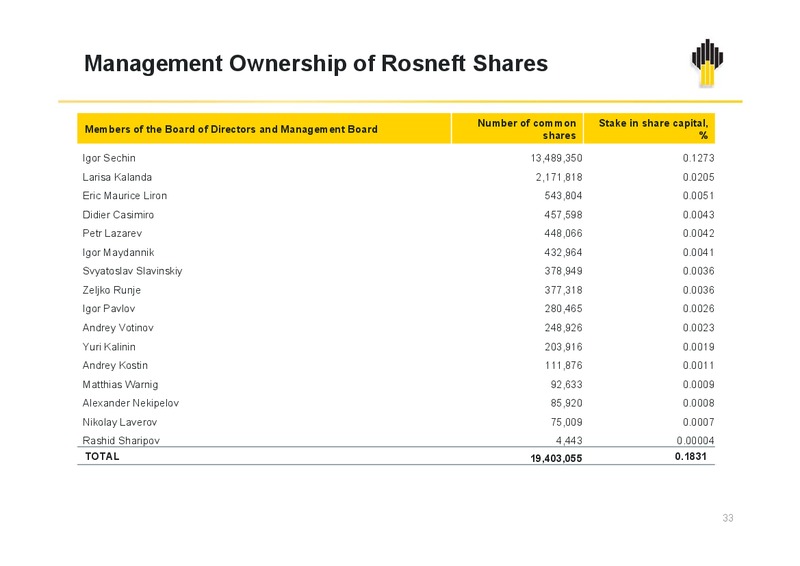
Management Ownership of Rosneft Shares Number of common Stake in share capital, Members of the Board of Directors and Management Board shares % I Igor S hi Sechin 13 489 350 13,489,350 0 1273 0.1273 Larisa Kalanda 2,171,818 0.0205…
Revenue Crude oil and gas sales Petroleum product sales 2.4% 44.1% 5.6% 4.0% 56.6% 4.5% 4.6% 3 7% 3.7% 729 632 RUB bln RUB bln 13.8% 29.6% 9 6% 17 5% 17.5% 13 6% 13.6% Europe and other directions Europe and other…
FX (loss)/gain RUB bln FX (loss)/gain Exchange rate, end of the period RUB/ 29 30 28 19 20 29 11 10 2 30 0 April May June July August September October November December January February March 31 -10 -6 -6 32 -12 -14 -20…
Net Income RUB bln Macro factors: M f t -67 RUB bln; -50% Company controlled factors: +21 RUB bln; +16% 14 (7) (70) 18 27 (26) 134 (4) 2 88 Q4'13 EBITDA (macro Income tax FX Other income EBITDA DD&A…
Net Debt RUB bln (16) (656) 141 23 106 149 (21) 1,860 1,586 Q4'13 Adj. operating Assets disposal Shares buyout CAPEX and Interests FX loss Other Q1'14 cash flow(1) from RN Holding licenses Note: (1) Operating…
 Loading...