....provides industry leading technology for: Production Enhancement Capital One Securities, Inc. 9th Annual Energy Conference December 9-12th, 2014
Overview Comments CARBO has industry leading, differentiated technologies that improve well Production and EUR in fracture stimulated wells. These technologies allow our clients to build fracs right the first time, to maximize…
One of the biggest economic opportunities in the oil and gas industry is to increase the recovery factor. In the shale reservoirs we are leaving over 90% of the oil in the ground. Fracturing Technology Evolution
Shale Reservoirs Need To Improve Recovery % Tighter rock needs fracs with more Contact Area and Conductivity Current Shale Recovery Factor < 5%-8% Conventional Sands Tight Sands Shale Millidarcies Microdarcies Nanodarcies…
More Stimulated Reservoir Volume = Higher EUR Contact Area Conductivity To be economical, low perm reservoirs Convergent Flow from Transverse Fracs require large contact areas to drain creates enormous flow velocity near Create many…
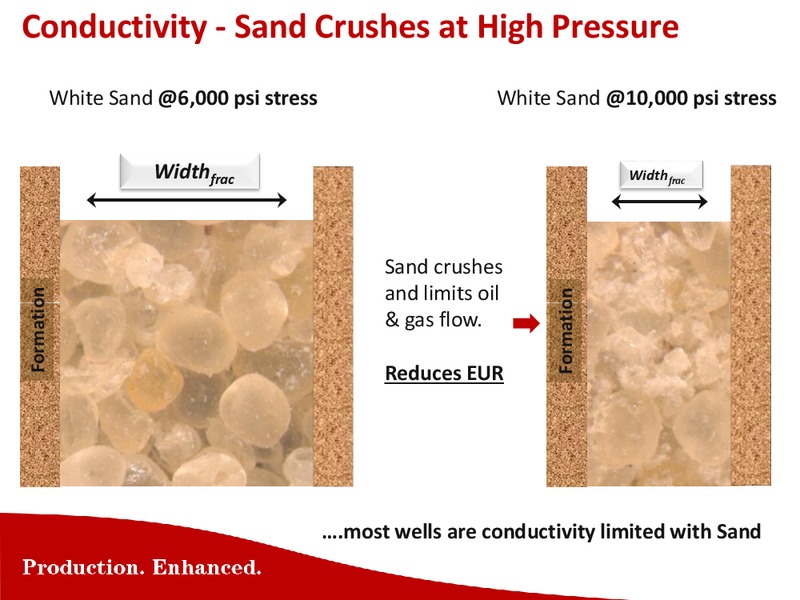
Conductivity - Sand Crushes at High Pressure White Sand 6,000 psi stress White Sand 10,000 psi stress Widthfrac Widthfrac Sand crushes and limits oil Formation Formation & gas flow. Reduces EUR .most wells are…
Conductivity - Effects of Pressure on Sand Conditions: Northern White Sand 20/40 9,000 psi, 250 F Flowing 2% KCL for 30 days Cross sections of Proppant pack shown At 9,000 psi, the Sand experienced severe crushing and the…
Conductivity Proppant Comparisons 6,000 CARBOLITE 20/40 CARBOLITE 30/50 5,000 CARBOLITE 40/70 White Sand 20/40 Smaller mesh size Conductivity (md-ft) White Sand 30/50 4,000 proppant, has lower White Sand 40/70 Conductivity…
Small Mesh Proppant EF Wells Production Study Study indicates early production governed by Contact Area. Longer term production governed by Conductivity. * Public production data Karnes/Atascosa/Live Oak Counties
Conductivity Proppant Options To Increase Recovery % Ceramic will have the highest Conductivity and EUR Sand will have lower Conductivity and EUR Sometimes 100 mesh Sand is used as a lead-in proppant in slickwater, with…
What is the right balance between initial Investment and maximizing Recovery % Shorter Term Perspective Longer Term Perspective AFE ( ) EUR ( BOE )
Shorter Term Perspective Longer Term Perspective Fracs Are Not Optimized Reasons to Optimize Fracs
Over 150 SPE papers have been written documenting the benefits of increased conductivity on well Production and EUR. Generally, the payout on the additional Proppant investment is less than 2 - 6 months, and increases Production and EUR…
Bakken - Statoil Mountrail County 350,000 CARBOECONOPROP CARBO (7 Wells) (7 wells) 309,781 300,000 WhiteSand White Sand (12 (12 wells) Wells) Ceramic wells out produce offset Sand 250,000 Cumulative Oil Production (bbls)…
Bakken - Liberty Resources Williams County Liberty Resources has lead the way in increasing Contact Area and Conductivity Higher well production results compared to offset wells, has verified the technical success of their…
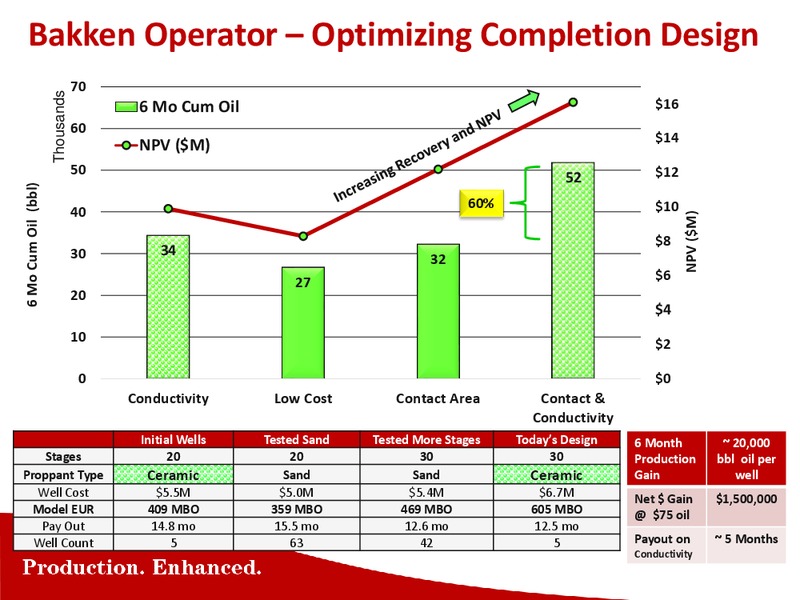
Bakken Operator Optimizing Completion Design 70 Thousands 6 Mo Cum Oil 16 60 NPV (M) 14 50 52 12 6 Mo Cum Oil (bbl) 60% 10 40 NPV (M) 8 30 34 32 27 6 20 4 10 2 0 0 Conductivity Low Cost Contact Area Contact…
Eagle Ford Operator Optimizing Completion Design 70,000 90 Day Cum Oil 66,300 60,000 Significant uplift to optimizing contact and conductivity 50,000 90 Day Oil (bbl) 40,000 30,000 35,100 28,860 20,000 10,000 0…
Cost Neutral Design.Ceramic outperforms Sand 2.4 x increase in sand/ft lateral yields 32% less Production 2,500,000 CARBOECONOPROP White Sand (Normalized) 2,000,000 Ceramic well Cumulative Gas (MCF) out produces offset Sand…
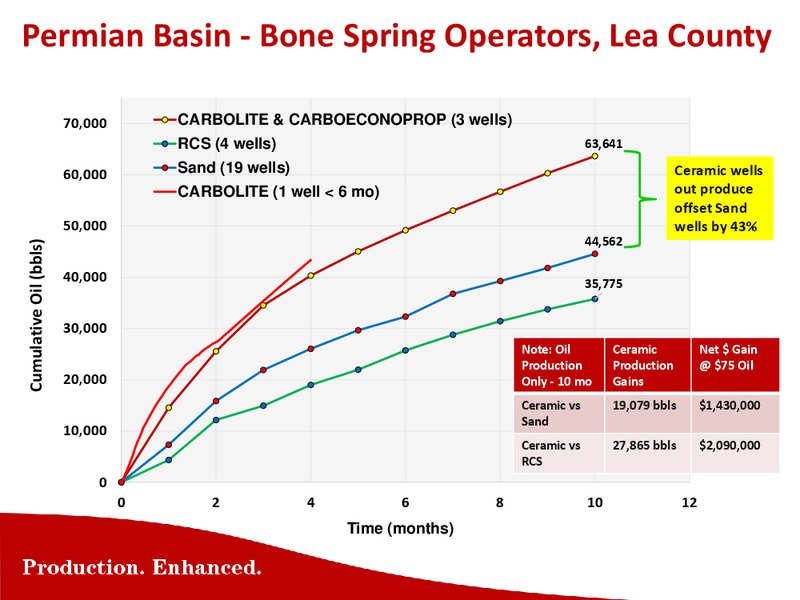
Permian Basin - Bone Spring Operators, Lea County 70,000 CARBOLITE & CARBOECONOPROP (3 wells) RCS (4 wells) 63,641 60,000 Sand (19 wells) Ceramic wells CARBOLITE (1 well < 6 mo) out produce offset Sand 50,000 wells by 43% 44,562…
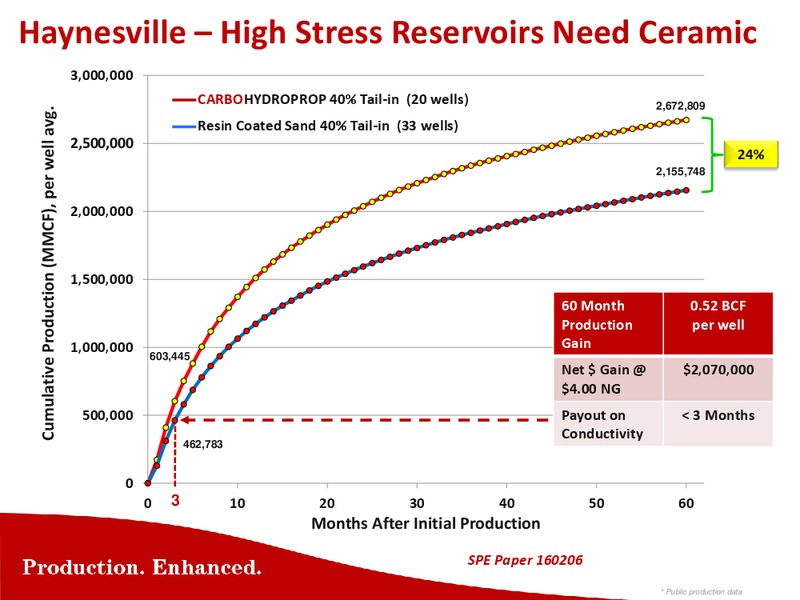
Haynesville High Stress Reservoirs Need Ceramic 3,000,000 ---- CARBOHYDROPROP 40% Tail-in (20 wells) 2,672,809 Cumulative Production (MMCF), per well avg. ---- Resin Coated Sand 40% Tail-in (33 wells) 2,500,000 24% 2,155,748…
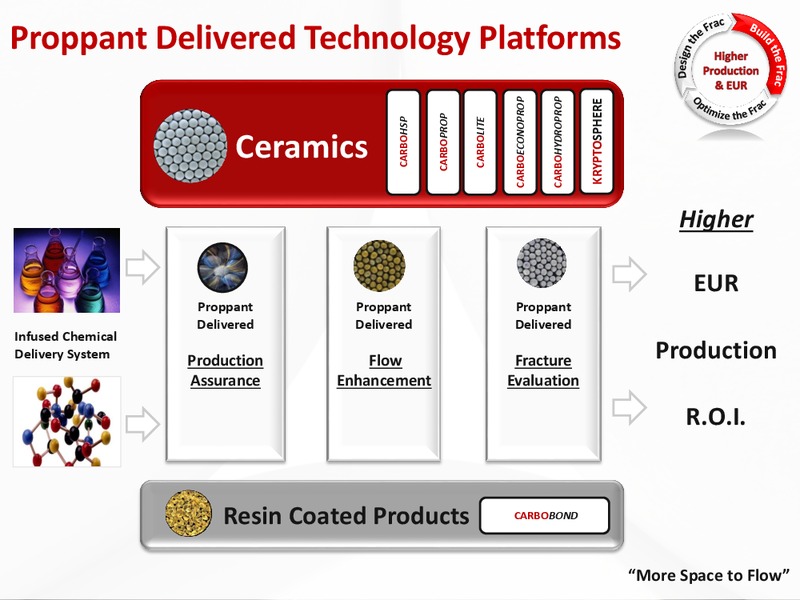
.a leading production enhancement company Frac Design Frac Conductivity & Durability Economic Optimization Production Assurance Reservoir Performance Fracture Evaluation Post Job Analysis Flow Enhancement Well Site…
Production Assurance - SCALEGUARD Most effective scale inhibitor product in the industry Chemically infused porous proppant with controlled release of scale inhibitor, into the production stream Increases Production and EUR, and…
Prevents scaling in the perfs and frac Prevents scaling in the tubulars SCALEGUARD Placed in the proppant pack 25
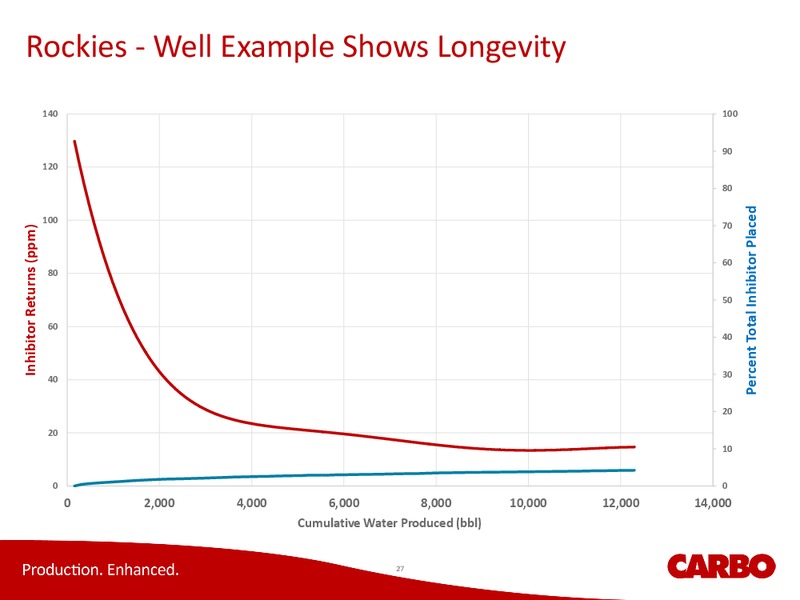
Highly Efficient Proppant Delivery System Percent of Effective Chemical Available after Placement in Frac 100% 90% 80% 70% 60% 50% 40% 30% 20% 10% 0% Liquid Scale Inhibitors Solid Scale Inhibitors SCALEGUARD Proppant…
Flow Enhancement - CARBORPM Increases Production and EUR by improving the permeability to hydrocarbons in the propped fracture Minimize capillary pressures in propped fracture with neutral wettability Increase effective fracture…
Well Production - Hierarchy of Proppant Value Highest Production, EUR, ROI Highest Conductivity Ultra-high strength Ultra-conductive Ceramic Mono-size and spherical, low beta Smooth surface, low steel erosivity High strength Tier 1…
KRYPTOSPHERE is a paradigm shift in improved Conductivity KRYPTOSPHERE HD Competitors Bauxite KRYPTOSPHERE HD is the strongest, highest conductivity Proppant commercially available today for the industrys deepest, highest stress…
Ceramic Proppant Sales vs Capacity Lbs (Millions) 2,750 2,500 CRR Manufacturing Capacity (Year End) 2,250 CRR Ceramic Sales Volume 2,000 1,750 1,500 1,250 1,000 750 500 250 0 Millen Line 2 est completion near end of…
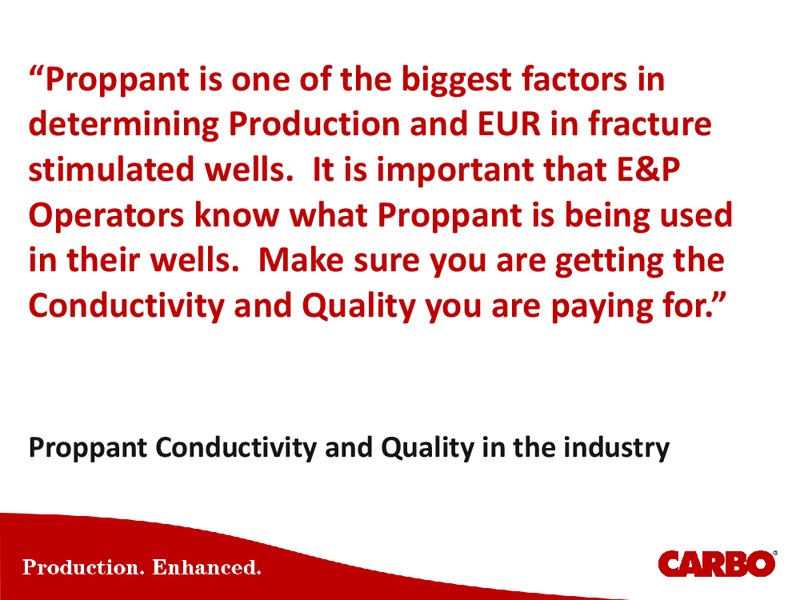
Proppant is one of the biggest factors in determining Production and EUR in fracture stimulated wells. It is important that E&P Operators know what Proppant is being used in their wells. Make sure you are getting the Conductivity and…
Low Quality Chinese Ceramics vs Made in USA Stakeholder Value American Made Low Quality Chinese Measurement Ceramic Proppant Ceramic Proppant E&P Operators Production & EUR Higher Lower Due to poor quality of proppant Royalty Owners…
Proppant Quality Matters in Well Production As an E&P Operator investing 4M 12M on a well, how much Production & EUR are you sacrificing by using low quality Chinese ceramic proppant Production & EUR Loss Chinese 20/40 Chinese 20/40…
CARBO vs Low Quality Chinese Ceramic Comparison of three field samples from North Dakota from low quality, low Conductivity Chinese ceramic proppant suppliers, compared to CARBOLITE : CARBOLITE Chinese 20/40 Chinese 20/40 Chinese…
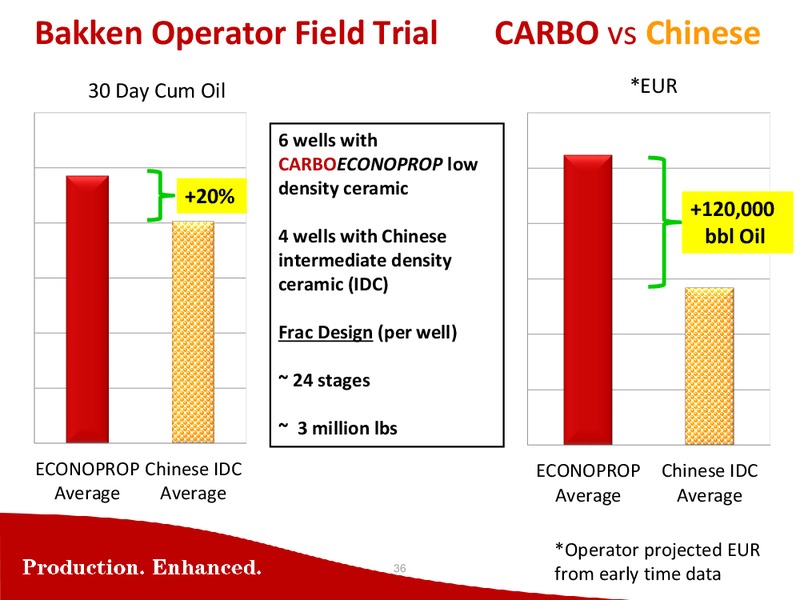
Bakken Operator Field Trial CARBO vs Chinese 30 Day Cum Oil *EUR 12 300 6 wells with 10 CARBOECONOPROP low250 +20% density ceramic +120,000 8 200 4 wells with Chinese bbl Oil intermediate density 6 ceramic (IDC) 150 4 Frac Design…
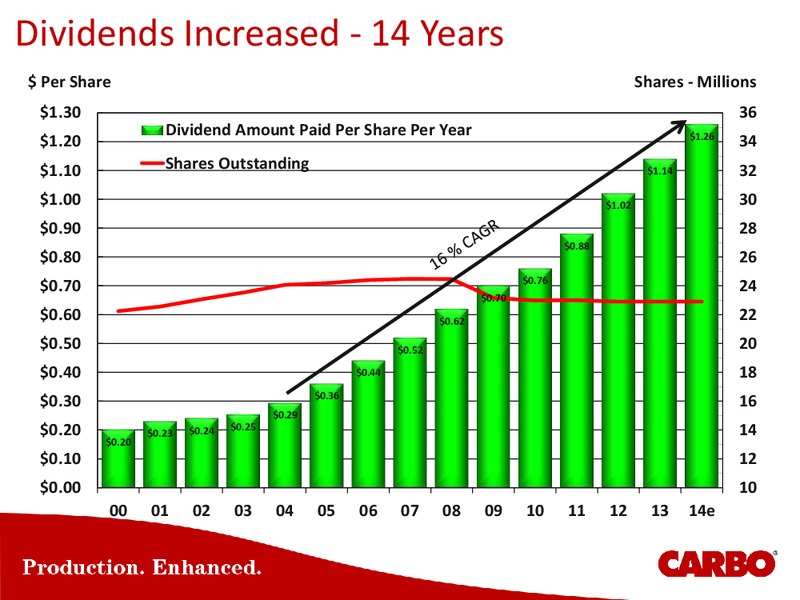
Dividends Increased - 14 Years Per Share Shares - Millions 1.30 36 Dividend Amount Paid Per Share Per Year 1.26 1.20 34 1.10 Shares Outstanding 1.14 32 1.00 1.02 30 0.90 28 0.88 0.80 26 0.76 0.70 24 0.70 0.60 0.62 22 0.50…
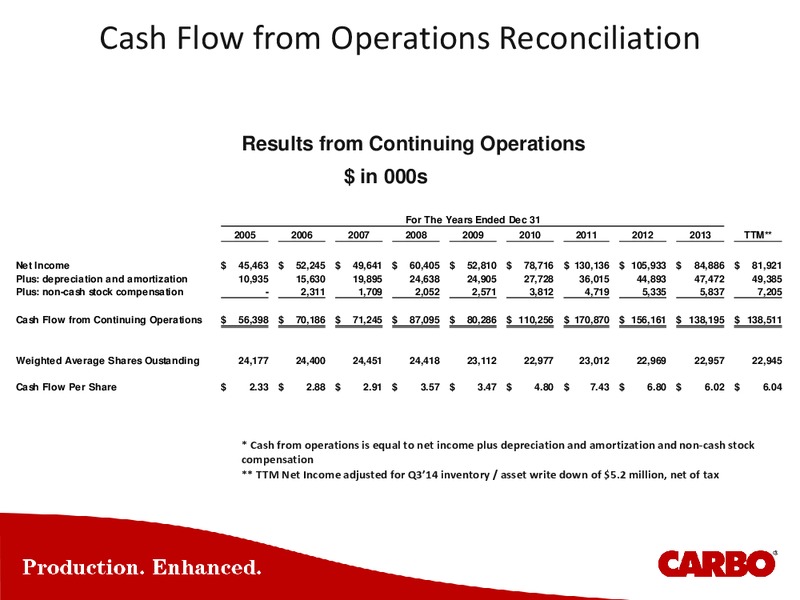
Cash Flow from Operations Reconciliation Results from Continuing Operations in 000s For The Years Ended Dec 31 2005 2006 2007 2008 2009 2010 2011 2012 2013 TTM** Net Income 45,463 52,245 49,641 60,405 52,810 78,716 130,136 105,933…
 Loading...