WE DELIVER Q3 Financial Results November 4, 2014 Stuart Bradie President and Chief Executive Officer Brian Ferraioli EVP and Chief Financial Officer Zachary Nagle VP, Investor Relations
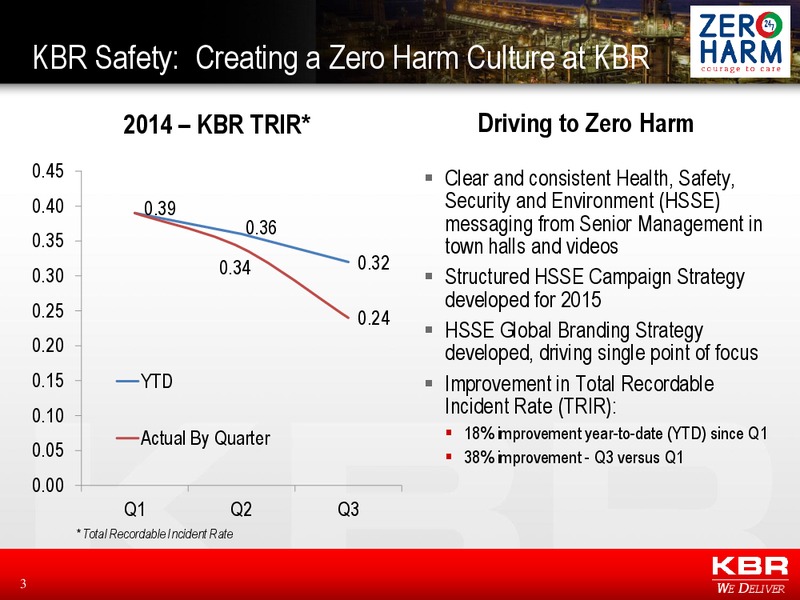
KBR Safety: Creating a Zero Harm Culture at KBR 2014 KBR TRIR* Driving to Zero Harm 0.45 Clear and consistent Health, Safety, 0.40 0.39 Security and Environment (HSSE) 0.36 messaging from Senior Management in 0.35 town halls and…
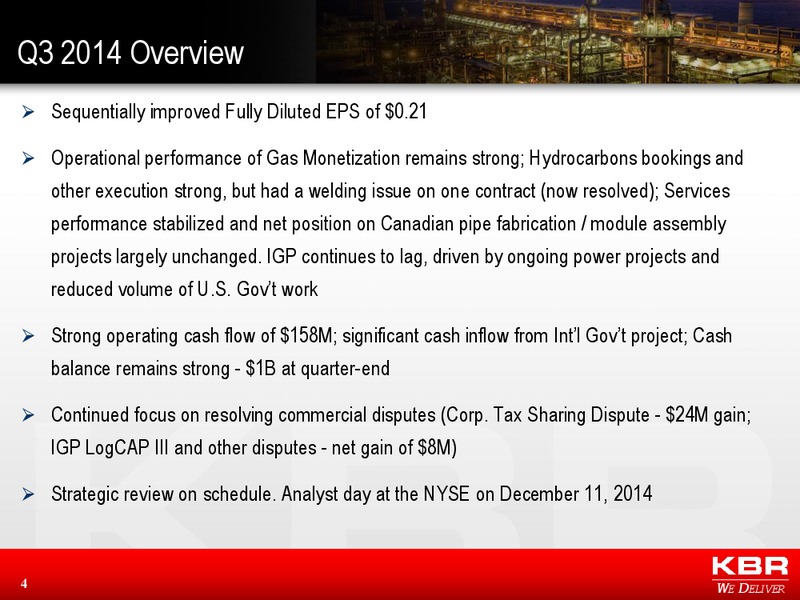
Q3 2014 Overview Sequentially improved Fully Diluted EPS of 0.21 Operational performance of Gas Monetization remains strong; Hydrocarbons bookings and other execution strong, but had a welding issue on one contract (now resolved);…
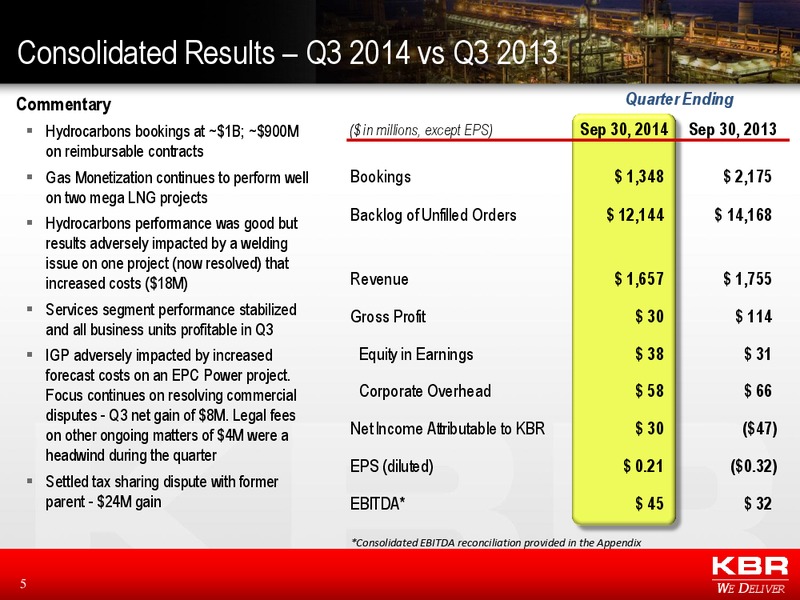
Consolidated Results Q3 2014 vs Q3 2013 Commentary Quarter Ending Hydrocarbons bookings at 1B; 900M ( in millions, except EPS) Sep 30, 2014 Sep 30, 2013 on reimbursable contracts Gas Monetization continues to perform well Bookings…
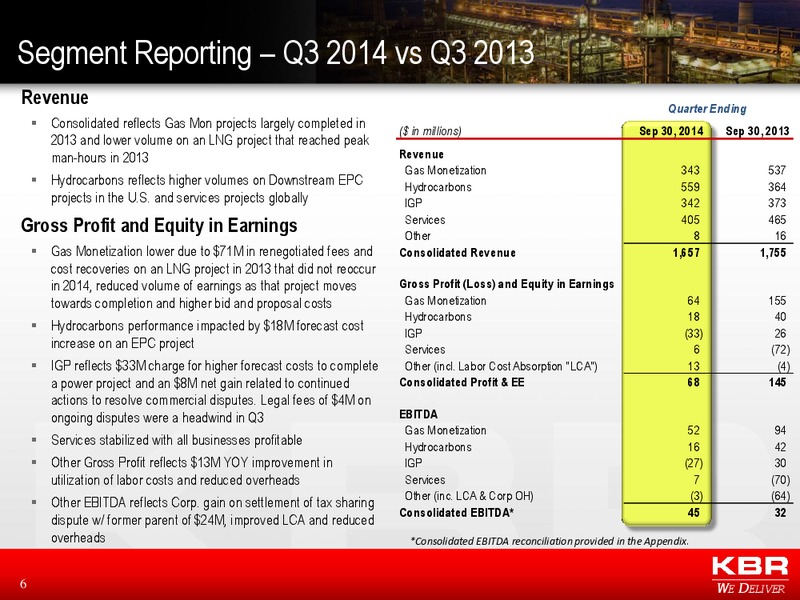
Segment Reporting Q3 2014 vs Q3 2013 Revenue Quarter Ending Consolidated reflects Gas Mon projects largely completed in ( in millions) Sep 30, 2014 Sep 30, 2013 2013 and lower volume on an LNG project that reached peak man-hours in…
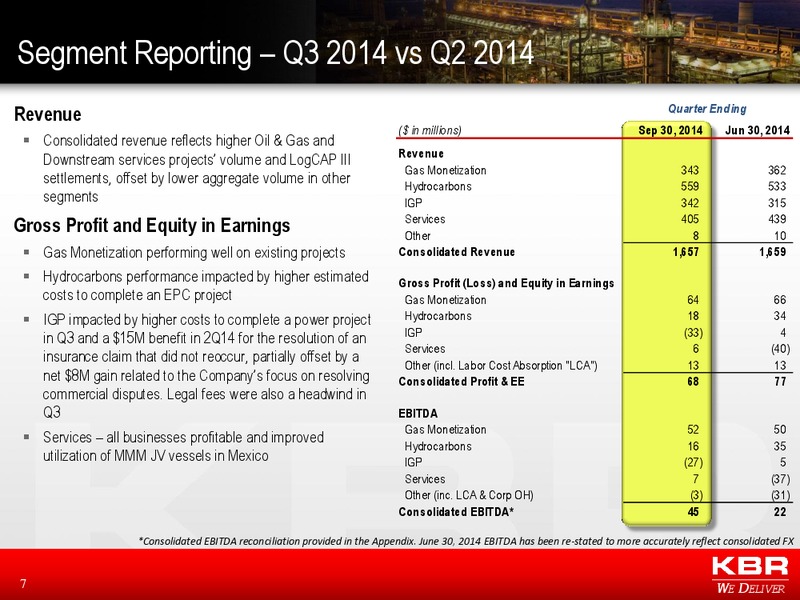
Segment Reporting Q3 2014 vs Q2 2014 Quarter Ending Revenue ( in millions) Sep 30, 2014 Jun 30, 2014 Consolidated revenue reflects higher Oil & Gas and Revenue Downstream services projects volume and LogCAP III Gas Monetization 343…
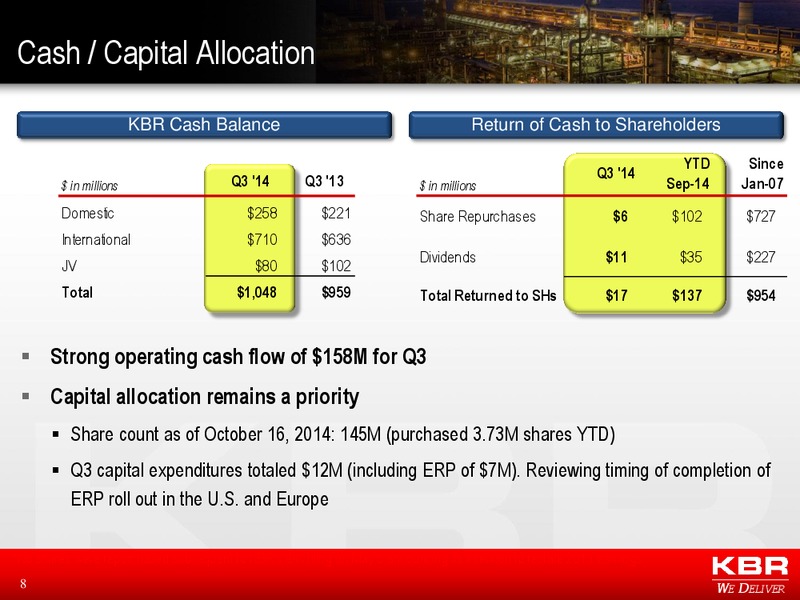
Cash / Capital Allocation KBR Cash Balance Return of Cash to Shareholders YTD Since Q3 '14 Q3 '13 Q3 '14 in millions in millions Sep-14 Jan-07 Domestic 258 221 Share Repurchases 6 102 727 International 710 636 Dividends 11 35 227…
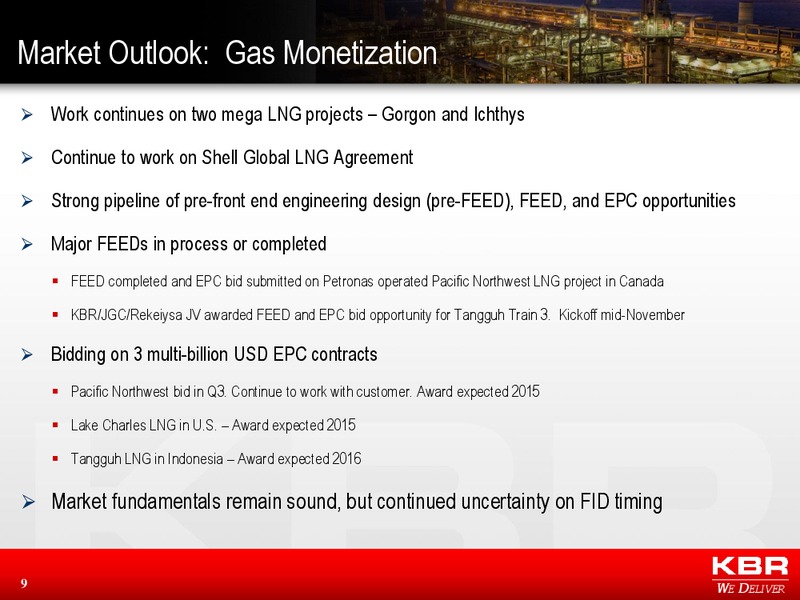
Market Outlook: Gas Monetization Work continues on two mega LNG projects Gorgon and Ichthys Continue to work on Shell Global LNG Agreement Strong pipeline of pre-front end engineering design (pre-FEED), FEED, and EPC opportunities…
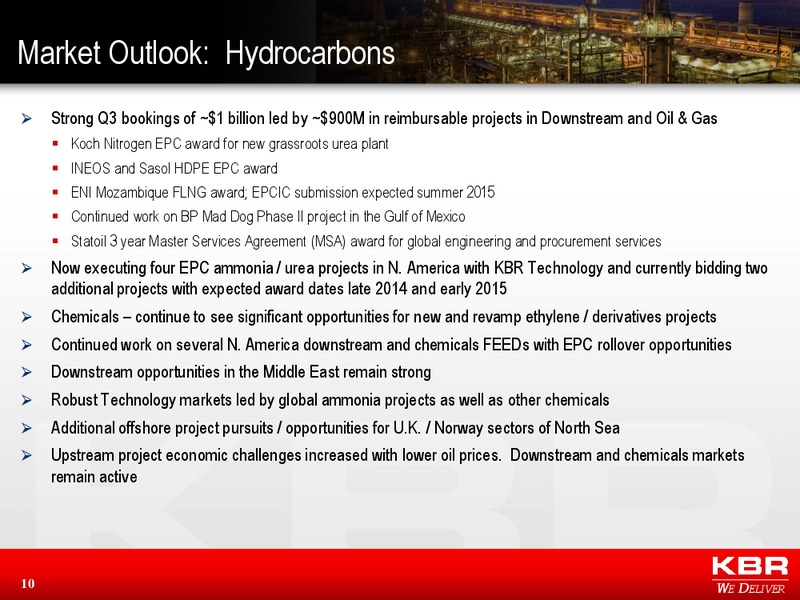
Market Outlook: Hydrocarbons Strong Q3 bookings of 1 billion led by 900M in reimbursable projects in Downstream and Oil & Gas Koch Nitrogen EPC award for new grassroots urea plant INEOS and Sasol HDPE EPC award ENI Mozambique FLNG…
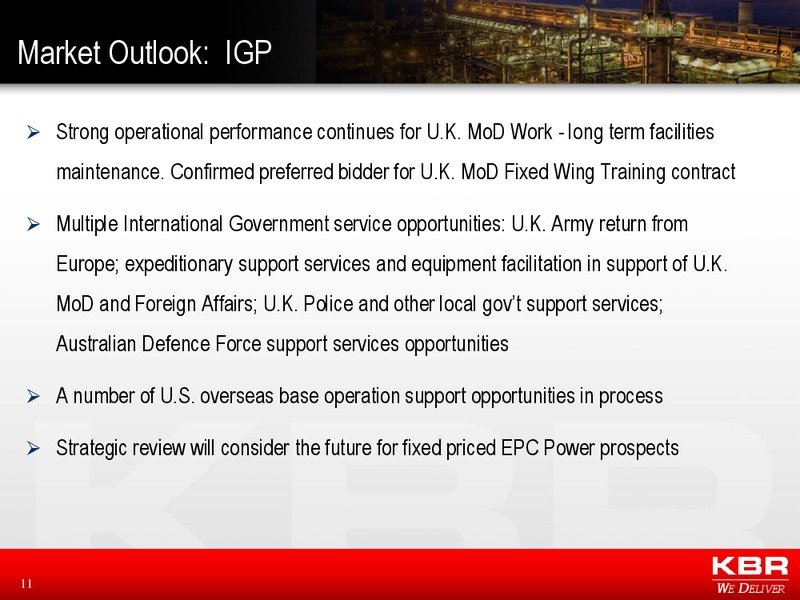
Market Outlook: IGP Strong operational performance continues for U.K. MoD Work - long term facilities maintenance. Confirmed preferred bidder for U.K. MoD Fixed Wing Training contract Multiple International Government service…
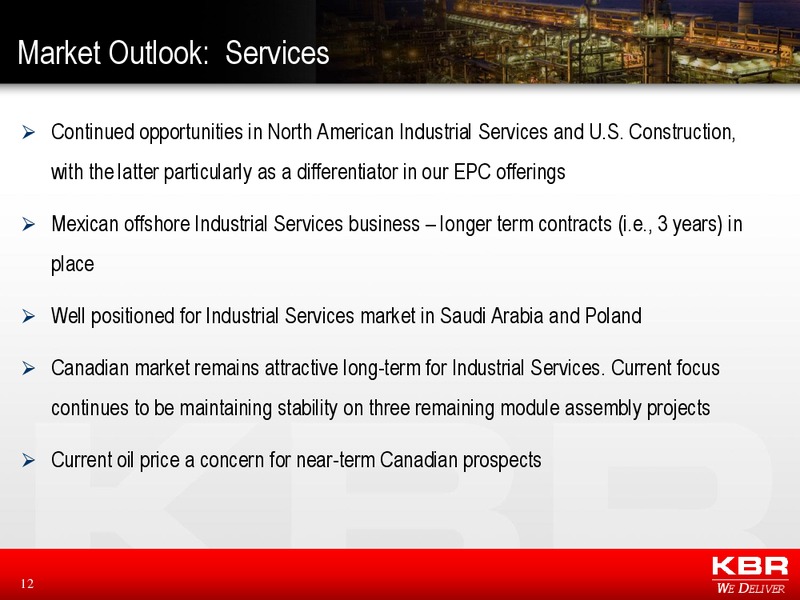
Market Outlook: Services Continued opportunities in North American Industrial Services and U.S. Construction, with the latter particularly as a differentiator in our EPC offerings Mexican offshore Industrial Services business longer…
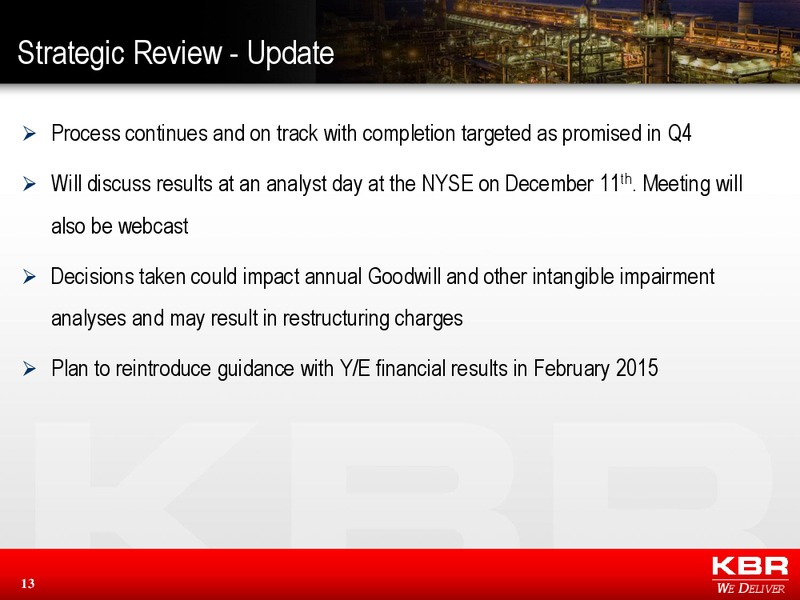
Strategic Review - Update Process continues and on track with completion targeted as promised in Q4 Will discuss results at an analyst day at the NYSE on December 11th. Meeting will also be webcast Decisions taken could impact…
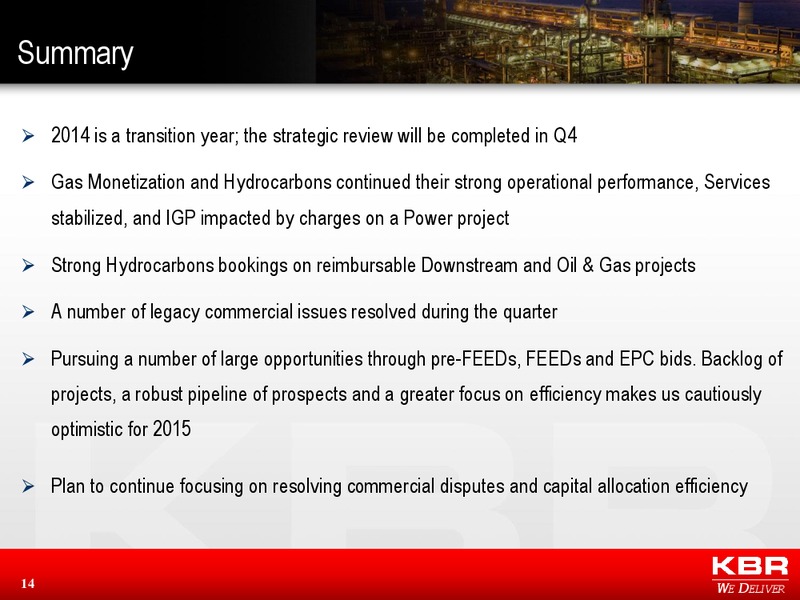
Summary 2014 is a transition year; the strategic review will be completed in Q4 Gas Monetization and Hydrocarbons continued their strong operational performance, Services stabilized, and IGP impacted by charges on a Power project…
WE DELIVER Appendix 15 WE DELIVER
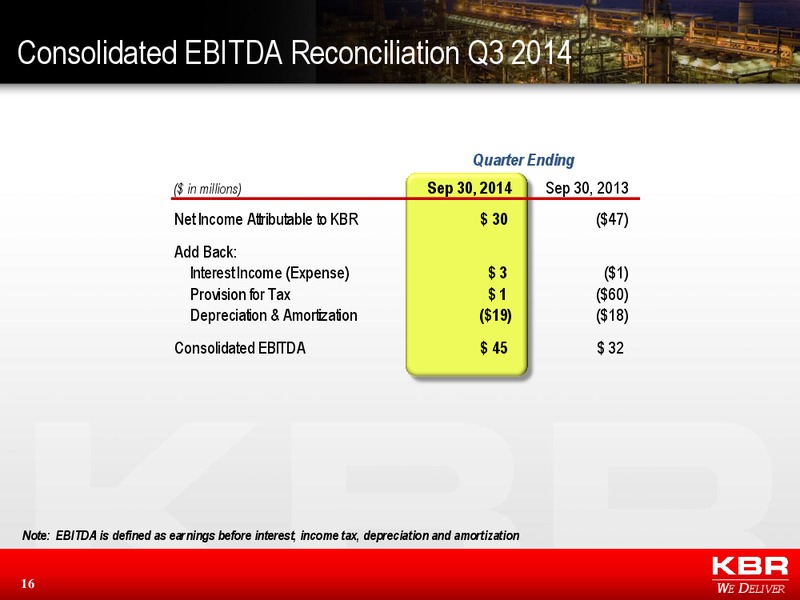
Consolidated EBITDA Reconciliation Q3 2014 Quarter Ending ( in millions) Sep 30, 2014 Sep 30, 2013 Net Income Attributable to KBR 30 (47) Add Back: Interest Income (Expense) 3 (1) Provision for Tax 1 (60) Depreciation &…
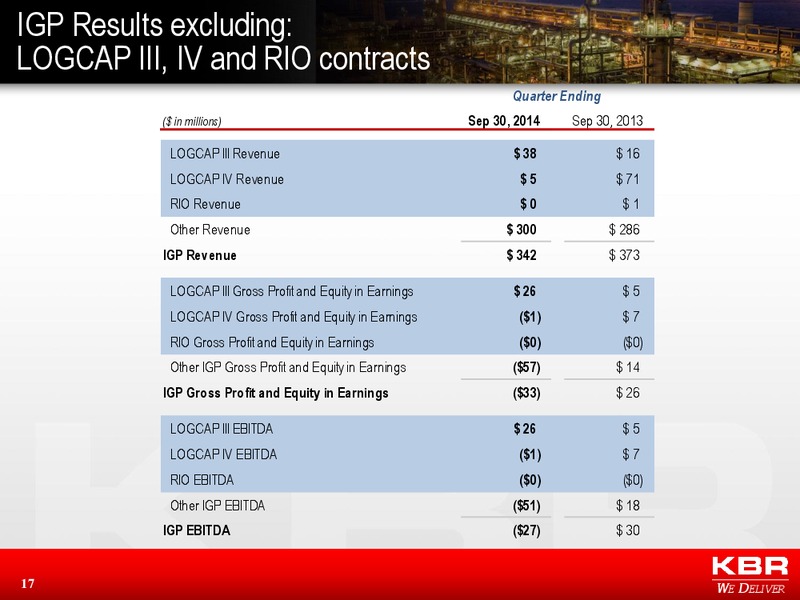
IGP Results excluding: LOGCAP III, IV and RIO contracts Quarter Ending ( in millions) Sep 30, 2014 Sep 30, 2013 LOGCAP III Revenue 38 16 LOGCAP IV Revenue 5 71 RIO Revenue 0 1 Other Revenue 300 286 IGP Revenue 342 373 LOGCAP III…
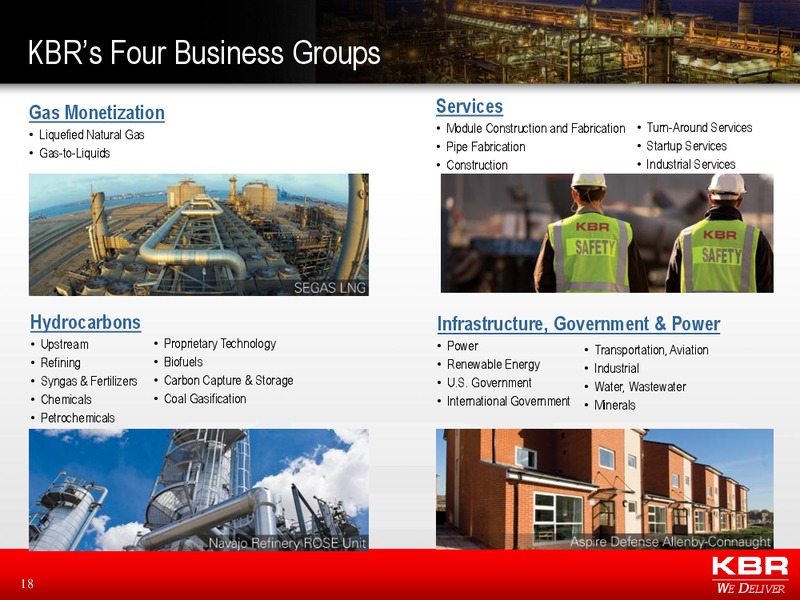
KBRs Four Business Groups Gas Monetization Services Liquefied Natural Gas Module Construction and Fabrication Turn-Around Services Pipe Fabrication Startup Services Gas-to-Liquids Construction Industrial Services Hydrocarbons…
 Loading...