Capital Market Story August 2014 We add value as one company
We create chemistry for a sustainable future Positioning Performance Perspective Ludwigshafen, Germany Nanjing, Antwerp, China Belgium Kuantan, Geismar, Malaysia USA Freeport, USA Verbund site The 1 chemical company A…
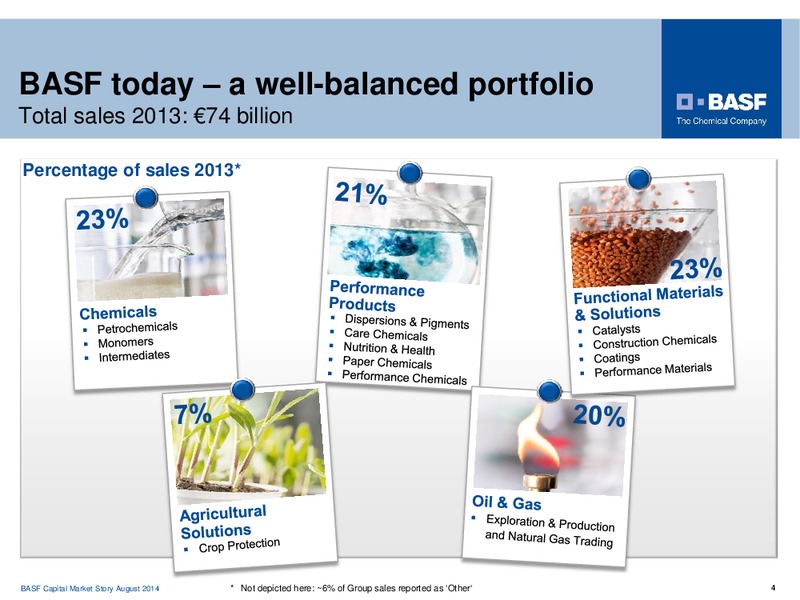
BASF today a well-balanced portfolio Total sales 2013: 74 billion Percentage of sales 2013* BASF Capital Market Story August 2014 * Not depicted here: 6% of Group sales reported as Other 4
Verbund generates 1 billion p.a. global cost savings*, supports sustainability Example Ludwigshafen: Shared use of on-site facilities: Global reduction in carbon avoidance of 7 million metric fire department, security, waste…
Business review BASF strategy & growth targets Strategic levers BASF Capital Market Story August 2014 6
BASF increases earnings considerably due to higher volumes Business performance Q214 Q213 vs. Q213 Sales 18.5 billion 18.4 billion +1% EBITDA 2.7 billion 2.5 billion +10% EBIT before special items 2.1 billion 1.8 billion +12% EBIT 2.0…
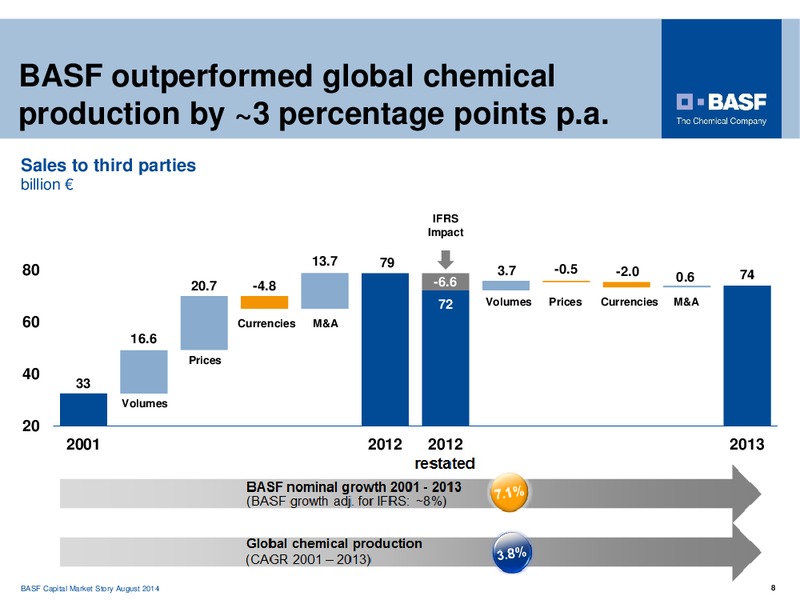
BASF outperformed global chemical production by 3 percentage points p.a. Sales to third parties billion IFRS Impact 13.7 79 80 3.7 -0.5 -2.0 0.6 74 20.7 -4.8 -6.6 72 Volumes Prices Currencies M&A 60 Currencies M&A 16.6 Prices…
Strong and profitable growth in emerging markets Sales BASF Group excl. Oil & Gas EBITDA BASF Group excl. Oil & Gas billion by location of customer billion by location of customer 59 60 10 CAGR 50 35% +10.2%* 33% 8 7.3 CAGR 40 CAGR…
Operational excellence Strong track record BASF Group* 20012013 Index CAGR 2001 2013 350 10 % EBITDA 300 8% Sales 250 3% Fixed costs 200 150 100 50 2001 2006 2009 2012 2013 * Excl. companies with major IFRS 10/11…
Attractive dividend yield Dividend per share Dividend payments in Dividend of 2.70 per share for 2013, an increase of 3.8% CAGR 2.70 2004-2013: Average annual 14% 2.50 2.60 2.20 dividend increase of 14% 1.95 1.95 Attractive…
Delivering consistent, long-term value Average annual performance with dividends reinvested Last 10 years Last 5 years August 2004 July 2014 August 2009 July 2014 +17.8% BASF +21.4% +4.5% Euro Stoxx 50 +6.8% +9.2% DAX 30…
Outlook 2014 confirmed Outlook 2014 We aim to increase our sales volumes excluding the effects of acquisitions and divestitures. Nonetheless, sales will decline slightly compared with 2013 due to the divestiture of the gas trading and…
Business review BASF strategy & growth targets Strategic levers BASF Capital Market Story August 2014 15
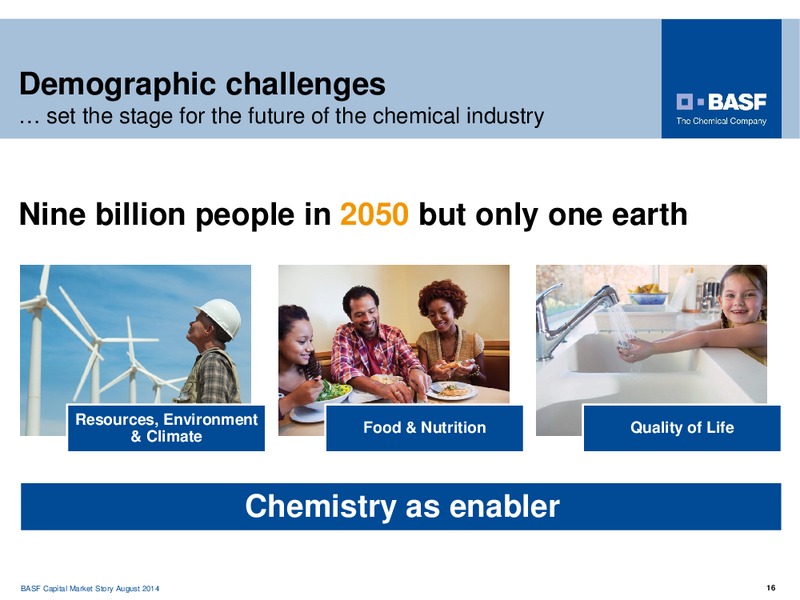
Demographic challenges set the stage for the future of the chemical industry Nine billion people in 2050 but only one earth Resources, Environment Food & Nutrition Quality of Life & Climate Chemistry as enabler BASF…
Key financial targets 2015 / 2020 are ambitious Growth targets Profitability targets Grow at least 2 percentage Earn a premium on cost of points above chemical capital of at least 2.0 billion production on average p.a. Sales 80…
Business review BASF strategy & growth targets Strategic levers Portfolio development Market approach Innovations for a sustainable future Investments Acquisitions Operational excellence BASF Capital Market Story August…
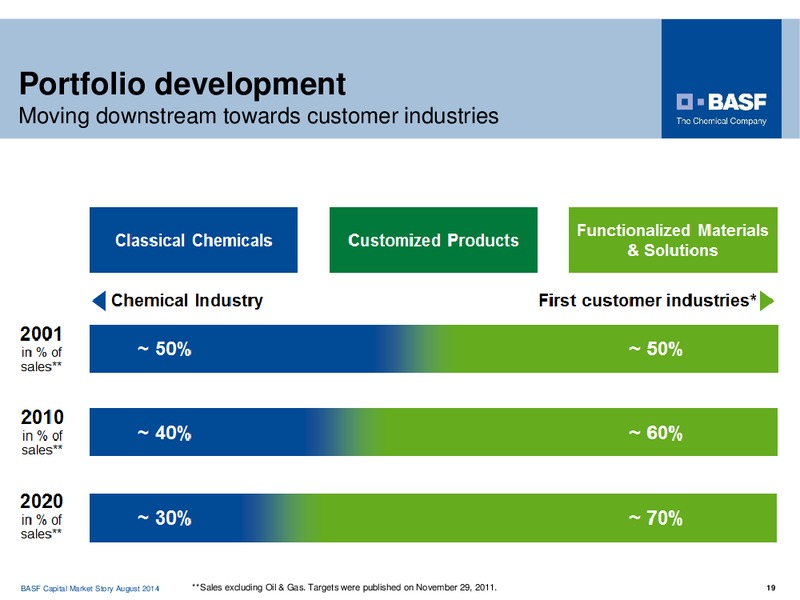
Portfolio development Moving downstream towards customer industries * Agriculture, Construction, Consumer Goods, Health & Nutrition, Electronics, Energy & Resources, Transportation BASF Capital Market Story August 2014 ** Sales…
Portfolio development Towards more market driven and innovative businesses Acquisitions BASF Divestitures core business Catalysts Printing systems Selected transactions Construction chemicals 2004 today Agro generics Water-based…
Market approach Cross-divisional customer industry approach BASF sales by Bubble Size: BASF divisional sales by first customer industry*/** first customer industry* Consumer goods 15 % Transportation 15 % Construction 10 %…
Cross-divisional approach BASFs technology Verbund combined with customer know-how Lightweight tridion cell Solar roof with transparent organic solar panels and OLED modules High performance foams E-textiles Infrared-reflective…
Customer Verbund - adidas and BASF Working together for disruptive innovation: Infinergy BASF Capital Market Story August 2014 23
Strong commitment to innovation Innovations for a sustainable future R&D expenditures Key facts in billion 1.8 billion R&D expenditure in 2013, further increase of R&D 2.0 2,0 spending planned in 2014 1.8 1.7 1.6 Corporate Research…
Chemistry-based innovations Growth and technology fields Global needs Key customer industries Growth fields Technology fields Batteries for Mobility Enzymes Resources, Materials, Environment Transportation Agriculture E-Power…
Enabling technology: Battery Materials Driving the future of electromobility Business potential 2020 BASF activities Strategic relevant market: 5 billion globally Start of business unit Battery Materials in 2012 (4 billion in Asia…
Investments Capex budget 2014-2018 by segment and region* Capex budget 2014-2018 Capex budget 2014-2018 by segment by region Performance Asia Pacific Products 18% 15% Chemicals South Europe Functional 33% America 49% Materials & 20 4%…
Investments Major projects Ammonia and MDI plant Acrylic acid complex gas-to-propylene in USA* Chongqing, China Camacari, Brazil TDI plant Aroma Ingredients Expansion oil & gas Ludwigshafen, Germany Kuantan, Malaysia…
Sales share from emerging markets to further increase *BASF definition: Developed markets include EU15, Norway, Switzerland, North America, Japan, Australia, New Zealand ** Sales excluding Oil & Gas BASF Capital Market Story…
Acquisitions will contribute to profitable growth in the future We want to acquire businesses which Generate profitable growth Provide a minimum return on above the industry average investment of 8% p.a. after tax Are…
Operational excellence programs STEP program on track: 1 billion earnings contribution by 2015 Annual earnings contribution STEP program in million Targeted annual earnings contribution of 1 billion by end of 2015 3,000 Optimization…
Restructuring in Performance Products Announced measures to strengthen competitiveness Measures Leather and textile Establishment of global innovation center in China chemicals Optimization of various functions and relocation to Asia…
 Loading...