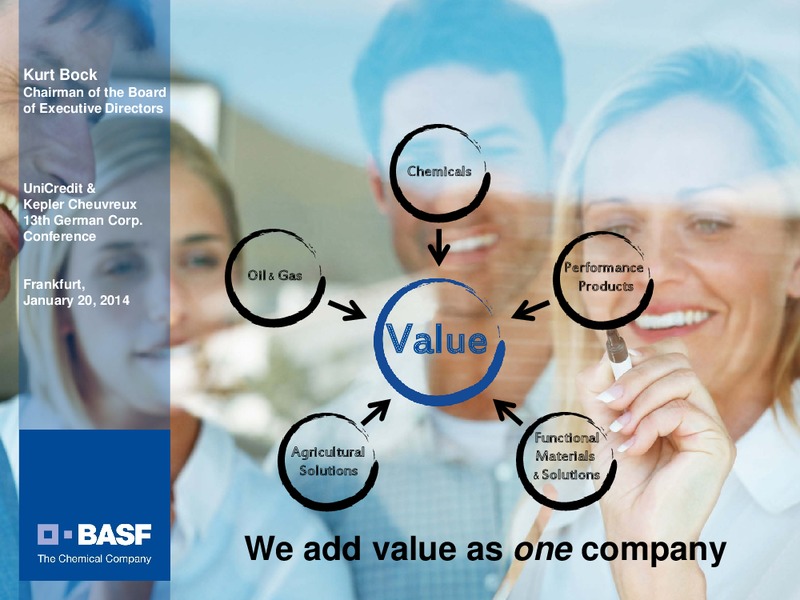
Kurt Bock Chairman of the Board of Executive Directors Chemicals UniCredit & Kepler Cheuvreux 13th German Corp. Conference Performance Oil & Gas Frankfurt, Products January 20, 2014 Value Functional Agricultural Materials…
Cautionary note regarding forward-looking statements This presentation may contain forward-looking statements that are subject to risks and uncertainties, including those pertaining to the anticipated benefits to be realized from the…
We create chemistry for a sustainable future Positioning Performance Perspective Ludwigshafen, Germany Nanjing, Antwerp, China Belgium Kuantan, Geismar, Malaysia USA Freeport, USA Verbund site The 1 chemical company…
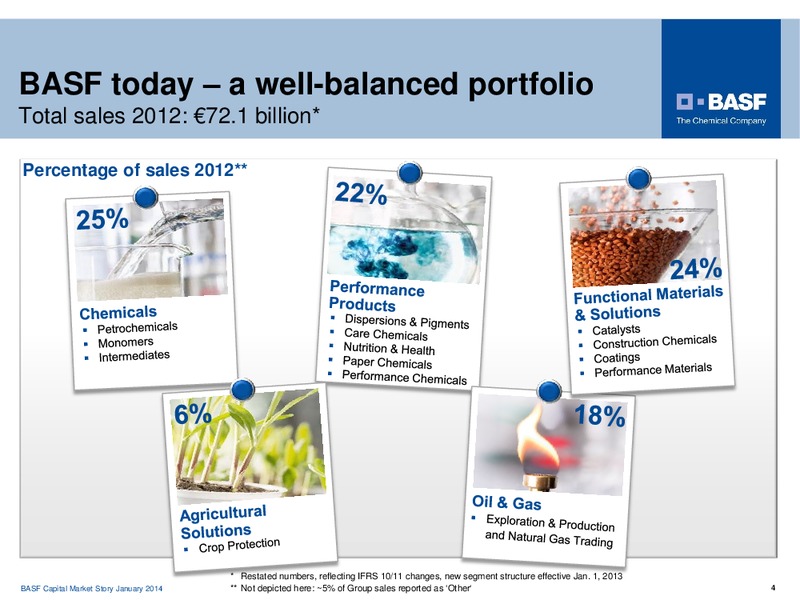
BASF today a well-balanced portfolio Total sales 2012: 72.1 billion* Percentage of sales 2012** * Restated numbers, reflecting IFRS 10/11 changes, new segment structure effective Jan. 1, 2013 BASF Capital Market Story January 2014…
Business review BASF strategy & growth targets Strategic levers BASF Capital Market Story January 2014 5
Robust 3rd quarter 2013 for BASF BASF Capital Market Story January 2014 6
Strong free cash flow generation * Cash provided by operating activities less capex (in 2005 before CTA) BASF Capital Market Story January 2014 ** 2009 adjusted for re-classification of settlement payments for currency derivatives 7
Delivering attractive shareholder returns Dividend payments Dividend of 2.60 per share for 2012 2003-2012: Average annual dividend increase of 16% Attractive dividend yield of 3.7% in 2012** Dividend yield above 3% in any given…
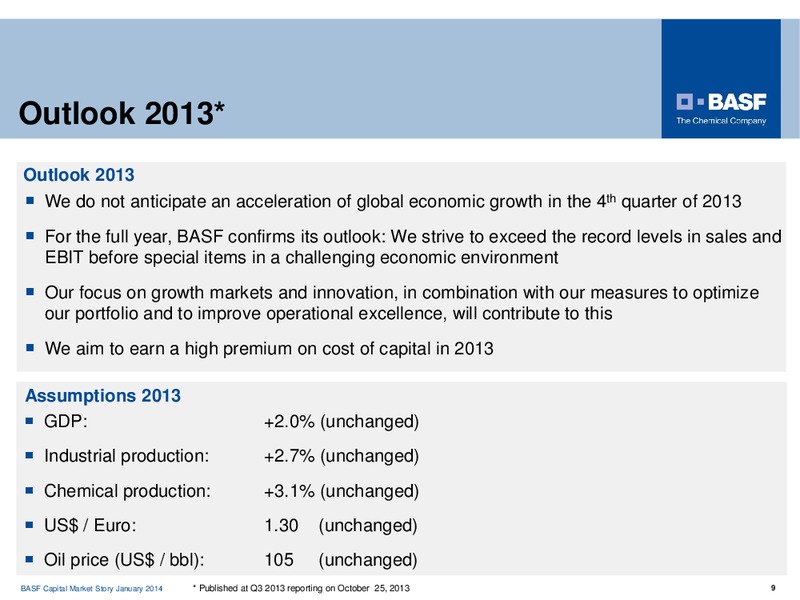
Outlook 2013* Outlook 2013 We do not anticipate an acceleration of global economic growth in the 4th quarter of 2013 For the full year, BASF confirms its outlook: We strive to exceed the record levels in sales and EBIT before special…
Delivering consistent, long-term value BASF Capital Market Story January 2014 10
Business review BASF strategy & growth targets Strategic levers BASF Capital Market Story January 2014 11
Demographic challenges set the stage for the future of the chemical industry Nine billion people in 2050 but only one earth Resources, Environment Food & Nutrition Quality of Life & Climate Chemistry as enabler BASF…
Key financial targets 2015 / 2020 are ambitious Growth targets Profitability targets Grow at least 2 percentage Earn a premium on cost of points above chemical capital of at least 2.0 billion production on average p.a. Sales 80…
Business review BASF strategy & growth targets Strategic levers Portfolio development Market approach Innovations for a sustainable future Investments Acquisitions Operational excellence BASF Capital Market Story January…
A different look at our current portfolio... Oil & Gas Classical Chemicals Customized Functionalized Products Materials & Solutions Excellent position and Chemical business Customer-oriented Integration of growth opportunities;…
Portfolio development Moving downstream towards customer industries Functionalized Materials Classical Chemicals Customized Products & Solutions Chemical Industry First customer industries* 2001 in % of 50% 50% sales** 2010 in…
Portfolio development Towards more market driven and innovative businesses Acquisitions BASF Divestitures core business Engineering plastics Pharma Selected transactions Electronic chemicals 2001 today* Fibers Catalysts Printing…
Market approach Cross-divisional customer industry approach BASF Capital Market Story January 2014 * Excluding Oil & Gas, Crop Protection and Other ** Nutrition & Health sales predominantly into Health & Nutrition market 18
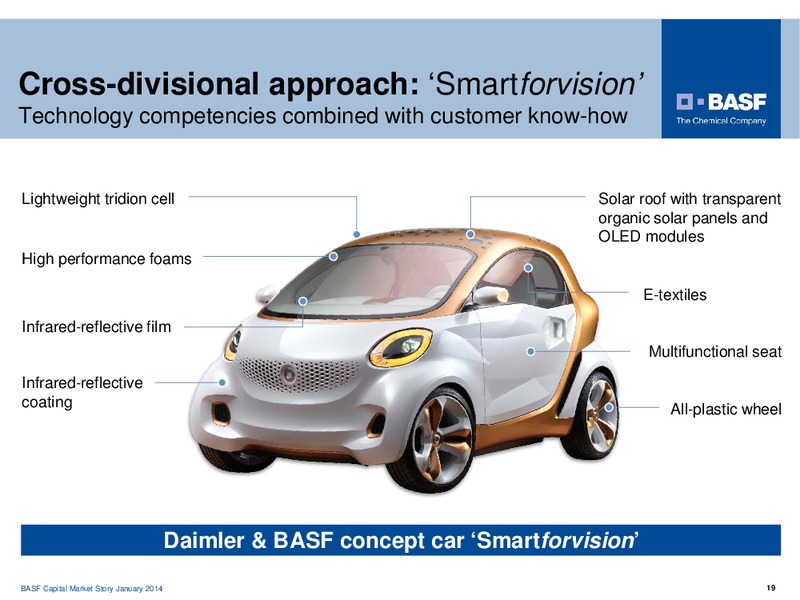
Cross-divisional approach: Smartforvision Technology competencies combined with customer know-how Lightweight tridion cell Solar roof with transparent organic solar panels and OLED modules High performance foams E-textiles…
Strong commitment to innovation Innovations for a sustainable future Key facts 1.7 billion R&D expenditures in 2012, further increase planned for 2013 10,500 employees in R&D 3,000 projects Research Verbund: About 1,950…
Innovation with adidas: Infinergy Technology competencies combined with customer know-how Key facts Joint development with adidas, illustrating our customer focus New cushioning material, provides highest energy return in the…
BASF growth fields focus on enabling technologies Resources, Environment & Climate Food & Nutrition Quality of life Chemistry as enabler Customer industries Consumer Health & Energy & Transportation Construction Electronics…
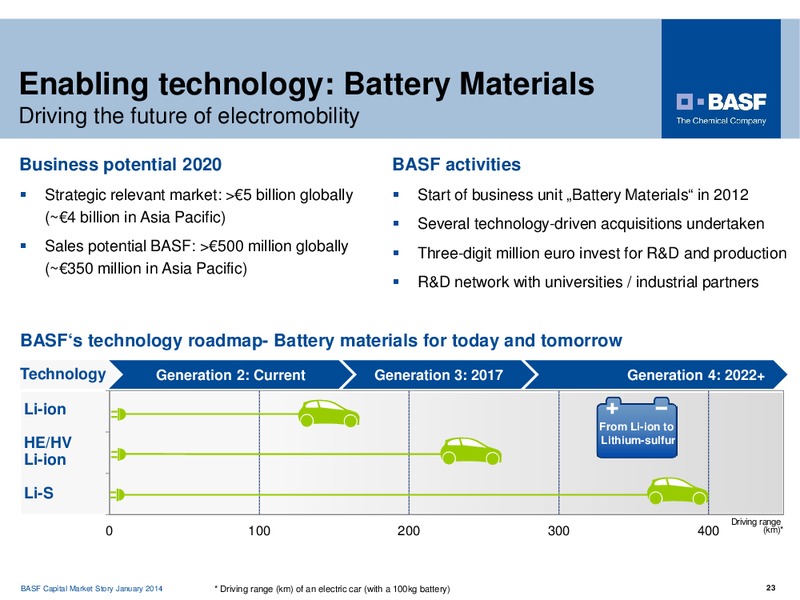
Enabling technology: Battery Materials Driving the future of electromobility Business potential 2020 BASF activities Strategic relevant market: 5 billion globally Start of business unit Battery Materials in 2012 (4 billion in Asia…
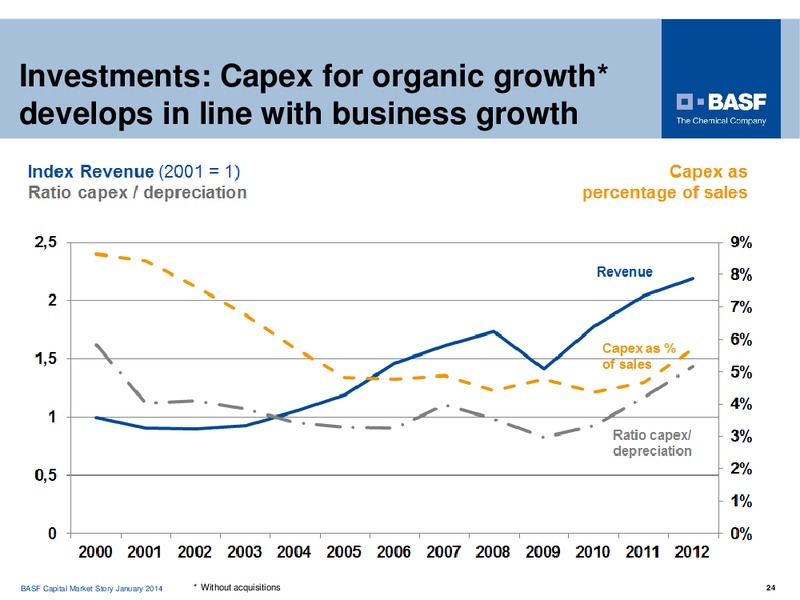
Investments: Capex for organic growth* develops in line with business growth BASF Capital Market Story January 2014 * Without acquisitions 24
Investments will boost future organic growth Future investments in billion BASF Capital Market Story January 2014 25
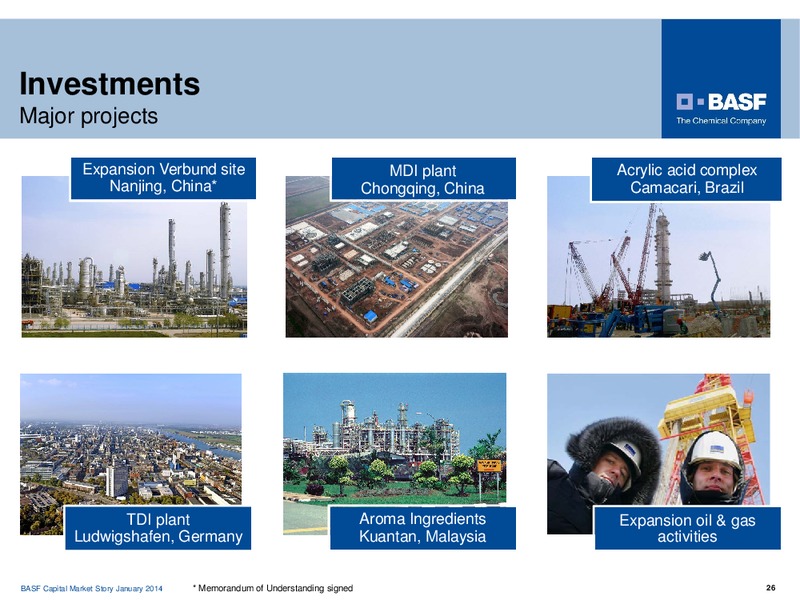
Investments Major projects Expansion Verbund site MDI plant Acrylic acid complex Nanjing, China* Chongqing, China Camacari, Brazil TDI plant Aroma Ingredients Expansion oil & gas Ludwigshafen, Germany Kuantan, Malaysia…
BASF aims to further increase its sales share from emerging markets Developed markets* Emerging markets 2001 in % of sales 78% 22% (28 bn**) 2012 in % of sales 65% 35% (62bn**) 2020 in % of 55% 45% sales** *BASF…
Acquisitions will contribute to profitable growth in the future We want to acquire businesses which Generate profitable growth Provide a minimum return on above the industry average investment of 8% p.a. after tax Are…
Operational excellence programs STEP program on track: 1 billion earnings contribution by 2015 NEXT Program NEXT program successfully completed Annual earnings contribution of 1 billion achieved in 2012 STrategic Excellence Program…
Appendix 1: Q3 2013 Reporting BASF Capital Market Story January 2014 30
Important corporate developments Restructuring in Pigments Cash offer for Verenium Transaction with Statoil business enzyme biotechnology completed Optimization of global Cash offer of 4 US dollars Transaction completed production…
Chemicals Pressure on volumes and margins Q313 segment sales (million ) vs. Q312 EBIT before special items (million ) Intermediates Monomers 700 1,599 800 650 (7%) (11%) 569 600 495 527 445 4,224 400 (8%) 200 Petrochemicals 0…
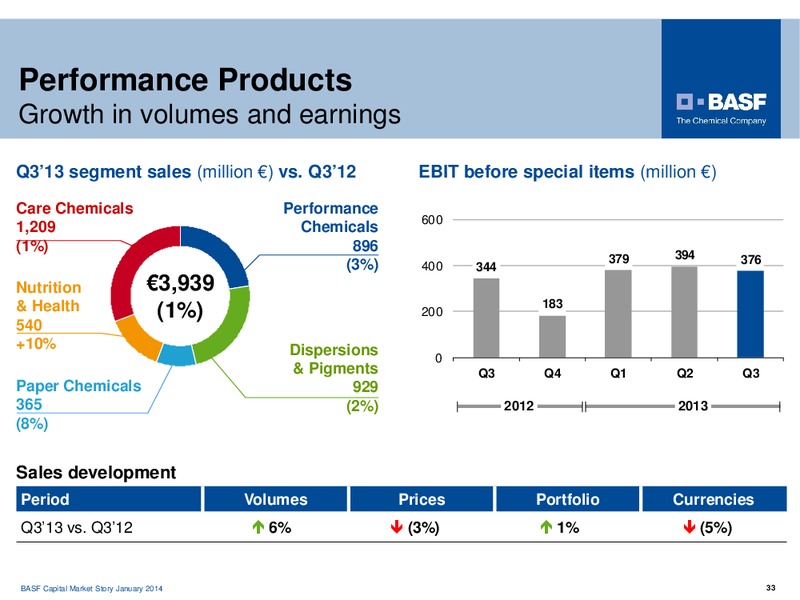
Performance Products Growth in volumes and earnings Q313 segment sales (million ) vs. Q312 EBIT before special items (million ) Care Chemicals Performance 600 1,209 Chemicals (1%) 896 379 394 376 (3%) 400 344 Nutrition 3,939 & Health…
Functional Materials & Solutions Sound overall demand, especially in automotive Q313 segment sales (million ) vs. Q312 EBIT before special items (million ) Performance Construction Materials Chemicals 600 1,669 576 +5% (9%) 400 293…
Oil & Gas Substantially higher net income Q313 segment sales (million ) vs. Q312 EBIT bSI/Net income (million ) Natural Gas Exploration & 499 Trading Production 500 754 422 2,376 400 +29% +15% 3,130 300 396 360 +25% 200 451 318…
Appendix 2: Charts from Roundtable Oil & Gas (London, September 13, 2013) BASF Capital Market Story January 2014 37
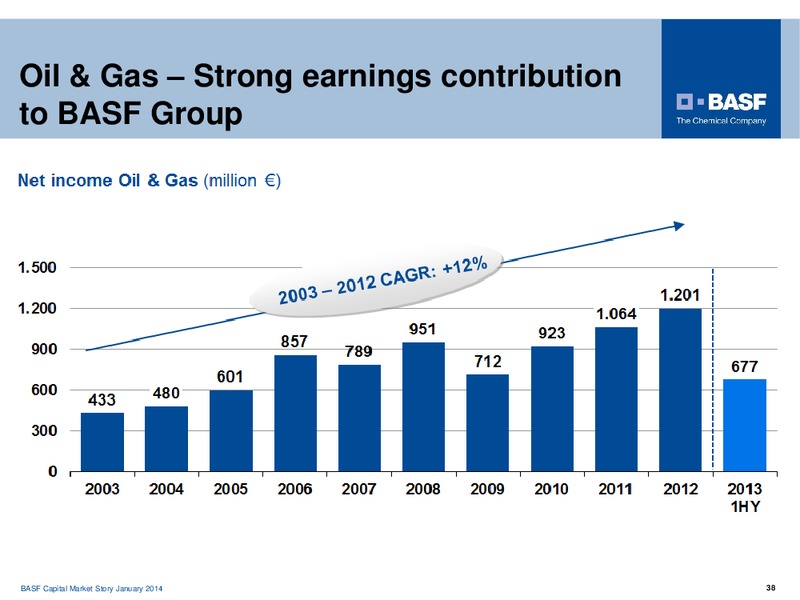
Oil & Gas Strong earnings contribution to BASF Group BASF Capital Market Story January 2014 38
Oil & Gas Strong free cash flow contribution to BASF Group 45% of operating cash flow delivered to BASF Group (Avg. 2003-2012) * Wintershall cash flow, not BASF Group consolidated view BASF Capital Market Story January 2014 ** Free…
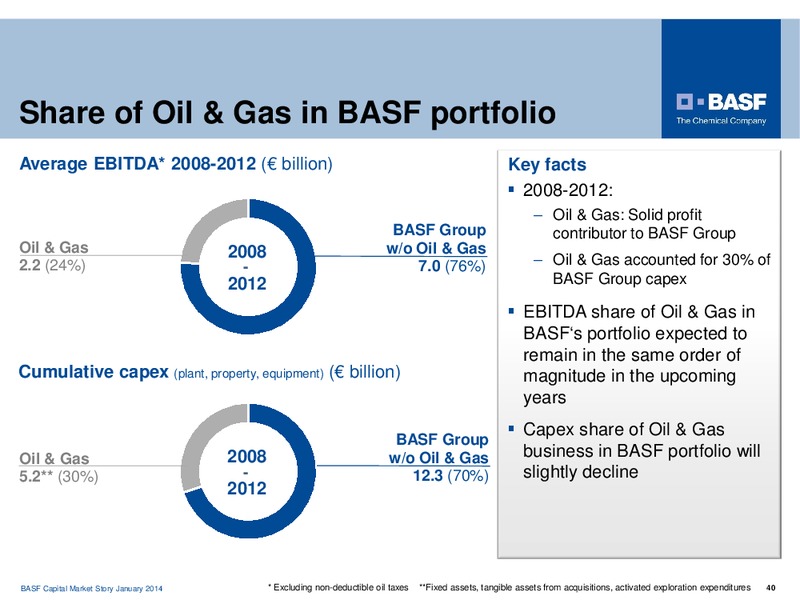
Share of Oil & Gas in BASF portfolio Average EBITDA* 2008-2012 ( billion) Key facts 2008-2012: Oil & Gas: Solid profit BASF Group contributor to BASF Group Oil & Gas 2008 w/o Oil & Gas 2.2 (24%) - 7.0 (76%) Oil & Gas accounted for 30%…
Oil & Gas provides earnings stability EBIT before special items BASF Group* (million ) Excluding non-compensable taxes on oil production 8.000 7.000 6.000 5.000 4.000 3.000 2.000 1.000 0 2003 2004 2005 2006 2007 2008 2009 2010 2011…
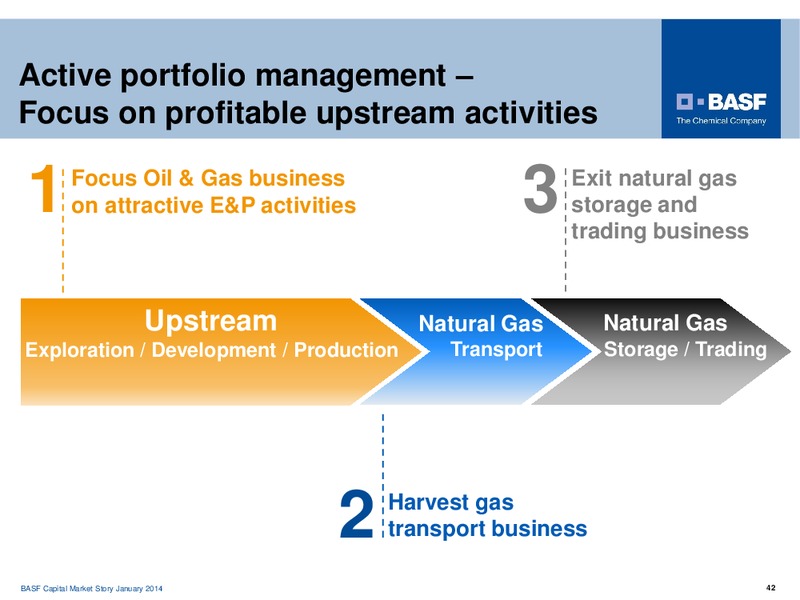
Active portfolio management Focus on profitable upstream activities 1 Focus Oil & Gas business on attractive E&P activities 3 Exit natural gas storage and trading business Upstream Natural Gas Natural Gas Exploration /…
Oil & Gas Excellent further growth opportunities Production volumes (million boe)* Key Facts 2015 target maintained despite 200 restatement (Effect: -18 million boe in 2012) 160 150 Continue to significantly invest 126 in core and…
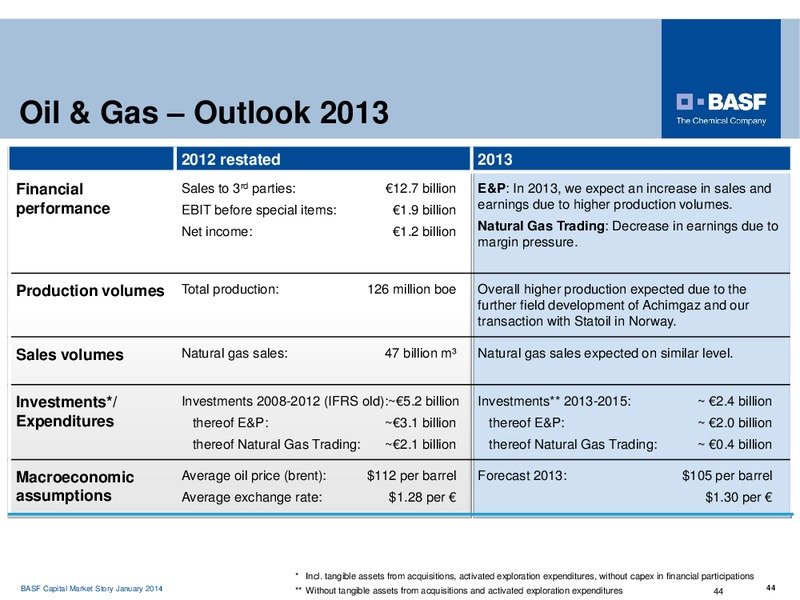
Oil & Gas Outlook 2013 2012 restated 2013 Financial Sales to 3rd parties: 12.7 billion E&P: In 2013, we expect an increase in sales and performance EBIT before special items: 1.9 billion earnings due to higher production volumes. Net…
 Loading...