Laggards or Leaders Global Energy Security, Affordability and Sustainability Grant King, Managing Director, Origin Energy AmCham Address, Sydney, 5 December 2014
As the world grows.... so does demand for energy and global emissions Cumulative Energy CO2 Emissions The IEA states that energy use accounts for 83% of Source: IEA WEO 2014 New Policies Scenario, November 2014 carbon emissions…
The Kyoto Protocol signed in 1997 established the architecture we have today that has resulted in progressive carbon emissions reduction targets out to 2020 Source: WEO 2014 and Origin analysis Country Estimated 2020 Base Year Binding…
The carbon price and the RET were interdependent policy instruments established to help Australia achieve its 2020 target Carbon Pricing Mechanism The carbon pricing mechanism obligated electricity generators and other large emitters…
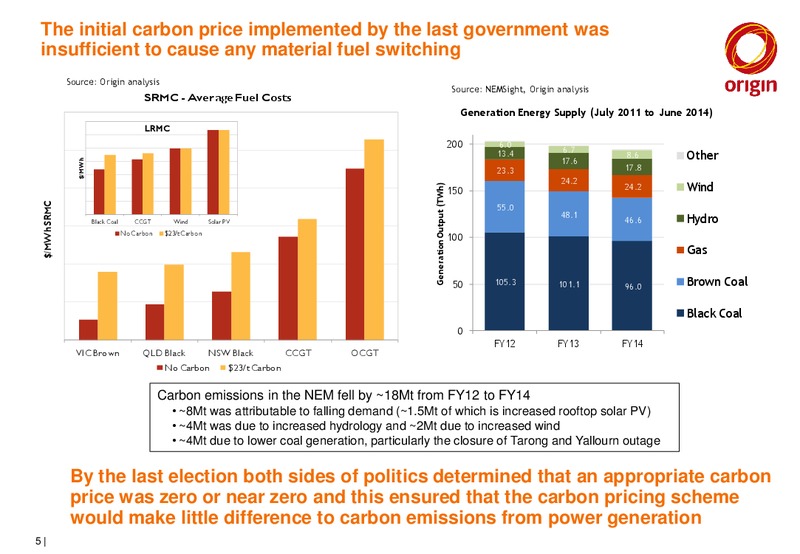
The initial carbon price implemented by the last government was insufficient to cause any material fuel switching Source: Origin analysis Source: NEMSight, Origin analysis SRMC - Average Fuel Costs Generation Energy Supply (July…
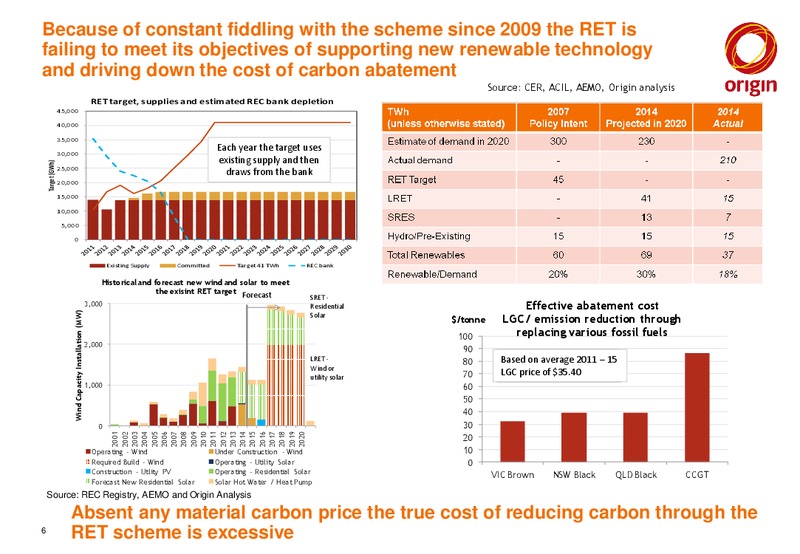
Because of constant fiddling with the scheme since 2009 the RET is failing to meet its objectives of supporting new renewable technology and driving down the cost of carbon abatement Source: CER, ACIL, AEMO, Origin analysis RET target,…
With changes in forecast demand for energy the 2020 target is significantly lower than previously anticipated Source: Energetics, October 2013 There are a range Direct Action approaches to reducing emissions in other countries…
We have allowed our progress to be measured against emissions per capita, which makes us look like a laggard, but this fails to understand the true nature of the Australian economy Australia is 0.3% of the worlds population, 1.5% of…
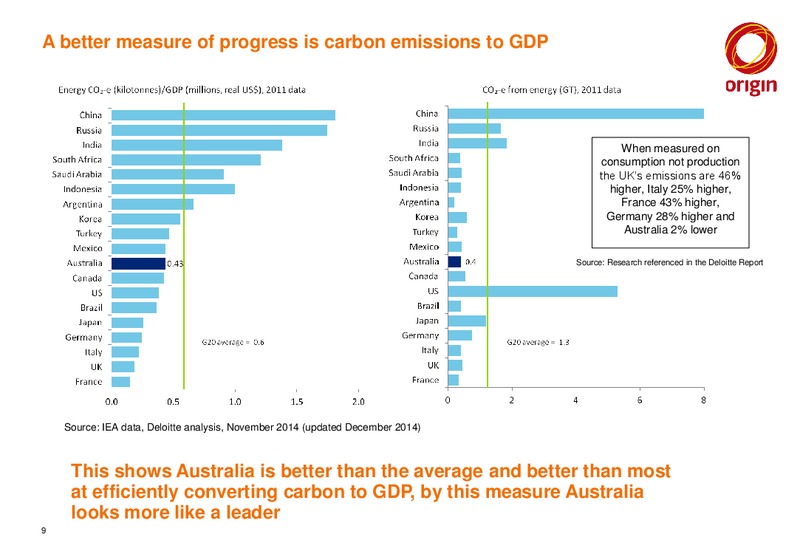
A better measure of progress is carbon emissions to GDP When measured on consumption not production the UKs emissions are 46% higher, Italy 25% higher, France 43% higher, Germany 28% higher and Australia 2% lower Source:…
Deloitte has updated its analysis for energy related carbon emissions with data from WEO 2014 Source: IEA data, Deloitte analysis, December 2014 It shows that the line is moving in the right direction with the average falling…
The challenge is to grow GDP, improve carbon efficiency and over time reduce absolute carbon emissions across the G20 as a whole Source: IEA data, Deloitte analysis, December 2014 Source: IEA data, Deloitte analysis, December…
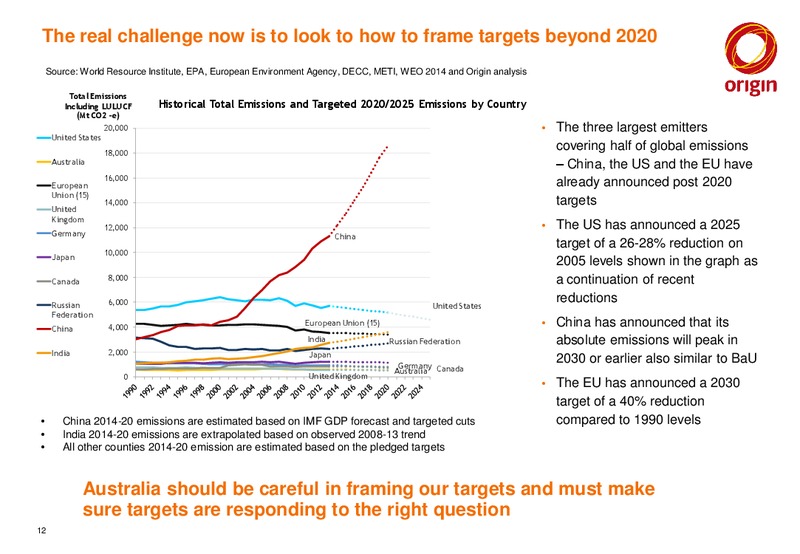
The real challenge now is to look to how to frame targets beyond 2020 Source: World Resource Institute, EPA, European Environment Agency, DECC, METI, WEO 2014 and Origin analysis Total Emissions Including LULUCF Historical Total…
The United States has had the most significant decrease in carbon emissions in recent years driven by shale gas The New Policies scenario assumes that announced policies are implemented including the US EPAs Clean Power Plan…
Chinas economic and environmental priorities to date have been creating jobs and improving air quality. The main ways to do this also reduce carbon emissions The New Policies scenario assumes that announced policies are implemented…
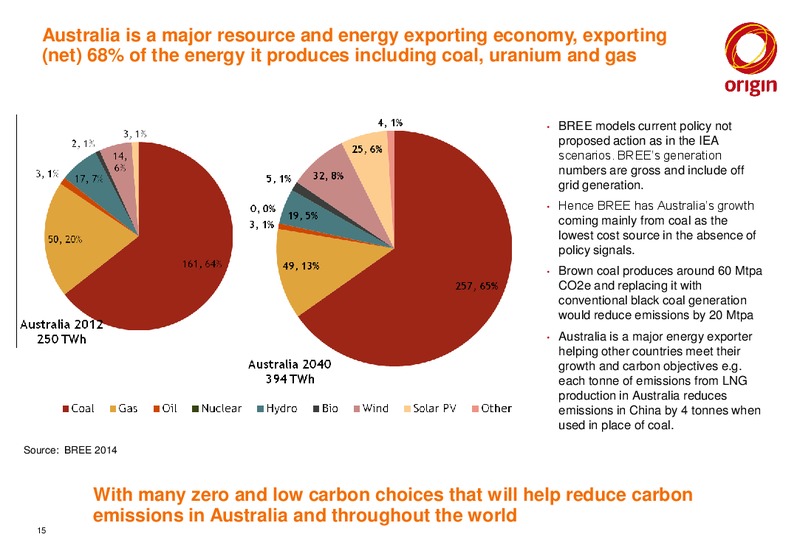
Australia is a major resource and energy exporting economy, exporting (net) 68% of the energy it produces including coal, uranium and gas BREE models current policy not proposed action as in the IEA scenarios. BREEs generation…
Russia has the best indigenous sources of base load low and zero carbon emissions fuels in the world Russia has abundant low carbon options with gas, nuclear and hydro but is inefficient in converting energy into GDP Russias…
An Emissions Trading Scheme and strong incentives for wind and solar are helping the EU to meet its 2020 emissions reduction targets The New Policies scenario assumes that announced policies are implemented including the EU…
Origin recognises that climate change is a global challenge and we unequivocally support measures to progressively reduce carbon emissions We need bipartisan support for a more balanced and achievable RET Technology diversity and…
 Loading...