ION Earnings Call Q2 2014 Earnings Call Presentation August 7, 2014
Corporate Participants and Contact Information BRIAN HANSON MIKE MORRISON President and Vice President Chief Executive Officer Corporate Finance CONTACT INFORMATION If you have technical problems during the call, please…
ION Q2 2014 Overview Revenues 121M, up slightly from 2013 OceanGeo revenues on Trinidad project Record 2Q Software sales Solutions down, impacted by reduced exploration spending Reported EPS 0.01 including a gain on sale Source…
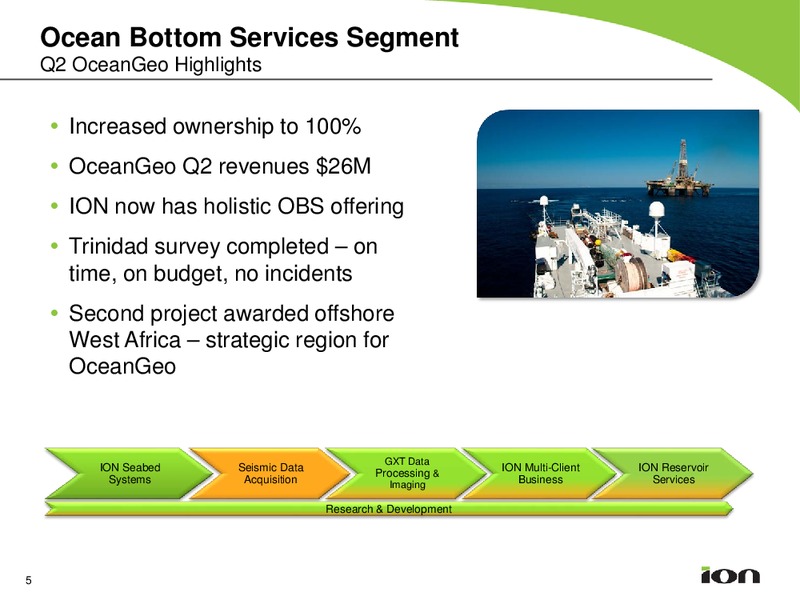
Ocean Bottom Services Segment Q2 OceanGeo Highlights Increased ownership to 100% OceanGeo Q2 revenues 26M ION now has holistic OBS offering Trinidad survey completed on time, on budget, no incidents Second project awarded…
OBS Market Update Q2 14 OBS strong growth continues, OBS Acquisition Services Expenditure Millions driven by: 1400 Need for superior data for 1200 production seismic and life-of- 1000 field management 800 Improving OBS…
Solutions Segment Q2 GeoVentures Highlights Q2 revenues 63M, down 29% Y/Y Good traction on new programs on Australia Northwest Shelf, offshore East Africa and Ireland Maintaining high standards for underwriting Seeing…
Solutions Segment Q2 Data Processing Highlights 1H 14 revenues up 3% Y/Y Expect data processing business to remain soft for remainder of year Estimated 2H data processing revenues to be flat Y/Y Before Full Waveform Inversion…
Software and Systems Segments Q2 Highlights Software Segment Record Q2 revenues, up 25% Y/Y Strong Orca and Gator licensing Penetrating Tier 2 contractor base Gator II Systems Segment Q2 revenues 22M, down slightly Y/Y…
ION Q2 14 Highlights Revenue M Op. Margin % Revenues up slightly Y/Y 150 15% Solutions down 29% 100 10% 6% Software up 25% 50 5% 3% Systems down 6% - 0% Q2 13 Q2 14 Q2 13 Q2 14 OceanGeo revenues from Solutions Systems Trinidad…
Solutions Segment Financial Overview Q2 14 Revenue by Type M Solutions segment revenues down Y/Y: 100 New Ventures down 24% 80 Data libraries down 37% 60 Data processing down 30% 40 20 Decreased operating margin from -…
Software Segment Financial Overview Q2 14 Revenue by Type M Software segment revenues up 12 25% Y/Y 10 8 6 Record Q2 revenues 4 2 Increased Orca and Gator - licensing revenues Q2 13 Q2 14 Software Systems Services…
Systems Segment Financial Overview Q2 14 Revenue by Type M Systems segment revenues down 35 30 6% Y/Y 25 20 15 Reduced new marine positioning 10 sales reflects overcapacity in marine 5 contractor market - Q2 13 Q2 14 Towed…
Ocean Bottom Services Segment Financial Overview Q2 14 Q2 14 (M) Revenues of 26M on Trinidad 30 project (completed end of May) 25 20 15 Operating profit of 6M, or 25% 10 operating margin 5 - Revenue Op Profit Began…
INOVA Geophysical Financial Overview Q2 14 Q1 Revenues M Q1 Op. Margin % Q1 2014 In ION Q2 14 Results 30 Revenues of 27M, net loss of 0% 25 -10% (4M) -10% 20 BGP purchases of 8% of revenues -20% 15 (2m) 10 -30% -39%…
Financial Overview Cash Flow SUMMARIZED CASH FLOW Thousands Q2 13 Q2 14 Cash from operations 23,542 19,082 Working capital (29,756) (5,026) Multi-client investment (19,821) (11,964) PP&E Capital Expenditures (5,189) (2,546)…
Financial Overview Balance Sheet as of June 30, 2014 Capital Employed M Capital Book Value M 700 700 600 600 500 500 243M 246M 400 400 300 300 200 200 100 197M 158M 100 241M 191M 44M 33M 0 0 Q1 14 Q2 14 Q1 14 Q2…
Summary Continued softness in exploration spending into foreseeable future Broadening of customer base for multi-client programs somewhat offsetting pause in spending by IOCs Managing the business for extended slowdown through…
 Loading...