BUMI ARMADA BERHAD 1H 2014 Results Presentation Knots Ahead of the Rest
Disclaimer 2
1. External Market & Leading Indicators Knots Ahead of the Rest
Leading Indicators Brent Crude Price Prices have remained stable amid global economic/political uncertainty. Conducive for shallow water & deepwater production. Brent Crude 3 Year Historical Price Source: Bloomberg 4
Cost efficiency will be critical Capex and opex costs have effectively more than doubled over the last 10 years. Costs have held at or near record levels; uptrend will continue. IHS CERA Upstream Capital Cost Index IHS CERA Upstream…
Tight cash-flow for spending or returns in 2014-2017 Majors: allocation of upstream free cash flows (US/boe) 2525 120 120 100 100 2020 Spend and margin (/boe) Spend and margin (/boe) 8080 Brent (/bbl) 1515…
Oil companies are trying to manage their returns Investment in deepwater will Oil Cos are having to manage their continue. portfolios. Greenfield project IRRs by theme New project exposure ranked by returns 30 20% 15-20% 12-15%…
North American, Africa and Europe likely to get most of the money North America is a big focus of Canada US122 Europe US74 bn discretionary spend 2014-2018, with bn 60% operated by majors Independents prominent. The Majors 12%…
FPSO Demand High fleet growth for the next 5 years. Continues to be a favoured solution with strong project pipeline. Spending incurred by FPSO development forecasted by Wood Mackenzie to be 30 billion per annum by 2016. 9
Market/Prospects 10
Outstanding FPSO Bids No. Project 1. Eni OCTP, Ghana 2. Eni Etan, Nigeria 3. Tullow Oil Kudu, Namibia 4. Petrobras Tartaruga, Brazil 5. Petrobras Libra, Brazil 6. Cobalt Cameia, Angola 11
2. Operational Highlights Knots Ahead of the Rest
Operational Highlights FPSO Received a Letter of Intent for an FPSO for the Madura BD Field in Indonesia. Armada Claire completed hook-up to Balnaves field, Australia and achieved first oil. Contract for eni 15/06 has been signed.…
FPSO Madura BD Field Details Client/Operator: Husky-CNOOC Madura Limited (HCML) Country: Indonesia Location: Madura Strait East Java, about 65 km east of Surabaya and about 16km south of Madura Island. Water depth: Approximately…
Operational Highlights OSV Up to 80% Class-A vessel utilisation. Commenced fleet renewal exercise with focus on Class-B vessels (sold 1 vessel in H1 2014 with another 4 in advanced negotiations). 2 MPSVs delivered in 2014; 4 more…
Operational Highlights OFS Continue to bid for well service jobs in Europe, West Africa and Malaysia. Gas Development & Technology Qualified for FLNG FEED Continued rapid build-up. Bumi Armada FLNG Concept 16
3. Financial Highlights Knots Ahead of the Rest
Key takeaways Q2 Net Profit increased 51.9% from RM64.8 mil to RM98.4 mil. YTD Net Profit shed 26.4% from RM221.6 mil to RM163.2 mil Q2 EBITDA increased 17.7% from RM223.1 mil to RM262.6 mil. YTD EBITDA shed 2.5% from RM498.3 mil to…
Revenue composition by business units Q2 2014 vs. Q1 2014 (in RMmil) Performance in established segments driven by the underlying activities FPSO OSV +18.3% 231.5 -2.0% 195.7 156.2 153.0 Q1 2014 Q2 2014 Q1 2014 Q2 2014 FPSO…
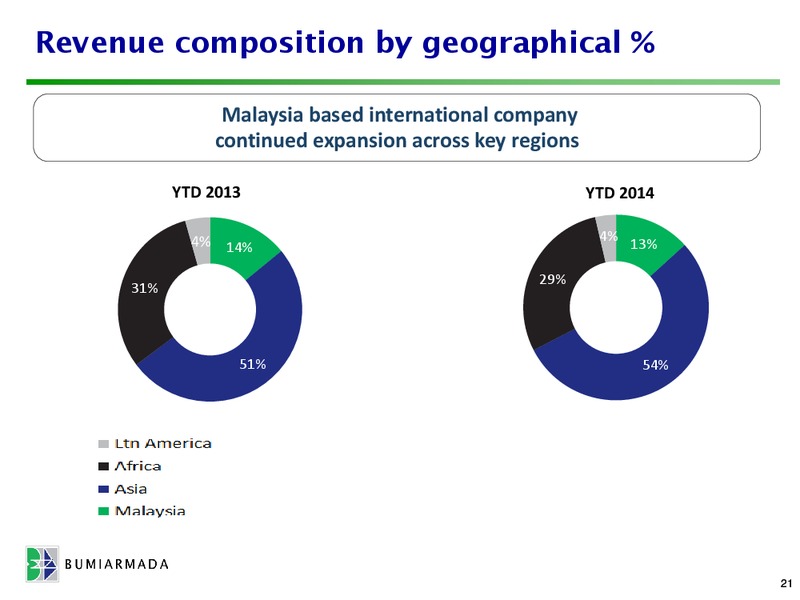
Revenue composition by geographical % Malaysia based international company continued expansion across key regions YTD 2013 YTD 2014 4% 4% 14% 13% 29% 31% 51% 54% 21
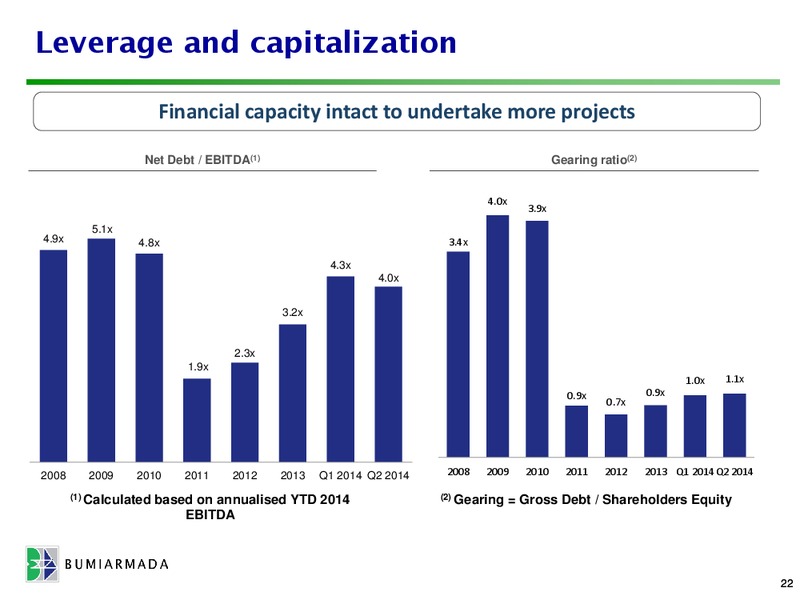
Leverage and capitalization Financial capacity intact to undertake more projects Net Debt / EBITDA(1) Gearing ratio(2) 4.5x 4.0x 4.0x 3.9x 5.1x 4.9x 4.8x 3.5x 3.4x 4.3x 3.0x 4.0x 2.5x 3.2x 2.0x 2.3x 1.9x 1.5x 1.0x…
Order book as at 30 June 2014 63.2% increase in quality firm backlog to RM21.7 bn (Q1: RM13.3 bn) As at 30 June 2014, the Groups order book stood at RM21.7 billion compared to RM13.3 billion as at 31 March 2014. Upon expiration of the…
 Loading...