WE DELIVER Q2 Financial Results July 31, 2014 Stuart Bradie President and Chief Executive Officer Brian Ferraioli EVP and Chief Financial Officer Zachary Nagle VP, Investor Relations
Q2 2014 Overview EPS loss of 0.06 improved sequentially, but clearly remains below expectations Operational performance of Gas Monetization and Hydrocarbons remains strong; IGP continues to lag, albeit backlog increase is…
Canadian Pipe Fabrication and Module Assembly Seven pipe fabrication/module assembly contracts, unique to our Canada business, that were signed in 2012 2013. Four projects largely completed Represented significant sales growth but…
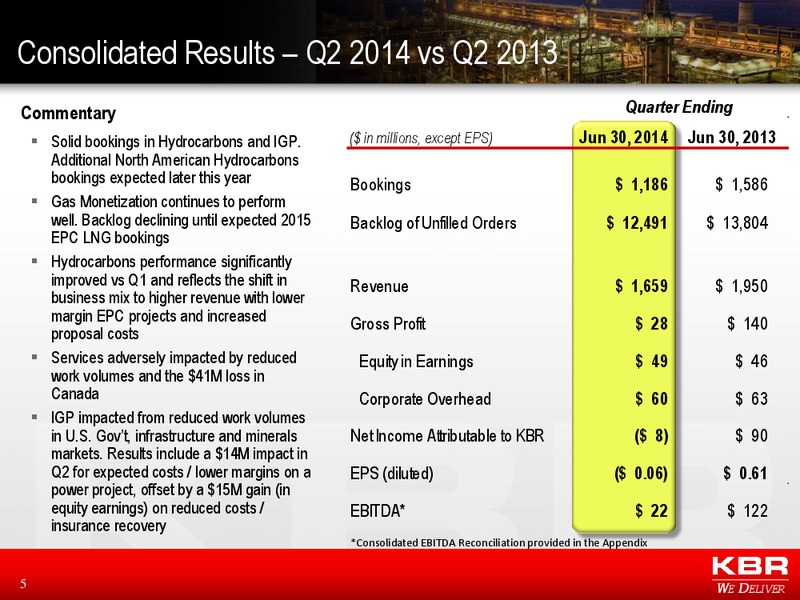
Consolidated Results Q2 2014 vs Q2 2013 Commentary Quarter Ending Solid bookings in Hydrocarbons and IGP. ( in millions, except EPS) Jun 30, 2014 Jun 30, 2013 Additional North American Hydrocarbons bookings expected later this year…
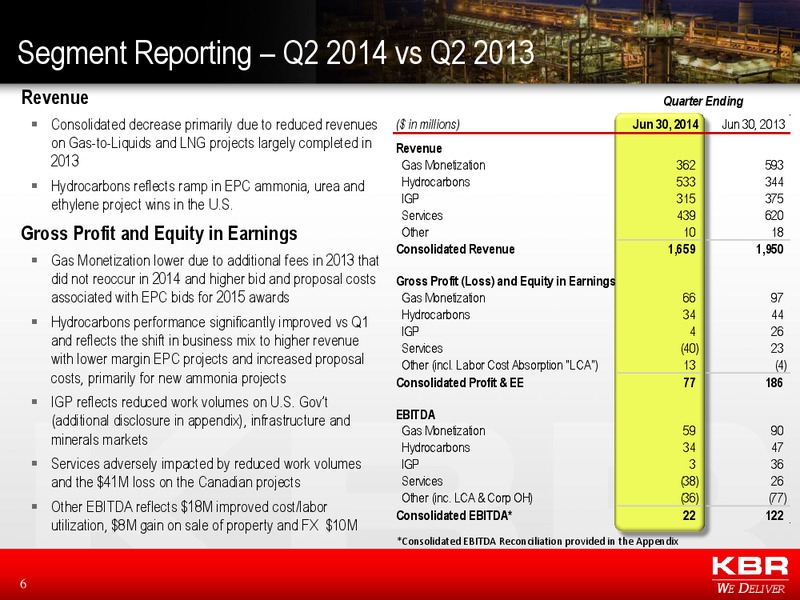
Segment Reporting Q2 2014 vs Q2 2013 Revenue Quarter Ending Consolidated decrease primarily due to reduced revenues ( in millions) Jun 30, 2014 Jun 30, 2013 on Gas-to-Liquids and LNG projects largely completed in Revenue 2013 Gas…
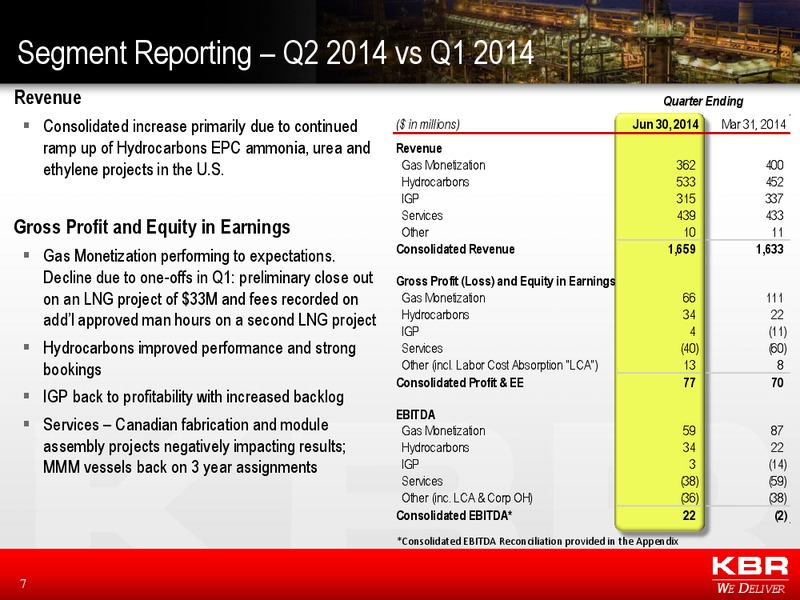
Segment Reporting Q2 2014 vs Q1 2014 Revenue Quarter Ending Consolidated increase primarily due to continued ( in millions) Jun 30, 2014 Mar 31, 2014 ramp up of Hydrocarbons EPC ammonia, urea and Revenue ethylene projects in the U.S.…
Cash / Capital Allocation KBR Cash Balance Return of Cash to Shareholders YTD Since Q2 '14 Q2 '13 Q2 '14 in millions in millions Jun-14 Jan-07 Domestic 272 201 Share Repurchases 40 96 721 International 622 458 Dividends 12 24 216…
Market Outlook: Gas Monetization Work continues on two mega LNG projects Initial work commenced on Shell Global LNG Agreement Continued strong pipeline of pre-front end engineering design, FEED, and EPC opportunities Recently awarded…
Market Outlook: Hydrocarbons Solid Q2 bookings led by: Maersk Culzean Offshore FEED Additional scope of services on existing downstream projects in Saudi Arabia Good start for Q3 bookings with recent award for Al-Nasr Executing three…
Market Outlook: IGP Strong operational performance continues for U.K. MoD Work - construction and long-term facilities maintenance; recently awarded Australian Defence Force Landing Helicopter Dock ships contract Continue to work on…
Market Outlook: Services Continued opportunities in North American Industrial Services and U.S. Construction as economy improves Mexican offshore Industrial Services business longer term contracts (i.e., 3 years) in place Well…
Summary 2014 remains a transition year and we have kicked off the Strategic Review Gas Monetization and Hydrocarbons continued strong performance, IGP improving and Services impacted by Canada Pursuing a number of large…
WE DELIVER Appendix 14 WE DELIVER
Consolidated EBITDA Reconciliation Q2 2014 Quarter Ending ( in millions) Jun 30, 2014 Jun 30, 2013 Net Income (Loss) Attributable to KBR (8) 90 Add Back: Interest Income (Expense) (2) (1) Provision for Tax (10) (15) Depreciation &…
IGP Results excluding: LOGCAP III and RIO completed contracts Quarter Ending ( in millions) Jun 30, 2014 Jun 30, 2013 LOGCAP III / RIO Contracts Revenue 0 21 Other Revenue 315 354 IGP Revenue 315 375 LOGCAP III / RIO Gross Profit…
KBRs Four Business Groups Gas Monetization Services Liquefied Natural Gas Module Construction and Fabrication Turn-Around Services Pipe Fabrication Startup Services Gas-to-Liquids Construction Industrial Services Hydrocarbons…
 Loading...