U.S. Refining Industry Strengths Why will the U.S. refining industry prosper for the next 5 years North American Secular growth in North American crude oil production Crude Favorable price dislocations between North American…
Summary Company Profile Toledo PBF owns three oil refineries located in Ohio, Delaware and New Jersey Aggregate throughput capacity of approximately 540,000 barrels per day Weighted average Nelson Complexity of 11.3 Paulsboro…
Increasing East Coast access to currently cost-advantaged North American crude oil PBFs onsite rail-infrastructure at Delaware City provides the opportunity to save approximately 3/bbl on delivered Bakken barrels versus using 3rd…
North American Crude Production U.S. crude production is estimated to grow by 55% (3 million bpd) 16.0 14.4 from 2010 through 2014 14.0 12.9 Pushes barrels South (via 12.2 12.0 4.9 water, pipeline and rail), East 3.9 10.0…
PBF Rail Deliveries of Light Crude to East Coast Light crude discharge capacity is over 100,000 bpd with a project to increase capacity to 120,000 130,000 bpd by Q3-2014 PBF is able to deliver Bakken barrels to Delaware City…
PBF Rail Deliveries of Canadian Heavy Crude to East Coast PBFs heavy crude unloading capacity is expected to double from approximately 40,000 bpd to approximately 80,000 bpd by Q3-2014 as PBF completes its ongoing rail expansion…
Widening Crude Differentials Crude differentials widened out during the fourth quarter of 2013 and PBF expects to realize the benefits of the wider differentials as crude purchased during the fourth quarter is processed at our…
Brent versus WTI Widening Brent WTI differential positively impacts cost-advantage of North American produced crude oils WTI - Brent 10.00 5.00 - (5.00) (10.00) /bbl (15.00) (20.00) (25.00) (30.00) (35.00)…
WCS versus Brent Expanding differentials positively impact rail economics for Canadian Heavy crude oil processed at PBFs East Coast refineries WCS - Brent 10.00 - (10.00) (20.00) /bbl (30.00) (40.00) (50.00)…
Bakken versus Brent Expanding differentials positively impact rail economics for Mid-continent light-sweet crude oil processed at PBFs East Coast refineries Bakken - Brent - (5.00) (10.00) (15.00) (20.00) /bbl…
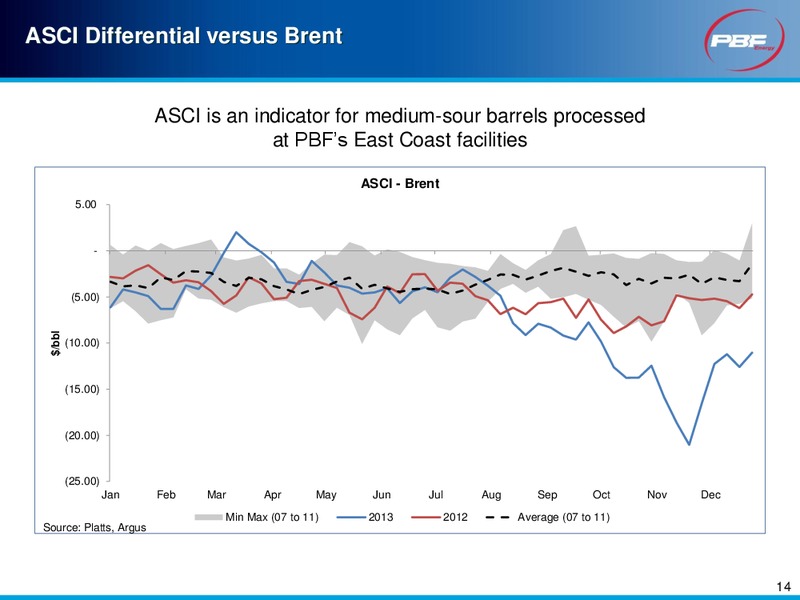
ASCI Differential versus Brent ASCI is an indicator for medium-sour barrels processed at PBFs East Coast facilities ASCI - Brent 5.00 - (5.00) /bbl (10.00) (15.00) (20.00) (25.00) Jan Feb Mar Apr May Jun…
PBFs Key Mid-continent differential versus WTI Toledo processes approximately 35% to 40% Syncrude Syncrude - WTI 20.00 15.00 10.00 5.00 - /bbl (5.00) (10.00) (15.00) (20.00) (25.00) Jan Feb Mar Apr May Jun…
PBFs East Coast Benchmark Crack NYH 2:1:1 = ((2*Dated Brent) + (1*NY RBOB) + (1*NO.2 Heating Oil))/2 NYH 2:1:1 30.00 25.00 20.00 /bbl 15.00 10.00 5.00 - Jan Feb Mar Apr May Jun Jul Aug Sep Oct Nov Dec…
PBFs Mid-continent Benchmark Crack Chicago 4:3:1 = ((4*WTI) + (3*Chic CBOB pipe) + (0.5*Chic ULSD Pipe) + (0.5*USGC Jet Kero 54))/4 Chicago 4:3:1 55.00 45.00 35.00 /bbl 25.00 15.00 5.00 (5.00) Jan Feb Mar…
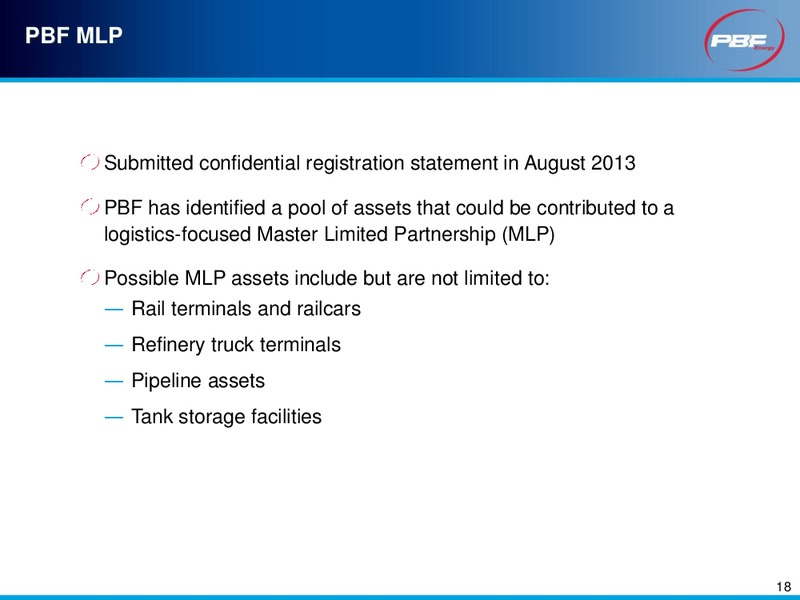
PBF MLP Submitted confidential registration statement in August 2013 PBF has identified a pool of assets that could be contributed to a logistics-focused Master Limited Partnership (MLP) Possible MLP assets include but are not…
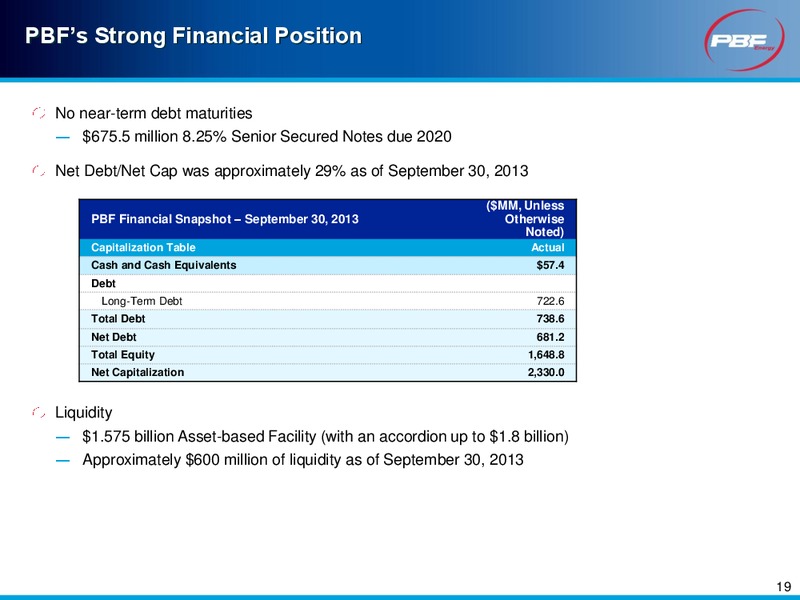
PBFs Strong Financial Position No near-term debt maturities 675.5 million 8.25% Senior Secured Notes due 2020 Net Debt/Net Cap was approximately 29% as of September 30, 2013 (MM, Unless PBF Financial Snapshot September 30, 2013…
PBFs Fourth Quarter 2013 Cash Highlights All figures displayed below are estimates, unaudited, subject to change, are provided for information purposes only and are not indicative of the actual earnings of the company for the…
2014 Full Year Guidance Guidance provided constitutes forward-looking information and is based on current PBF Energy operating plans, company assumptions and company configuration. All figures are subject to change based on market…
 Loading...