Liquids Pipelines Guy Jarvis President, Liquids Pipelines E n b r i dg e Da y 2 0 1 4
Key Messages Fundamentals continue to drive growth Focused on project integration and asset optimization Excellent progress on market access strategy Extensive cost effective expansion opportunities E n b r i dg e Da y 2 0 1 4
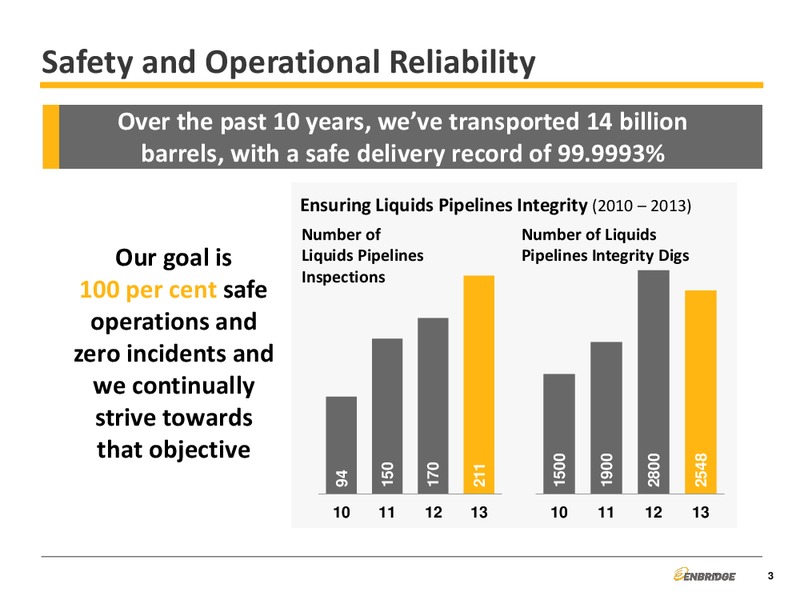
Safety and Operational Reliability Over the past 10 years, weve transported 14 billion barrels, with a safe delivery record of 99.9993% Ensuring Liquids Pipelines Integrity (2010 2013) Number of Number of Liquids Our goal is Liquids…
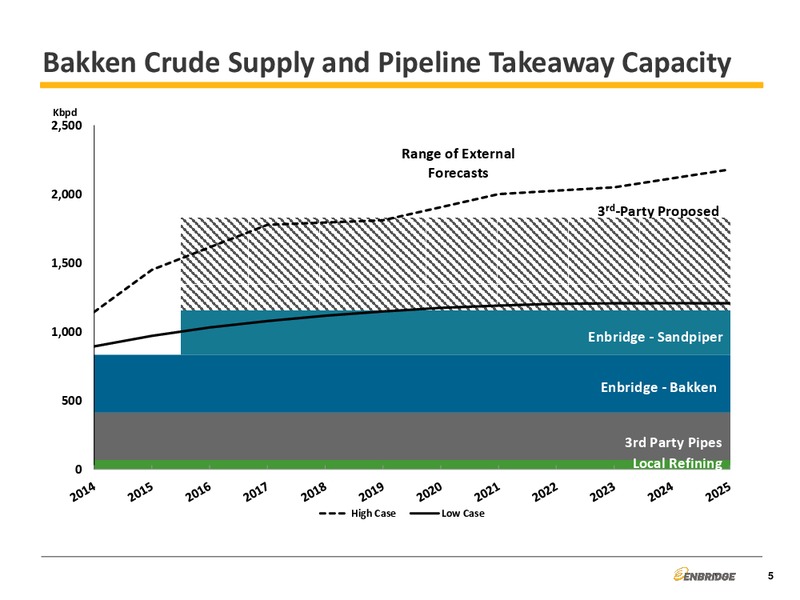
Bakken Crude Supply and Pipeline Takeaway Capacity Kbpd 2,500 Range of External Forecasts 2,000 3rd-Party Proposed 1,500 1,000 Enbridge - Sandpiper Enbridge - Bakken 500 3rd Party Pipes 0 Local Refining High Case Low…
North American Pricing Differentials Peak Differentials 1 Year ended September 19, 2014 WCS - Maya (34.41) WCS Pacific (54.03) Alberta Light WTI (21.17) Alberta Light - Brent (33.57) Light Crude Heavy Crude Pricing Based…
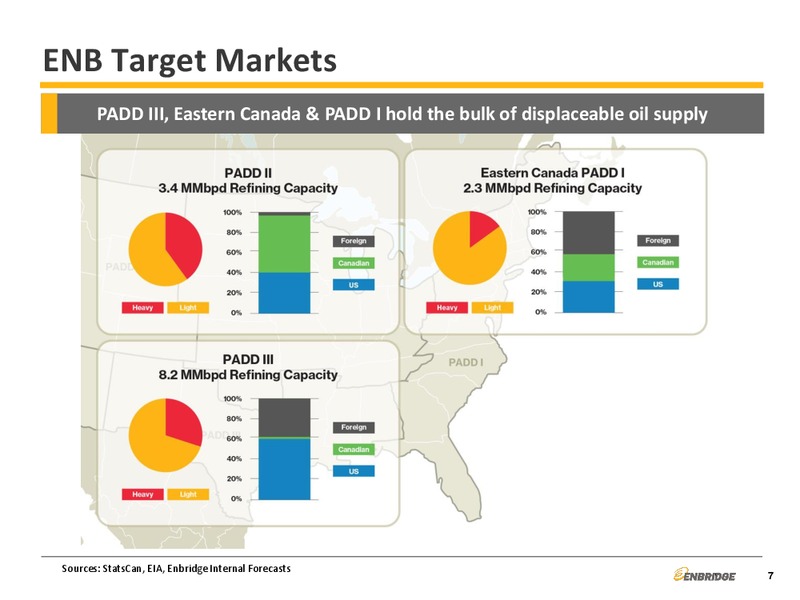
ENB Target Markets PADD III, Eastern Canada & PADD I hold the bulk of displaceable oil supply Sources: StatsCan, EIA, Enbridge Internal Forecasts 7
US Condensate Supplies WCSB Demand WCSB Condensate Requirement MMbpd 1.2 1.0 Canadian diluent demand 0.8 growth remains strong as 0.6 production continues to 0.4 increase 0.2 0.0 Local & Recycled Condensate (C5+) Imported…
Net Available Supply to Enbridge 3,500 3,000 Throughput ex-Gretna (kbpd) 2,500 2,000 1,500 1,000 500 0 2015 2016 2017 2018 2019 2020 2021 Net available supply to Enbridge assumes Keystone XL, Energy East and one West…
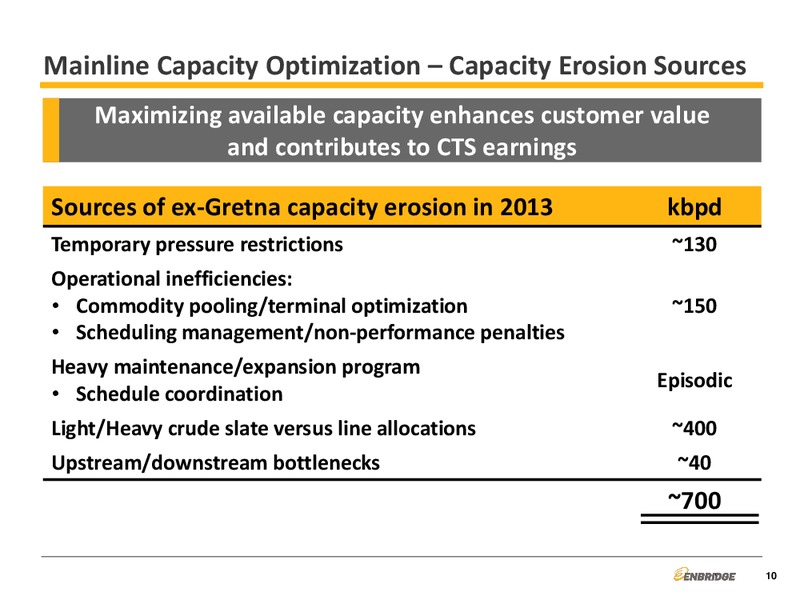
Mainline Capacity Optimization Capacity Erosion Sources Maximizing available capacity enhances customer value and contributes to CTS earnings Sources of ex-Gretna capacity erosion in 2013 kbpd Temporary pressure restrictions 130…
Mainline Capacity Optimization Current Status/Outlook Optimization efforts are closing the gap between available capacity and design hydraulic capacity Current Design Capacity*: 2,500 kbpd 2,500 +70 +120 2,300* +130 2,100 +150…
Mainline Capacity Optimization Temporary System Optimization Temporary actions are in place to squeeze out additional available capacity Drag reducing agent 45 kbpd Temporary crude slate reallocation 40 kbpd Interline flexibility…
Edmonton to Hardisty Total Secured Capital = 36 180 km Pipeline 1.8 B - Edmonton to Hardisty - 800 kbpd capacity Edmonton South Terminal - Terminal facilities - 3 transfer laterals - 5 550 kbbl tanks In Service - 2015 13
Line 3 Replacement Increases system reliability and flexibility Total Secured Capital = 7.5 B ENB Funded EEP/ENB Joint Funded 14
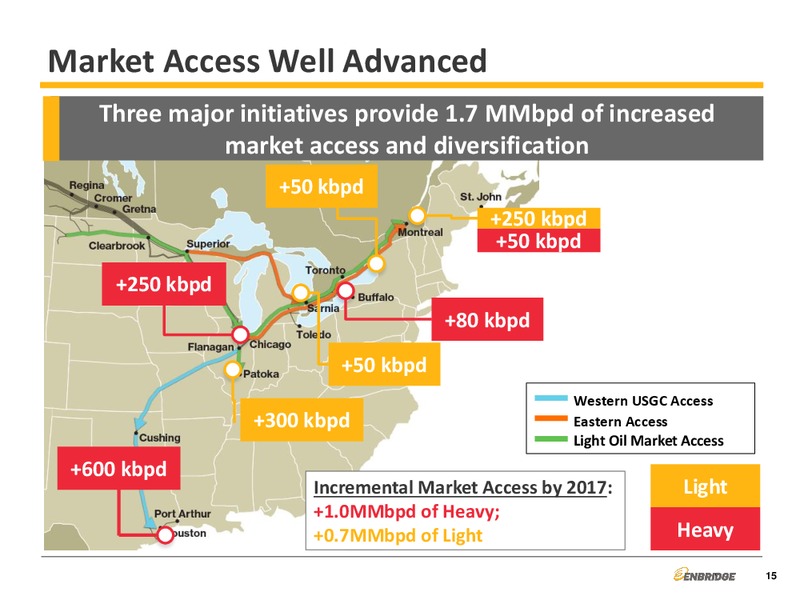
Market Access Well Advanced Three major initiatives provide 1.7 MMbpd of increased market access and diversification +50 kbpd +250 kbpd +50 kbpd +250 kbpd +80 kbpd +50 kbpd Western USGC Access +300 kbpd Eastern Access Light…
Market Access Western USGC Access Enbridges Western USGC Access is the linchpin for Canadian liquids development Total Secured Capital = 5.4 B Western USGC Access Projects Timing 1. Mainline Expansions - Alberta Clipper…
Market Access Eastern Access Enhances security of supply and refinery competitiveness Eastern Access Projects Timing 1. Line 5 Expansion Completed 2. Spearhead North Completed Expansion 3. Line 6B Replacement Completed 4. Line 9A…
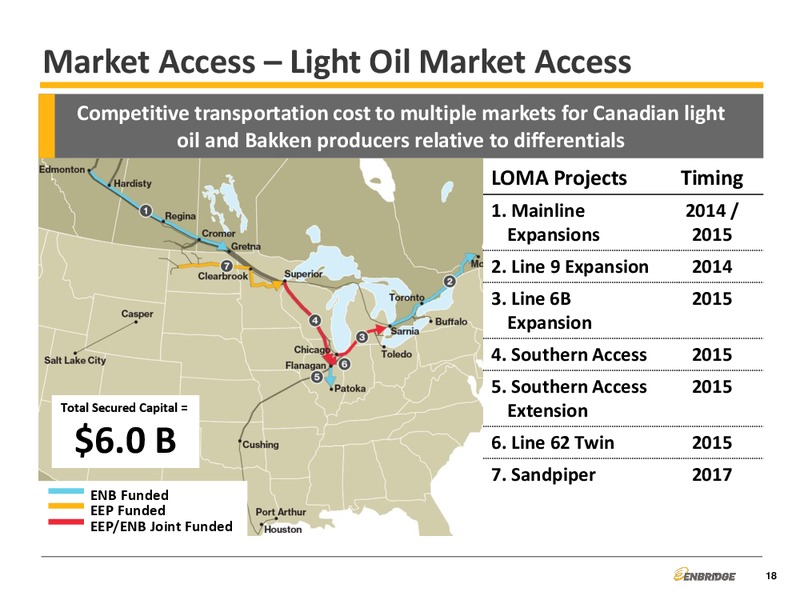
Market Access Light Oil Market Access Competitive transportation cost to multiple markets for Canadian light oil and Bakken producers relative to differentials LOMA Projects Timing 1. Mainline 2014 / Expansions 2015 2. Line 9…
Largest Oil Sands Service Provider Total Secured Capital = Regional Oil Sands Projects Timing 6.0 B 1. Athabasca Twin 2017 2. AOC Hangingstone 2015 Lateral 3. Surmont Cheecham 2016 Facilities 4. Woodland Pipeline 2015 Extension…
Primary Transportation Choice for Bakken Producers Total Secured Capital = Sandpiper provides access to premium 2.6 B eastern PADD II market Marathon is anchor shipper Sandpiper is expandable by 160 kbpd through horsepower…
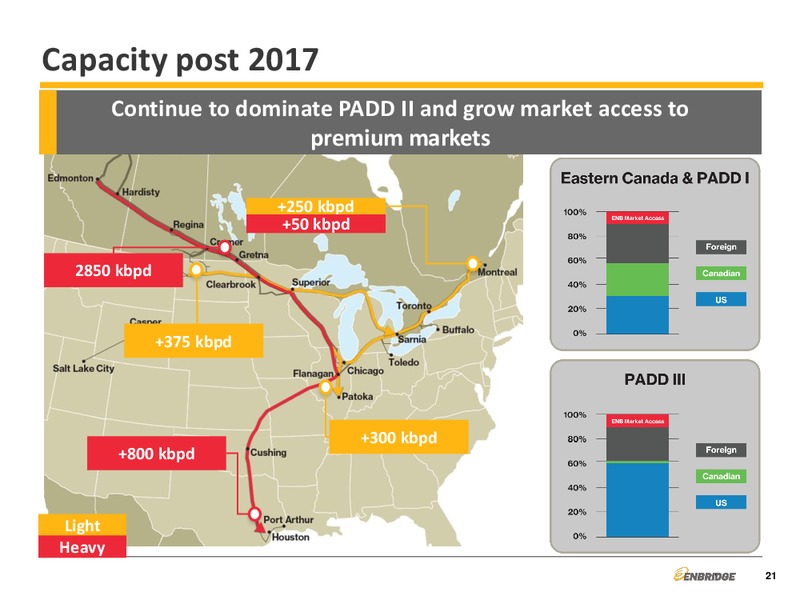
Capacity post 2017 Continue to dominate PADD II and grow market access to premium markets +250 kbpd +50 kbpd 2850 kbpd +375 kbpd +300 kbpd +800 kbpd Light Heavy 21
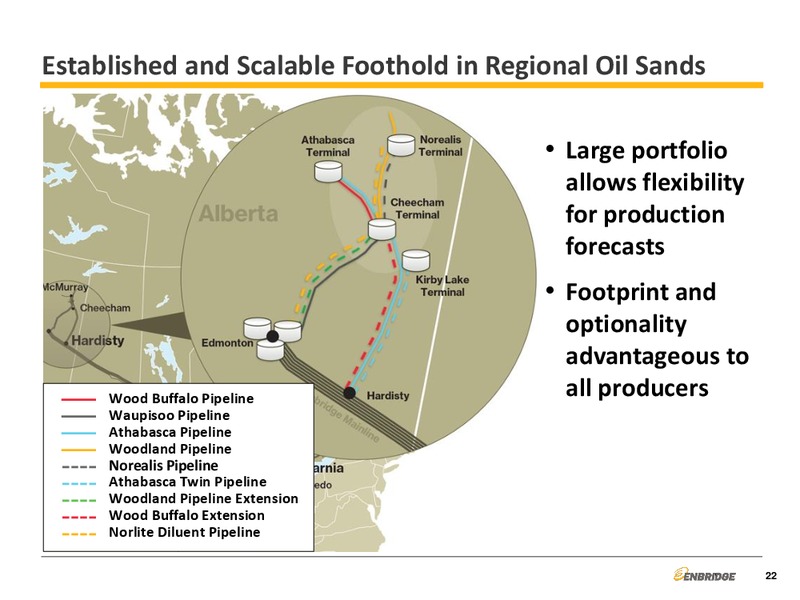
Established and Scalable Foothold in Regional Oil Sands Large portfolio allows flexibility for production forecasts Footprint and optionality advantageous to Wood Buffalo Pipeline all producers Waupisoo Pipeline Athabasca…
Continued Growth Potential Mainline expansions facilitated by scalable market access options Crude Asset Expansion Opportunities 1. Flanagan South (+200 kbpd Heavy) 2. SAX Expansion (+150 kbpd Light) 3. Line 9 Expansion (+70 kbpd…
Key Takeaways Execution and integration of secured growth progressing System optimization efforts contribute to earnings Unparallelled asset base and strong fundamentals will extend growth Enbridge is providing capacity and…
Q&A Guy Jarvis President, Liquids Pipelines E n b r i dg e Da y 2 0 1 4
 Loading...