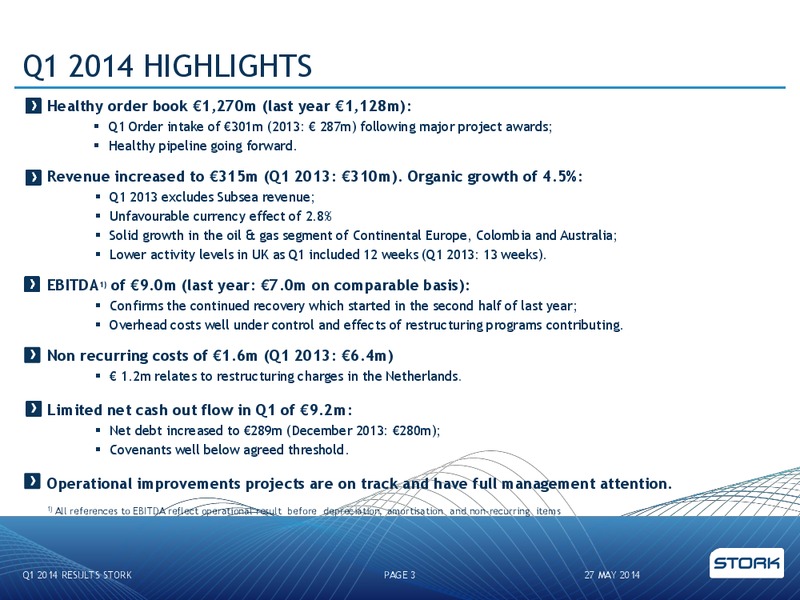
Q1 2014 HIGHLIGHTS Healthy order book 1,270m (last year 1,128m): Q1 Order intake of 301m (2013: 287m) following major project awards; Healthy pipeline going forward. Revenue increased to 315m (Q1 2013: 310m). Organic growth of 4.5%:…
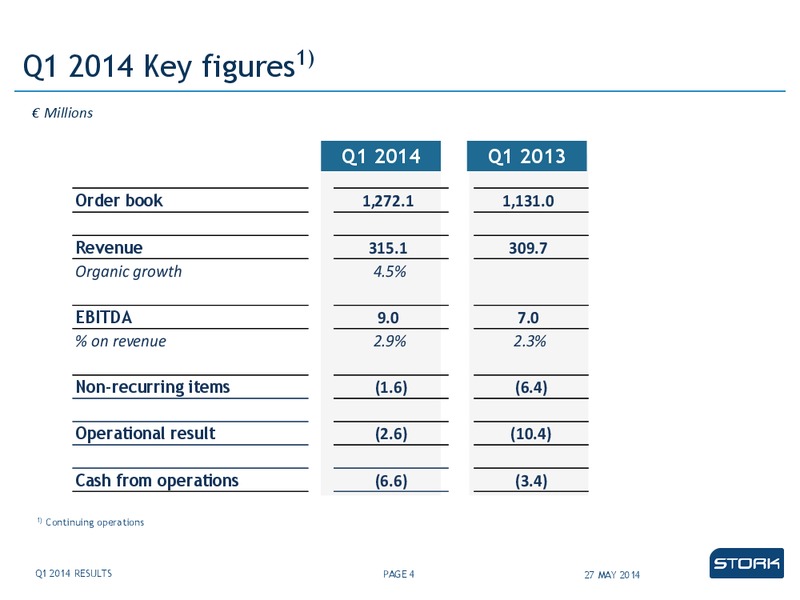
Q1 2014 Key figures1) Millions Q1 2014 Q1 2013 Order book 1,272.1 1,131.0 Revenue 315.1 309.7 Organic growth 4.5% EBITDA 9.0 7.0 % on revenue 2.9% 2.3% Non-recurring items (1.6) (6.4) Operational result (2.6) (10.4) Cash…
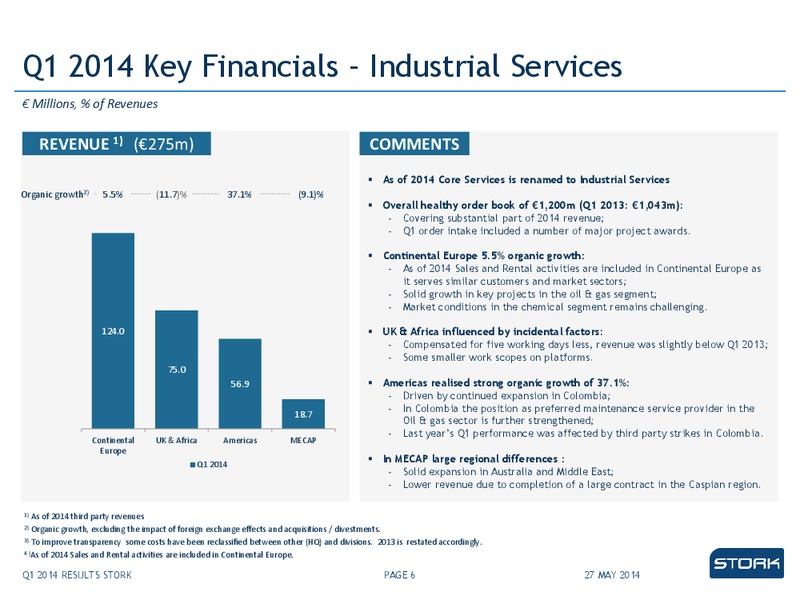
Q1 2014 Key Financials Industrial Services Millions, % of Revenues REVENUE 1) (275m) COMMENTS As of 2014 Core Services is renamed to Industrial Services Organic growth2) 5.5% (11.7)% 37.1% (9.1)% Overall healthy order book of 1,200m…
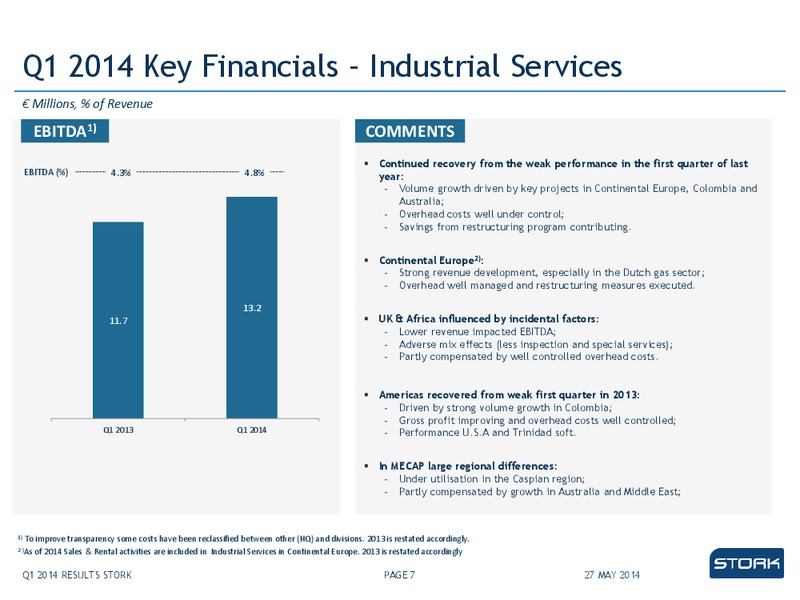
Q1 2014 Key Financials Industrial Services Millions, % of Revenue EBITDA1) COMMENTS Continued recovery from the weak performance in the first quarter of last EBITDA (%) 4.3% 4.8% year: - Volume growth driven by key projects in…
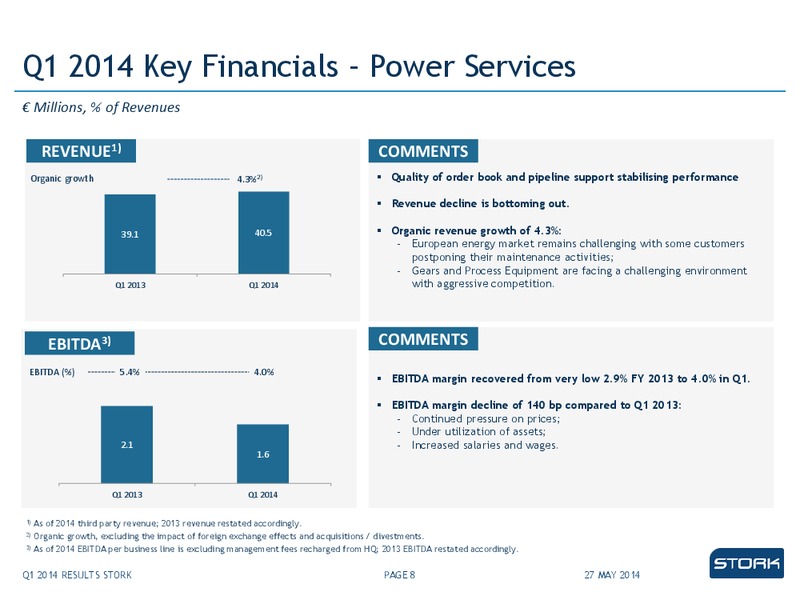
Q1 2014 Key Financials Power Services Millions, % of Revenues REVENUE1) COMMENTS Organic growth 4.3%2) Quality of order book and pipeline support stabilising performance Revenue decline is bottoming out. 39.1 40.5 Organic revenue…
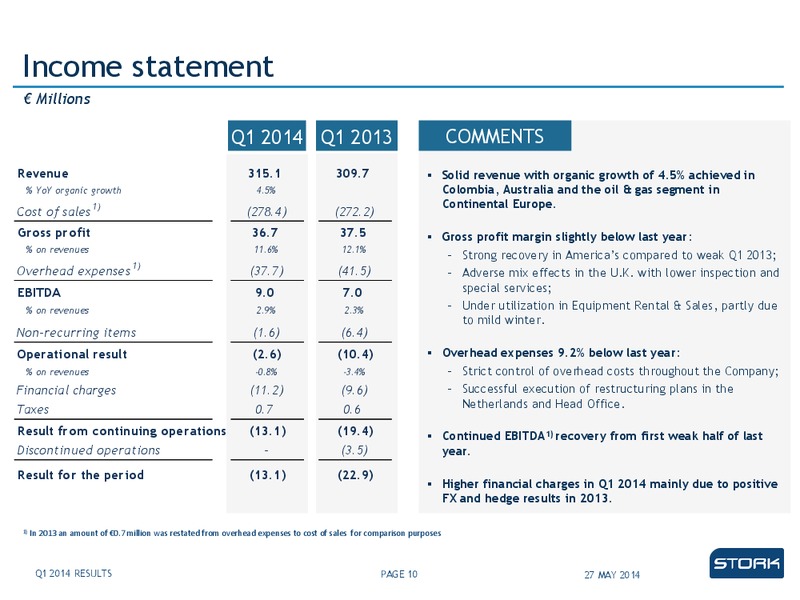
Income statement Millions Q1 2014 Q1 2013 COMMENTS Revenue 315.1 309.7 Solid revenue with organic growth of 4.5% achieved in % YoY organic growth 4.5% Colombia, Australia and the oil & gas segment in 1) Continental Europe. Cost of…
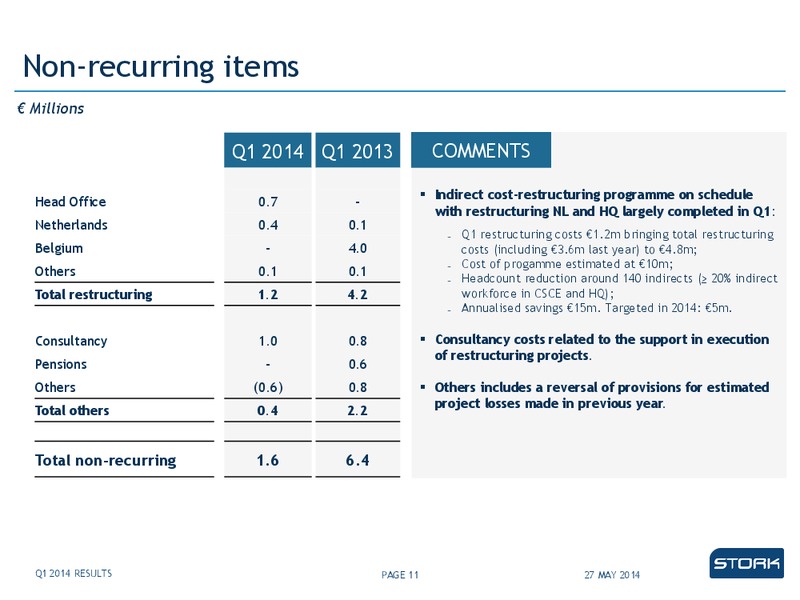
Non-recurring items Millions Q1 2014 Q1 2013 COMMENTS Indirect cost-restructuring programme on schedule Head Office 0.7 - with restructuring NL and HQ largely completed in Q1: Netherlands 0.4 0.1 Q1 restructuring costs 1.2m…
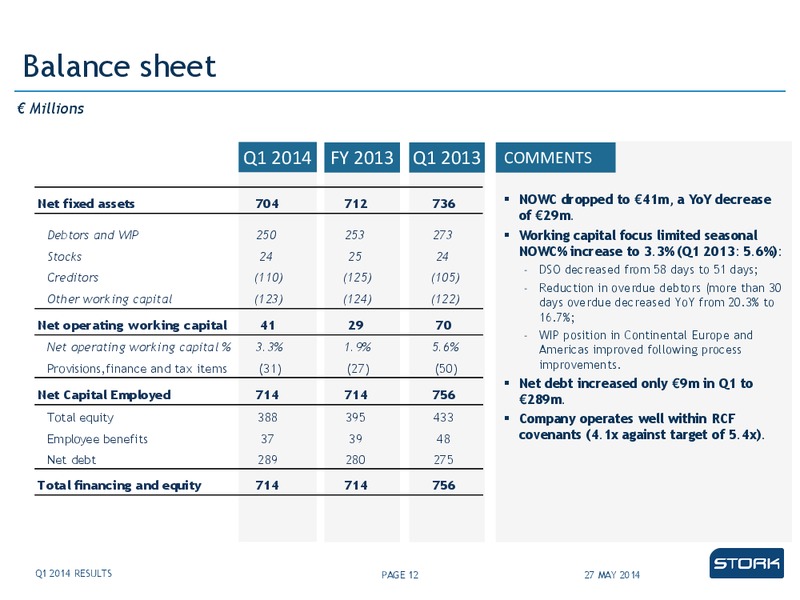
Balance sheet Millions Q1 2014 FY 2013 Q1 2013 COMMENTS Net fixed assets 704 712 736 NOWC dropped to 41m, a YoY decrease of 29m. Debtors and WIP 250 253 273 Working capital focus limited seasonal Stocks 24 25 24 NOWC% increase to…
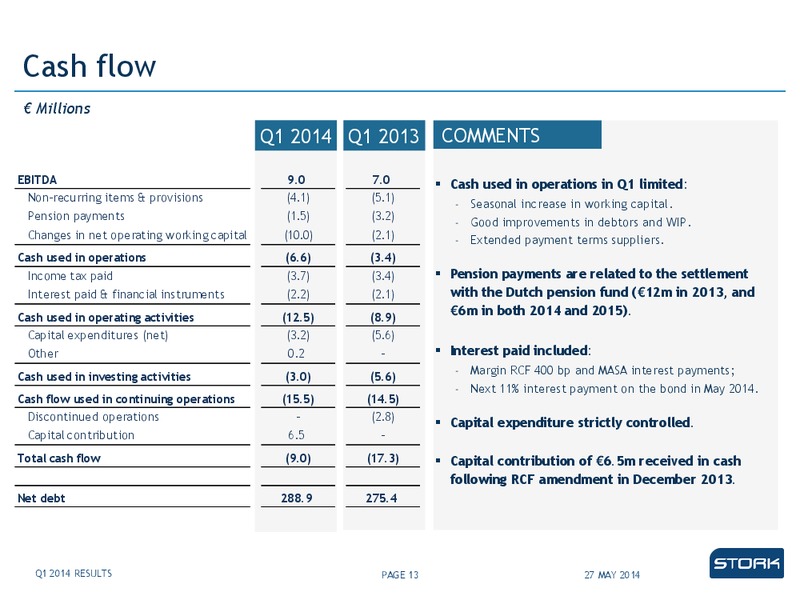
Cash flow Millions Q1 2014 Q1 2013 COMMENTS EBITDA 9.0 7.0 Cash used in operations in Q1 limited: Non-recurring items & provisions (4.1) (5.1) Seasonal increase in working capital. Pension payments (1.5) (3.2) Good improvements in…
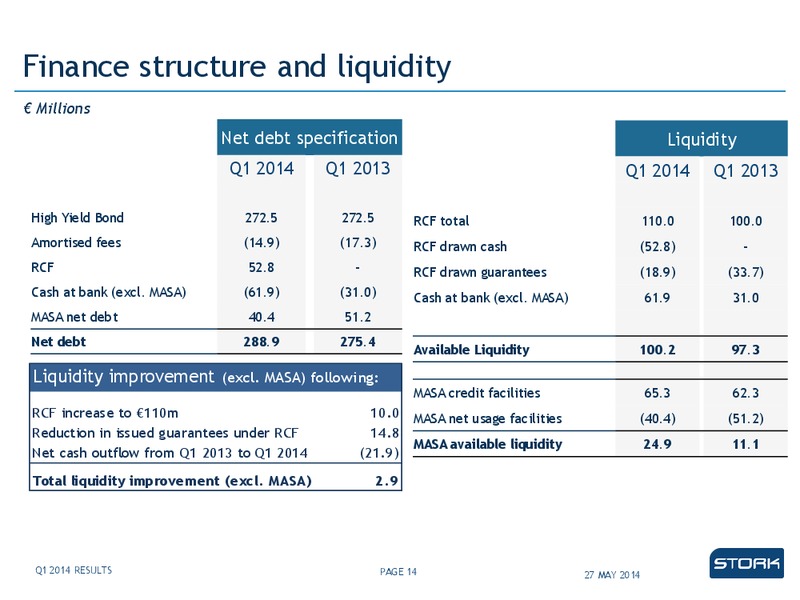
Finance structure and liquidity Millions Net debt specification Liquidity Q1 2014 Q1 2013 Q1 2014 Q1 2013 High Yield Bond 272.5 272.5 RCF total 110.0 100.0 Amortised fees (14.9) (17.3) RCF drawn cash (52.8) - RCF 52.8 - RCF drawn…
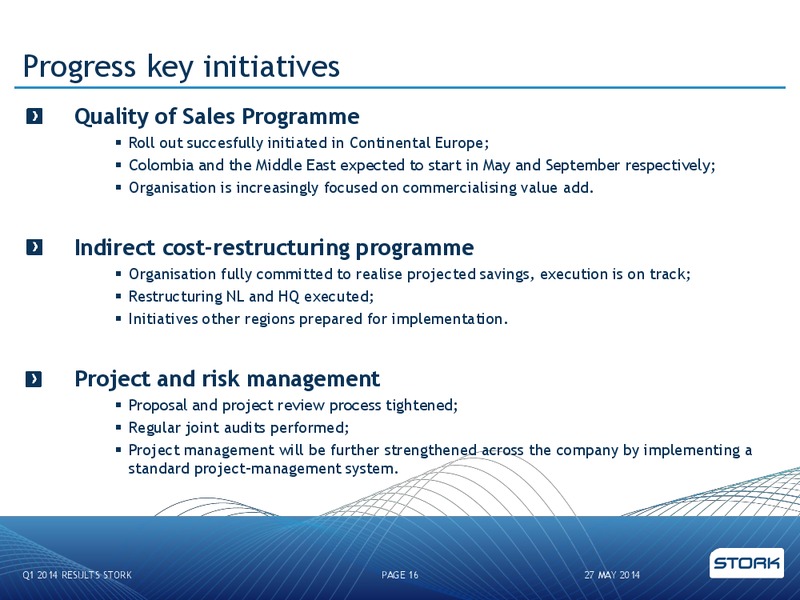
Progress key initiatives Quality of Sales Programme Roll out succesfully initiated in Continental Europe; Colombia and the Middle East expected to start in May and September respectively; Organisation is increasingly focused on…
Q1 2014 SUMMARY Healthy order book 1,270m (last year 1,128m) and promising pipe line going forward. Organic revenue growth of 4.5%. EBITDA of 9.0m confirms continued recovery which started in the second half of last year. Cash…
Q&A Q1 2014 RESULTS STORK PAGE 18 27 MAY 2014
DISCLAIMER This presentation has been prepared by Stork solely for informational purposes. Stork has included non-IFRS financial measures in this presentation. These measurements may not be comparable to those of other companies.…
 Loading...