STORK AT A GLANCE 2013 Continental Revenue by segment HY 2014 CONTINENTAL europe UKEUROPE & revenue UK & revenue Africa 562m AFRICA 562M revenue revenue 401M 18% 401M (FY 13: 18%) 8% (FY 13: 9%) AMERICAS 65% revenue…
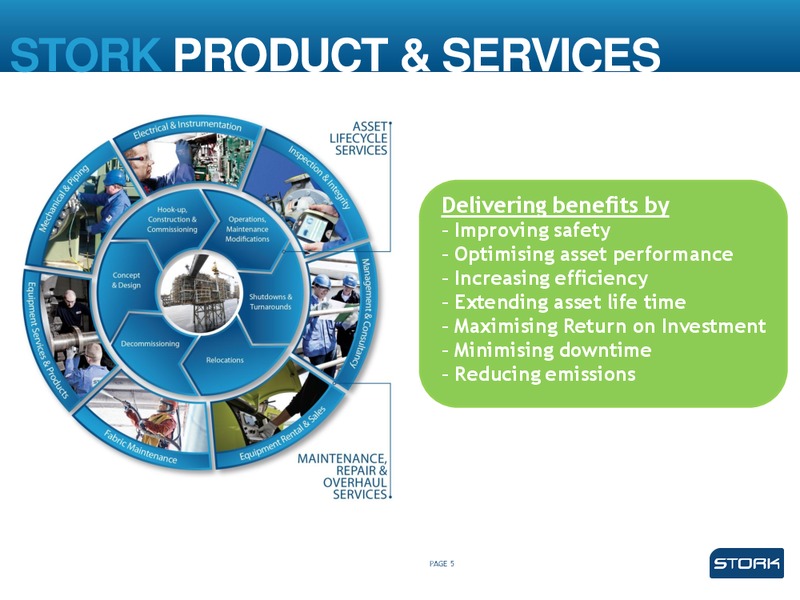
STORK PRODUCT & SERVICES Delivering benefits by Improving safety Optimising asset performance Increasing efficiency Extending asset life time Maximising Return on Investment Minimising downtime Reducing emissions PAGE 5
RECENT PROJECTS CONTINENTAL EUROPE: Stork and its JV partners Jacobs and AMEC, have secured an Integrated Services Contract (ISC) for the assets known as Shell ONEgas Southern North Sea. This major contract includes all 54 Southern…
RECENT PROJECTS AMERICAS: Stork recently started work on a five-year contract with Equin Energa, a joint venture between Ecopetrol and Talisman, which produces 100,000 barrels of oil and 10 million m3 of gas per day. The work scope…
STORKS VALUE ADD AT EVERY STAGE OF THE ASSET LIFECYCLE PAGE 9
LONG TERM KEY MARKET DRIVERS OIL & GAS CHEMICAL POWER Increased outsourcing Growth of installed base Ageing assets conventional occurs as markets mature (concentrated in Latin fuel sources (Europe and (Asia Pacific, Africa and…
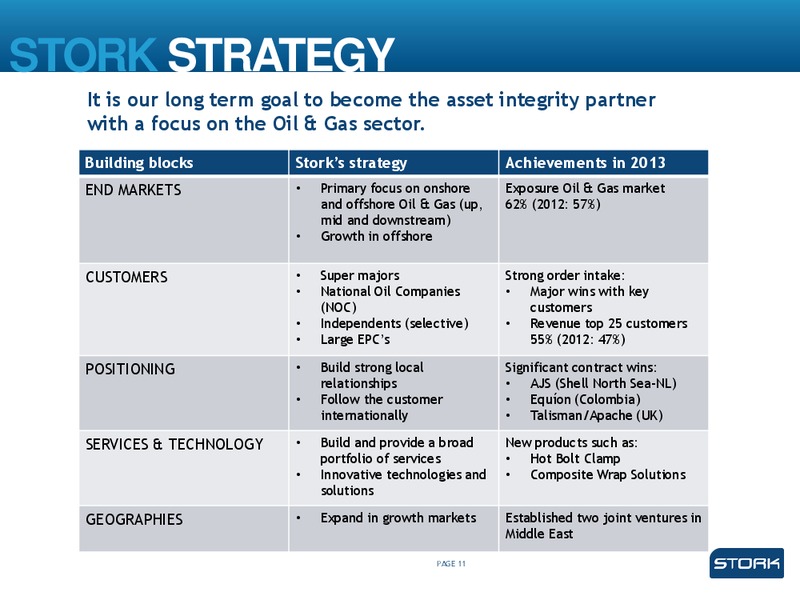
STORK STRATEGY It is our long term goal to become the asset integrity partner with a focus on the Oil & Gas sector. Building blocks Storks strategy Achievements in 2013 END MARKETS Primary focus on onshore Exposure Oil & Gas market…
HY 2014 HIGHLIGHTS Healthy order book 1,280m (last year 1,130m) and promising pipeline going forward: Major long term maintenance contracts and plant modification projects in the global Oil & Gas sector. Revenue increased 2.2% to 685m…
HY 2014 KEY FINANCIALS INDUSTRIAL SERVICES Millions, % of Revenues REVENUE1) COMMENTS Total revenues of 602.9 million, an increase of 2.9% compared to HY 2013 and Organic growth (%) 2) organic revenue growth of 4.9%. 2.6% (6.0)%…
HY 2014 KEY FINANCIALS POWER SERVICES Millions, % of Revenues REVENUE1) COMMENTS Organic growth (%) 2) Quality of order book and pipeline support stabilising (2.1)% performance. Revenue decline is bottoming out. Organic revenue…
HY 2014 INCOME STATEMENT Millions HY 2014 HY 2013 COMMENTS ORDER BOOK 1,280.0 1,130.0 Healthy order book and promising pipeline going forward. Solid revenue with organic growth of 4.0% achieved in the REVENUE 685.0 670.3 Oil & Gas…
HY 2014 BALANCE SHEET Millions HY 2014 FY 2013 HY 2013 COMMENTS NET FIXED ASSETS 709 712 727 NOWC increased to 82m, a YoY increase of 10m. Debtors and WiP 275 253 287 NOWC as % of revenue increased to 5.5% (HY 2013: 4.8%): Stocks…
HY 2014 CASH FLOW Millions HY 2014 HY 2013 COMMENTS EBITDA 34.8 27.4 Cash flow from operations in the first half of (23.9)m: Non-recurring items & provisions (6.6) (17.3) Seasonal increase in working capital; Pension payments (3.1)…
HY 2014 FINANCE STRUCTURE AND LIQUIDITY Millions NET DEBT SPECIFICATION LIQUIDITY HY 2014 HY 2013 HY 2014 HY 2013 High Yield Bond 272.5 272.5 Revolving Credit Facility 110.0 110.0 (RCF) Amortised fees (14.0) (16.9) RCF drawn cash…
2014 A YEAR OF OPERATIONAL IMPROVEMENTS Initiated projects are on track and contribute to significant improvement of operating result: Project and risk management Proposal and project review process tightened; Upgraded version…
HY 2014 SUMMARY Strong focus on project risk and execution. Operational improvement projects are on track and contribute to significant improvement of operating result. Solid recovery of results in HY 2014. PAGE 24
 Loading...