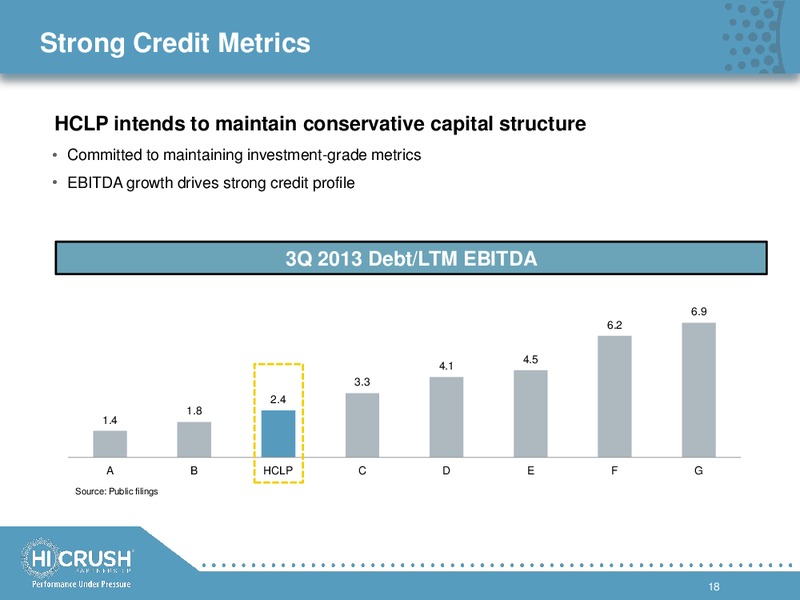
Welcome to Hi-Crush Traditional MLP that Leverages Strong Industry Fundamentals to Create Growth and Value Industry Leading Contracted Model Growth Platform Strategic Asset Portfolio Key Investment Substantial Growth…
Hi-Crush Management Team Co-founder of Hi-Crush, served as Co-CEO since Robert Rasmus formation Founding member, managing director of Red Oak Co-Chief Executive Officer Capital Management 34 years of experience Co-founder of…
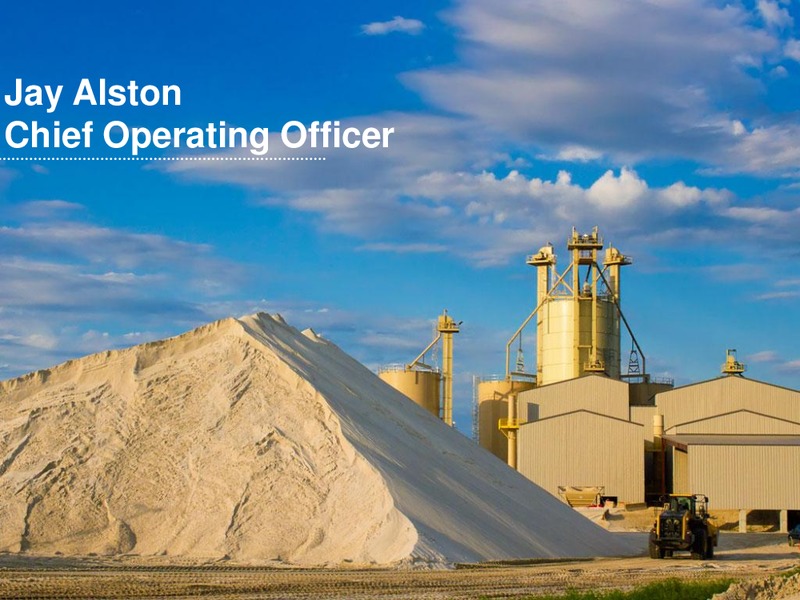
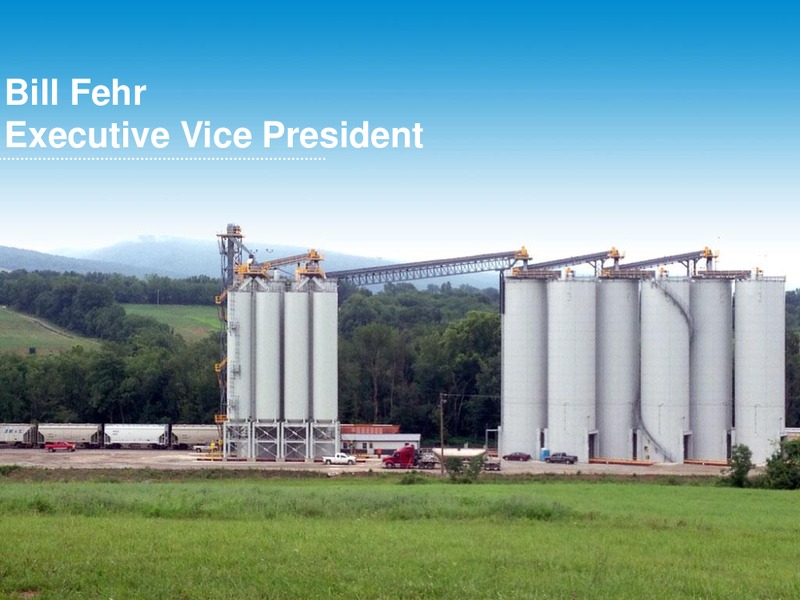
Hi-Crush Management Team (continued) Jay Alston COO of Hi-Crush since May 2011 Designed frac sand facilities for Trinity Consulting Chief Operating Officer 14 years of experience Bill Fehr EVP of Hi-Crush since May 2013 D&I…
2013 A Year of Progress First dropdown from Augusta Hi-Crush acquires D&I for 133 million The Successfully settles Baker Hughes lawsuit with new 6-year agreement Transactions Doubles size, diversifies revenue and customer platform,…
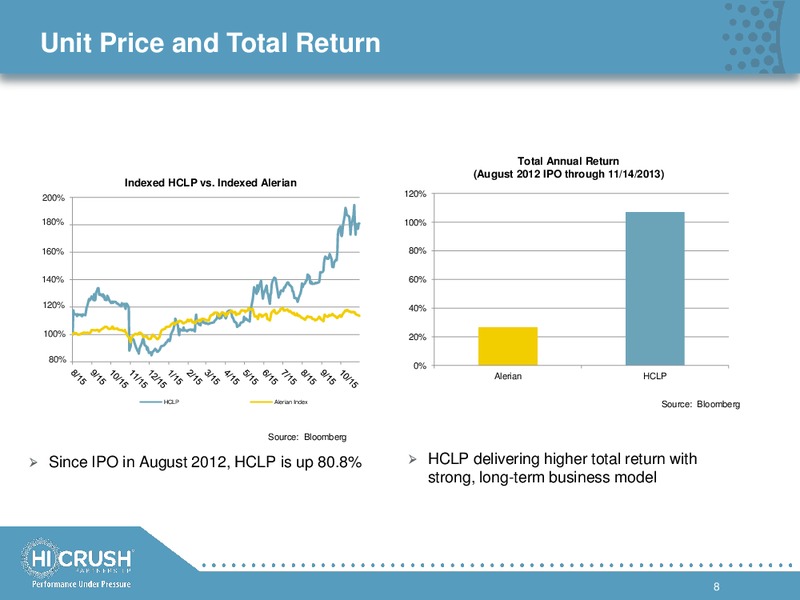
Unit Price and Total Return Total Annual Return (August 2012 IPO through 11/14/2013) Indexed HCLP vs. Indexed Alerian 200 200% 120% 180% 180 100% 160% 160 80% 140% 140 60% 120% 120 40% 100% 100 20% 80% 80 0%…
The Industry OPPORTUNITIES CHALLENGES Demand Competition Diversification Operations Consolidation Labor 9
What that Means for HCLP We are ready Executing on new services platform Built a unified Hi-Crush team with over 200 employees Establishing new sales center in Marcellus to support area operations Integrated company-wide…
What We See Proppant Consumed by Volume 90 80 78.5 80 68 70 58 60 Millions of Tons 51.2 48 50 40 40 29.6 30 62.6 20 41.0 7.0 23.5 10 1.8 5.6 0 2002 2007 2012 2017 2022 Raw frac sand Resin-coated sand…
Opportunities Increasing lateral lengths, increasing number of frac stages, increasing Demand proppant use per stage Enhanced exposure to new customers Diversification Continue to diversify service offerings Fractured markets…
Laura Fulton Chief Financial Officer
Financial Snapshot Financial Results Operating Metrics 3Q 2013 YoY Var %* 3Q 2013 YoY Var %* Revenues 43,515 72.4 Sand produced and delivered from 400,814 5.9 Wyeville (tons) General & Administrative 5,030 141.1 5,250 3.3…
HCLP Transformation HCLP 2012 HCLP 2013 100M Assets 300M 95 Employees 200+ 1.2M Sand Sold (tons) 1.8M+ 4 Customers 25+ 0 Destination Terminals 12 Top tier producer of Leader in sand supply premium white sand and…
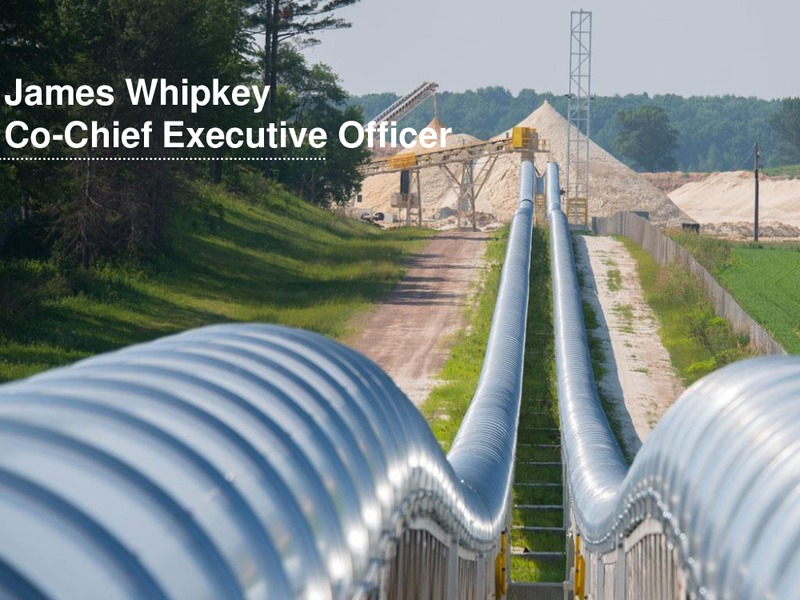
James Whipkey Co-Chief Executive Officer
Where We Came From Major Oilfield Service Companies 21
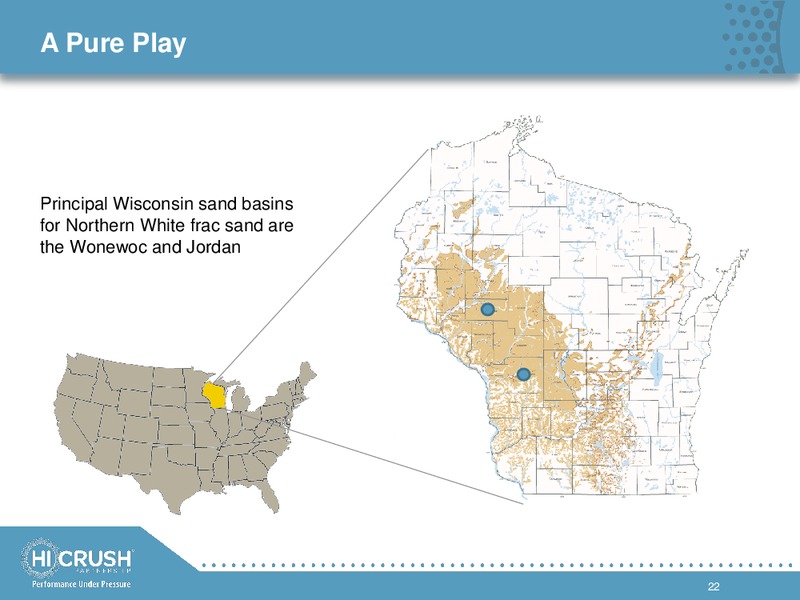
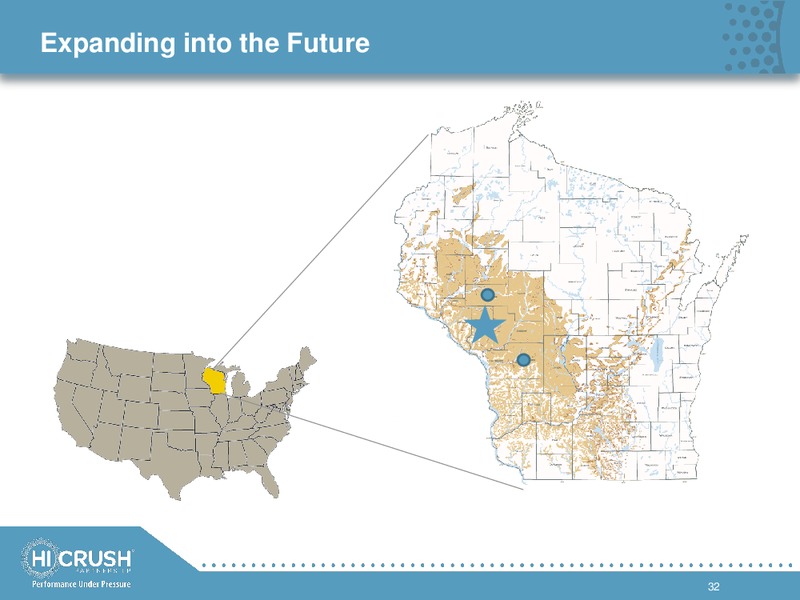
A Pure Play Principal Wisconsin sand basins for Northern White frac sand are the Wonewoc and Jordan 22
Hi-Crushs Competitive Advantage Low-Cost Producer High Quality Reserves Prime Portfolio of Assets Focused Vision Visible Avenues to Growth Focused On: Value Growth Returns Acceleration 23
Growth in All Regions Marcellus Production (Mmcfe/d) Eagle Ford Production (Mboe/d) Source: HPDI, Morgan Stanley Research Source: HPDI, Morgan Stanley Research NE Marcellus Horizontal Well Watch (Starting 2011) Utica Acreage…
Three Months of Hydraulic Fracturing in the U.S. Source: FracFocus.org; rolling 3 month data 25
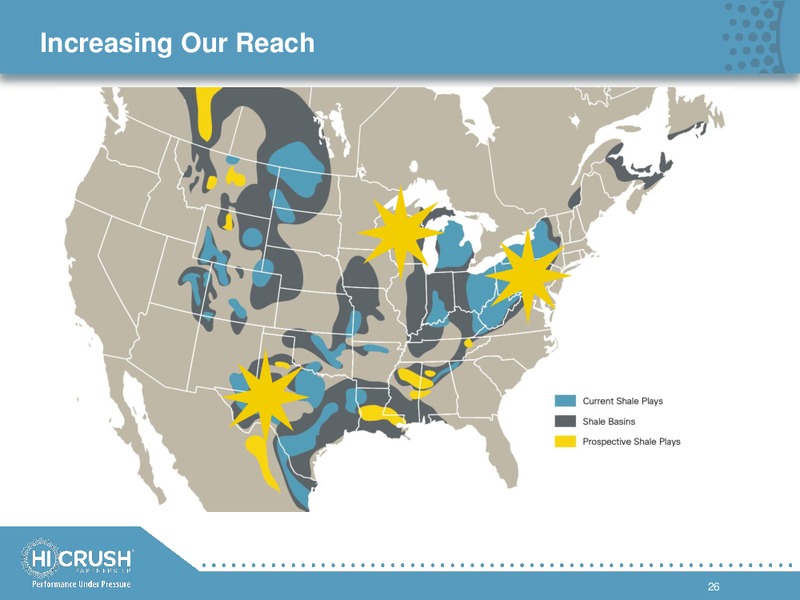
Increasing Our Reach 26
Multiple Future Opportunities M&A Industry ripe for consolidation of small, private sand companies Organic Expansion Sponsor owns or has options on additional acres of undeveloped land Contributions Future contributions…
Defining Our Goals M&A Industry ripe for consolidation of small, private sand companies Organic Expansion Three new distribution facilities and Whitehall production Contributions Contribution from Augusta expected in…
History of D&I 2011 2007 Targeted early 2013 Marcellus starts to gain notice expansion into Utica D&I becomes part of destination terminals Hi-Crush 2006 2010 2012 Founded D&I Activity in Marcellus Data from Utica wells shale…
Unmatched Footprint 3Q13 over 200 thousand tons sold 12 distribution 1,144 owned and terminals leased rail cars Super systems in Existing footprint high growth areas enables growth of Marcellus and Utica Announced Growth…
Focus on the Utica 36
Quality Sand, Quality Customers Significant storage in silos Consistent testing of sand quality Tight control of sand handling Flat storage is flat wrong 37
Smithfield Destination Terminal Smithfield is a destination terminal location with : 12 silos Capacity of 18 thousand tons 16 thousand feet of rail in the yard plus 8 thousand feet of siding to service the yard Operates 24…
Leveraging Our Success Low-Cost Producer Prime Asset Portfolio Visible Growth Avenues Wisconsin Focused Vision 3.2 million tons of capacity 33 years of reserves Marcellus Exclusive rail access Three times as many distribution…
Appendix
Third Quarter Summary Three Months Period from Period from Ended August 16 through July 1 through September 30, 2013 September 30, 2012 August 15, 2012 Successor Successor Predecessor Revenues 43,515 12,643 12,601 Cost of goods…
Third Quarter Summary Three Months Period from Period from Ended August 16 through July 1 through September 30, 2013 September 30, 2012 August 15, 2012 Successor Successor Predecessor Reconciliation of EBITDA and Distributable…
Production Costs per Ton at Wyeville Hi-Crush Partners LP Production Cost per Ton Fiscal Quarter: 4Q 2011 1Q 2012 2Q 2012 3Q 2012 4Q 2012 1Q 2013 2Q 2013 3Q 2013 Predecessor Successor Combined Tons produced and delivered 206,557…
Wyeville Production Costs Non-GAAP Recon. Hi-Crush Partners LP GAAP Reconciliation of Production Costs to Cost of Goods Sold Fiscal Quarter: 4Q 2011 1Q 2012 2Q 2012 3Q 2012 4Q 2012 1Q 2013 2Q 2013 3Q 2013 (Amounts in thousands)…
 Loading...