PBF Energy Company Profile PBF is the 5th largest independent refiner Toledo Market capitalization of 2.7 billion and enterprise value of 3.5 billion (1) Ba3 / BB- credit ratings Owns three oil refineries in Ohio, Delaware and New…
PBF Logistics LP Company Profile PBF Logistics launched its initial public offering on April 30, 2014 and commenced trading on the NYSE on May 9, 2014 Market Cap of 800 million as of 9/2/14 PBF Energy owns 50.2% of PBFX, 100% of the…
Increasing Shareholder Value in 2014 Implemented several projects which enhance margin by over 170 million on an annualized basis Launched PBFX which strengthened the balance sheet and provides PBF with a valuable partner for growth…
Strong Balance Sheet Provides a Platform for Growth PBF Energy maintains a conservative financial profile with strong liquidity and access to capital markets Net Debt to Net Capitalization at June 30, 2014 was 17% Balance sheet…
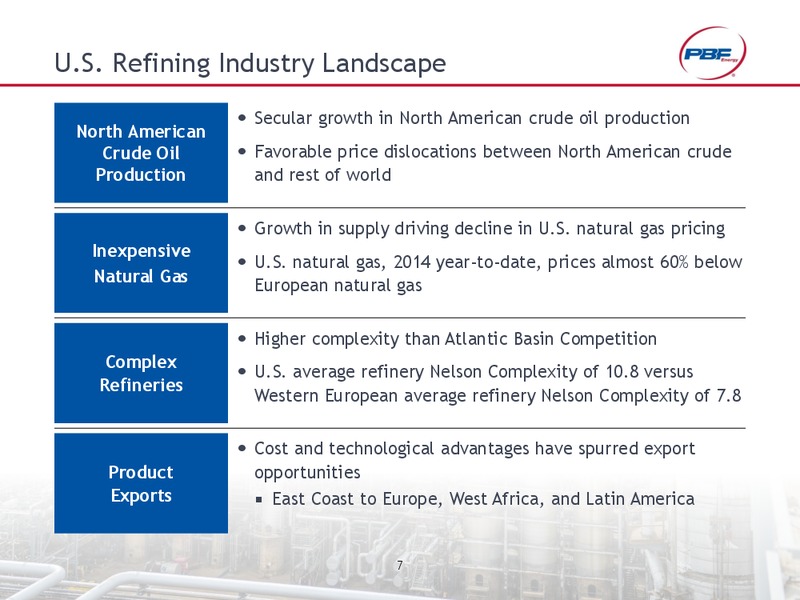
U.S. Refining Industry Landscape Secular growth in North American crude oil production North American Crude Oil Favorable price dislocations between North American crude Production and rest of world Growth in supply driving decline…
Strong Fundamentals for Industry and PBF Reached inflection point with growth of 16.0 14.4 domestic crude oil and natural gas in 2010- 14.0 12.2 12.9 2011 12.0 3.7 3.9 4.9 10.0 8.3 MMbpd 7.7 Bakken crude production has…
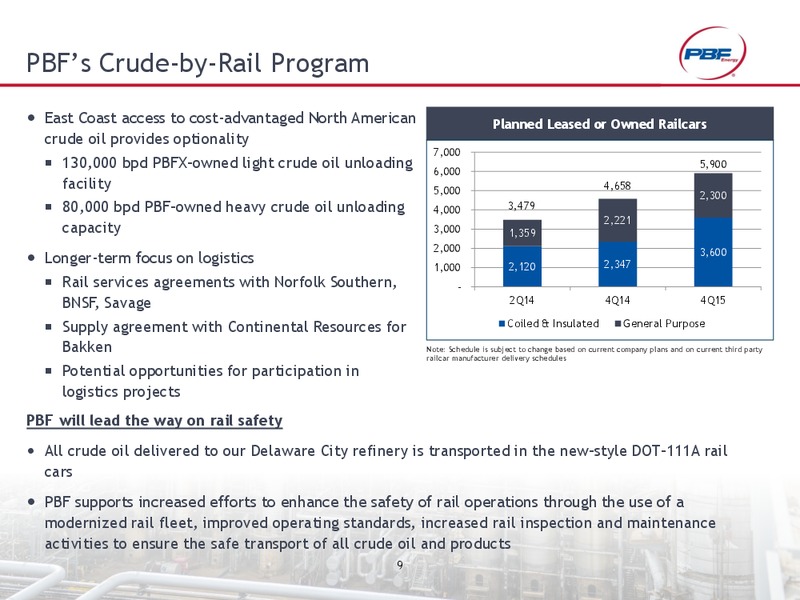
PBFs Crude-by-Rail Program East Coast access to cost-advantaged North American Planned Leased or Owned Railcars crude oil provides optionality 7,000 130,000 bpd PBFX-owned light crude oil unloading 5,900 6,000 facility 5,000 4,658…
PBFs Refining Assets East Coast Mid Continent Annual throughput of 110 million barrels Annual throughput of 50 million barrels 2:1:1 Brent-based benchmark crack 4:3:1 WTI-based benchmark crack Targeted crude differential of Brent…
PBFs 2014 margin improvement initiatives Improved East Coast distillate yield......................................margin uplift...........60 million/yr* Converted 100% of 2000ppm Heating Oil into either Ultra Low Sulfur Diesel (ULSD)…
Increasing Shareholder Value in 2014 Operate safely and efficiently Maintain capital discipline and conservative balance sheet Invest in margin improvement projects Grow through strategic acquisitions Return cash to investors through…
Appendix
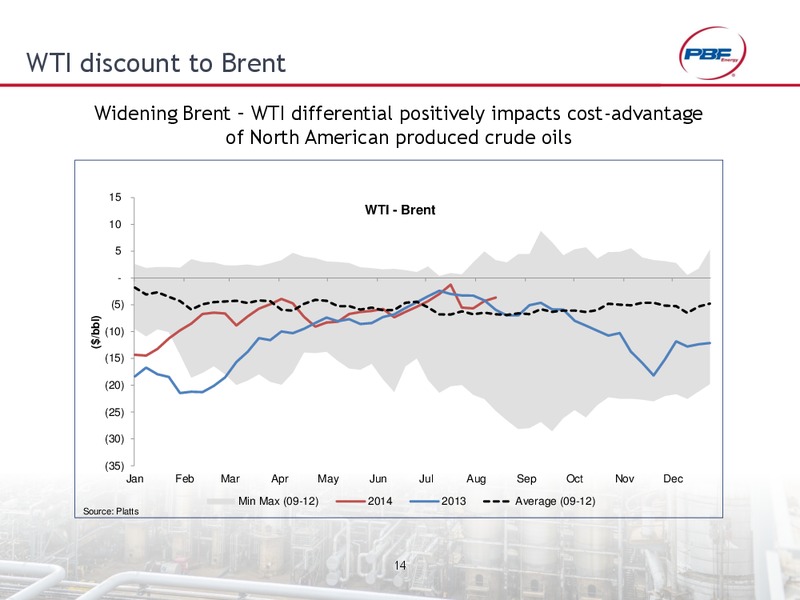
WTI discount to Brent Widening Brent WTI differential positively impacts cost-advantage of North American produced crude oils 15 WTI - Brent 10 5 - (5) (/bbl) (10) (15) (20) (25) (30) (35) Jan Feb Mar Apr May…
WCS discount to Brent Expanding differentials positively impact rail economics for Canadian Heavy crude oil processed at PBFs East Coast refineries WCS - Brent 10 - (10) (20) (/bbl) (30) (40) (50) (60)…
ASCI discount to Brent ASCI is an indicator for medium-sour barrels processed at PBFs East Coast facilities ASCI - Brent 10 5 - (5) (/bbl) (10) (15) (20) (25) Jan Feb Mar Apr May Jun Jul Aug Sep Oct Nov Dec…
Bakken versus Brent The Bakken-Brent differential is a benchmark for North American light-sweet crude processed at PBFs East Coast refineries Bakken - Brent 60 40 20 - (/bbl) (20) (40) (60) (80) Jan Feb Mar…
Canadian Syncrude Differential versus WTI Toledo processes approximately 35% to 40% Syncrude Syncrude - WTI 20 15 10 5 - (/bbl) (5) (10) (15) (20) (25) Jan Feb Mar Apr May Jun Jul Aug Sep Oct Nov Dec Min Max…
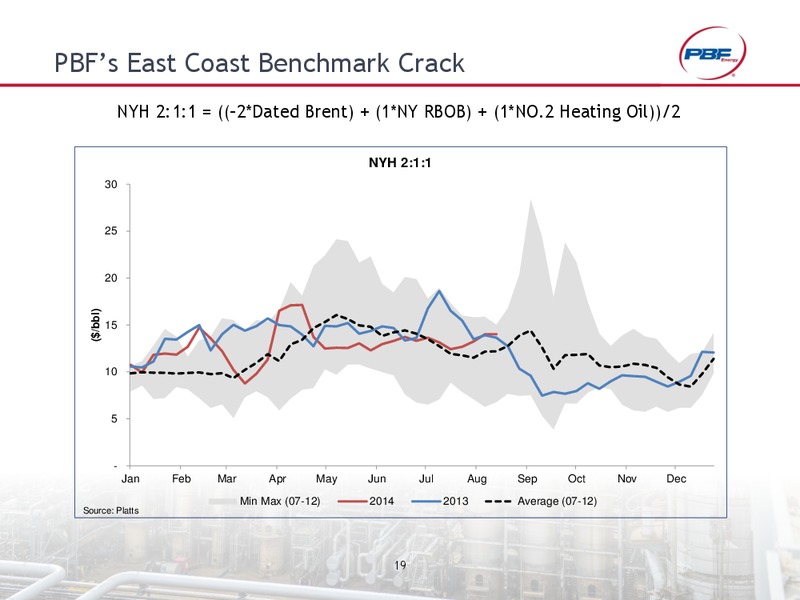
PBFs East Coast Benchmark Crack NYH 2:1:1 = ((2*Dated Brent) + (1*NY RBOB) + (1*NO.2 Heating Oil))/2 NYH 2:1:1 30 25 20 (/bbl) 15 10 5 - Jan Feb Mar Apr May Jun Jul Aug Sep Oct Nov Dec Min Max (07-12) 2014…
PBFs Mid-continent Benchmark Crack Chicago 4:3:1 = ((4*WTI) + (3*Chic CBOB pipe) + (0.5*Chic ULSD Pipe) + (0.5*USGC Jet Kero 54))/4 Chicago 4:3:1 50 40 30 20 10 (/bbl) - (10) (20) (30) (40) (50) Jan Feb Mar…
 Loading...