A Portfolio of Opportunity Wisconsin 3.2 million tons of capacity* Over 30 years of reserves Marcellus & Utica Exclusive rail access Three times as many distribution outlets as closest competitor Niche position in strongest…
Hi-Crushs Competitive Advantages Low-Cost Producer Long-term Contracted Cashflow Long-lived, High Quality Reserves Prime Portfolio of Assets Focused Vision Visible Avenues to Growth Focused On: Value Growth Returns…
Delivering Outstanding Results 2 million tons of frac sand sold in 2013 Predictable Income Double digit annual distribution growth Expansion of distribution network Visible Organic Growth Construction of Whitehall facility Lowest…
Building on Our Track Record of Success (millions, except per unit) 2013 2014(1) Sales Volumes (in tons) 1.85 mm 2.3 - 2.7 mm EBITDA (2) 69.17 80 - 90 G&A Expense (3) 16.21 18 - 21 Distributable Cash Flow 68.04 75 -85…
Growing Our Distribution IPO 2014 Guidance Distribution Increases 0.475 Low Minimum Double-Digit 0.490 - Q4 13 Quarterly Distribution 0.510 - Q1 14 Distribution Growth Raised distribution paid in Q4 2013 by 3% and Q1…
Positioning to Meet Demand Growth New Whitehall production facility 1.6 MM ton capacity Scheduled to come online in 1H 2014 New Permian distribution terminal Started delivering under new 6-year agreement with Baker Hughes…
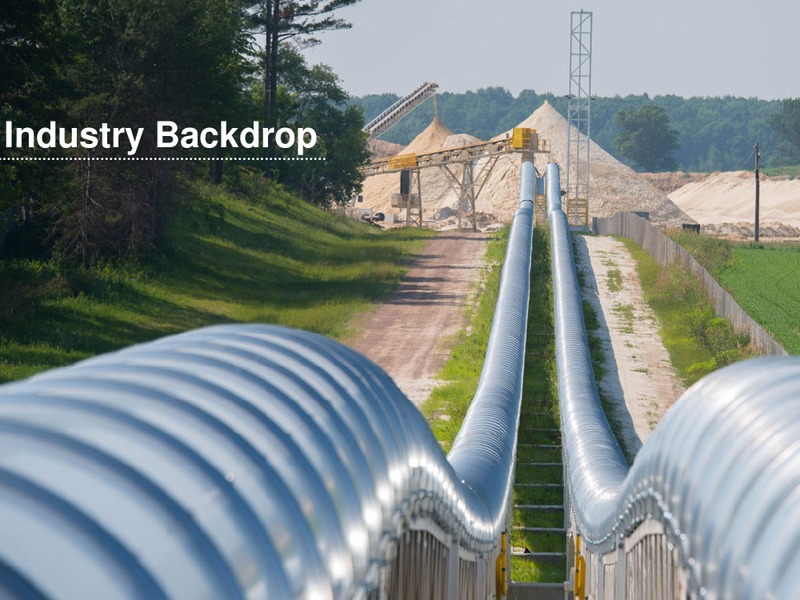
Industry Backdrop
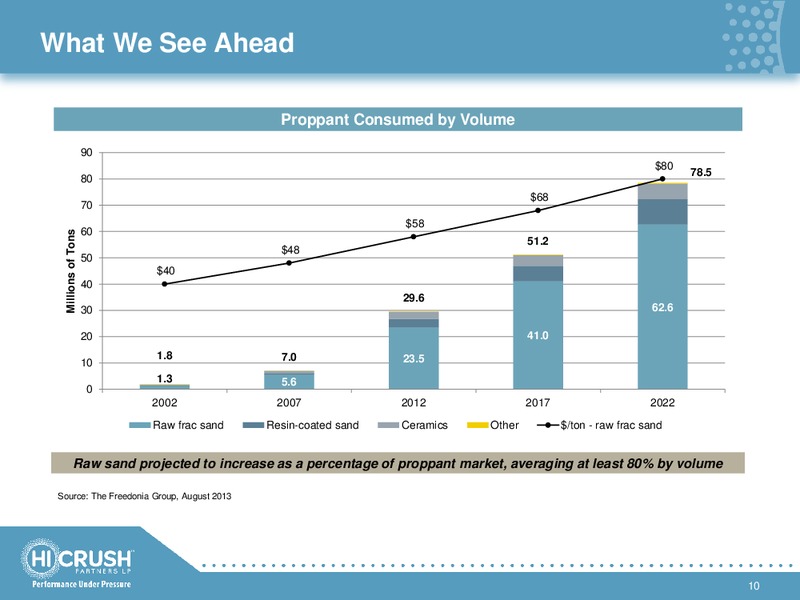
What We See Ahead Proppant Consumed by Volume 90 80 78.5 80 68 70 58 60 Millions of Tons 51.2 48 50 40 40 29.6 30 62.6 20 41.0 1.8 7.0 23.5 10 1.3 5.6 0 2002 2007 2012 2017 2022 Raw frac sand Resin-coated…
Hi-Crush Top-Tier in Consolidating Industry 8% 3% 23% 5% 16% 5% 11% 5% 8% 30% 70% 7% 6% 7% 15% 22% 8% 9% 12% Non tier-one capacity Company A Company B Company A Company B Company C Company D Company C Company D…
Logistics Flexibility Critical Access to all major US oil and gas Augusta Facility basins Whitehall Facility Destination terminals across Marcellus & Utica, added location in Sandstone Formations Permian in 2014 Wyeville…
Fourth Quarter 2013 Summary Three Months Three Months Ended Ended December 31, 2013 December 31, 2012 Successor Successor Revenues 51,498 16,215 Cost of goods sold (including depreciation, depletion 31,214 4,313 and…
Full Year 2013 Summary Period From Period From Year August 16 January 1 Ended Through Through Dec. 31, 2013 Dec. 31, 2012 Aug. 15, 2012 Successor Successor Predecessor Revenues 141,742 28,858 46,776 Cost of goods sold (including…
Fourth Quarter 2013 Summary Three Months Three Months Ended Ended December 31, 2013 December 31, 2012 Successor Successor Reconciliation of EBITDA and Distributable Cash Flow to Net Income: Net income 18,058 9,399 Depreciation…
Full Year 2013 Summary Period From Period From Year August 16 January 1 Ended Through Through December 31, 2013 December 31, 2012 August 15, 2012 Successor Successor Predecessor Reconciliation of EBITDA and Distributable Cash Flow…
Production Costs per Ton at Wyeville Hi-Crush Partners LP Production Cost per Ton Fiscal Quarter 4Q 2011 1Q 2012 2Q 2012 3Q 2012 4Q 2012 1Q 2013 2Q 2013 3Q 2013 4Q 2013 Predecessor Successor Combined Tons produced and delivered…
Wyeville Production Costs Non-GAAP Recon. Hi-Crush Partners LP GAAP Reconciliation of Production Costs to Cost of Goods Sold Fiscal Quarter 4Q 2011 1Q 2012 2Q 2012 3Q 2012 4Q 2012 1Q 2013 2Q 2013 3Q 2013 4Q 2013 (Amounts in…
 Loading...