Second Quarter 2014 Financial highlights July 24, 2014 BASF increases earnings considerably due to higher volumes
BASF increases earnings considerably due to higher volumes Business performance Q214 Q213 vs. Q213 Sales 18.5 billion 18.4 billion +1% EBITDA 2.7 billion 2.5 billion +9% EBIT before special items 2.1 billion 1.8 billion +12% EBIT 2.0…
Portfolio optimization Sale of 50% share in Styrolution to Ineos Strengthen competitiveness of Performance Products Enlarged production footprint Capacity expansions in in Asia Pacific to support growing demand Functional…
Chemicals North America drives volume and profit growth Q214 segment sales (million ) vs. Q213 EBIT before special items (million ) Petrochemicals Intermediates 800 2,019 701 601 570 +9% (2%) 600 495 527 510 4,298 400 +3% Monomers…
Performance Products Restructuring measures increase earnings Q214 segment sales (million ) vs. Q213 EBIT before special items (million ) Care Chemicals Performance 600 1,204 Chemicals 824 427 435 (2%) 394 376 400 (3%) Nutrition…
Functional Materials & Solutions Continued good demand from automotive industry Q214 segment sales (million ) vs. Q213 EBIT before special items (million ) Performance Construction 600 Materials Chemicals 1,693 541 400 356 (0%) (8%)…
Agricultural Solutions Exchange rate driven sales and earnings decrease Q214 segment sales (million ) vs. Q213 EBIT before special items (million ) 2.000 600 1,727 1,666 485 1.500 433 400 1.000 200 500 0 0 Q2 Q2 Q2 Q2 2013…
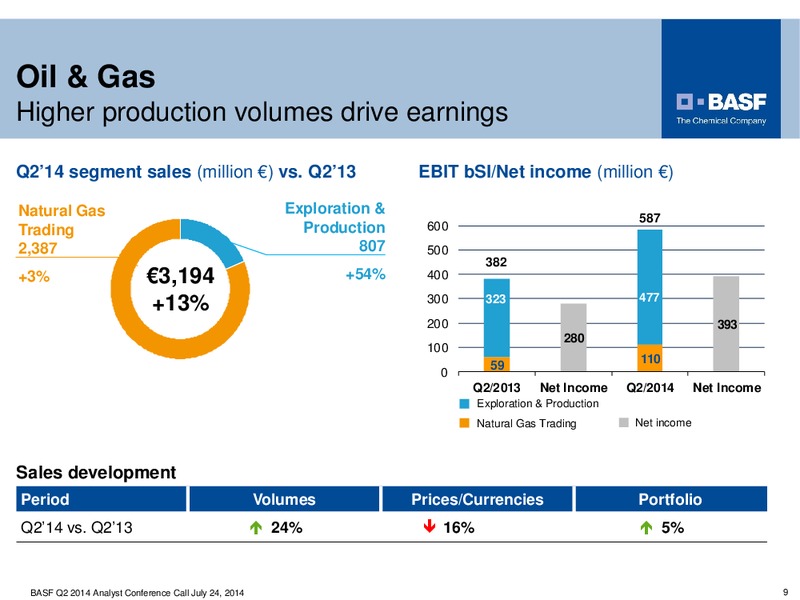
Oil & Gas Higher production volumes drive earnings Q214 segment sales (million ) vs. Q213 EBIT bSI/Net income (million ) Natural Gas Exploration & 587 Trading Production 600 2,387 807 500 382 477 +3% 3,194 +54% 400 322 477 +13% 300…
Review of Other Million Q214 Q213 Sales 855 1,072 EBIT before special items (328) (217) thereof Corporate research (97) (97) Group corporate costs (57) (58) Foreign currency results, hedges and (117) (63) other measurement effects…
Operating cash flow in H1 2014 Million H114 H113 Cash provided by operating activities 2,644 4,030 thereof Changes in net working capital (1,375) (633) Miscellaneous items (153) 646 Cash used in investing activities (2,301) (2,582)…
Outlook 2014 confirmed Outlook 2014 We aim to increase our sales volumes excluding the effects of acquisitions and divestitures. Nonetheless, sales will decline slightly compared with 2013 due to the divestiture of the gas trading and…
13
Balance sheet remains strong Balance sheet June 30, 2014 vs. December 31, 2013 Highlights June 30, 2014 (billion ) Short-term assets increased by 2.6 billion: 68.4 68.4 64.4 64.4 - Accounts receivables grew seasonally by 1.0 billion…
 Loading...