The Global Leader in Motion and Control Technologies Baird Industrial Conference Chicago, IL Jon P. Marten, EVP, Finance & Administration and CFO November 10-11, 2014
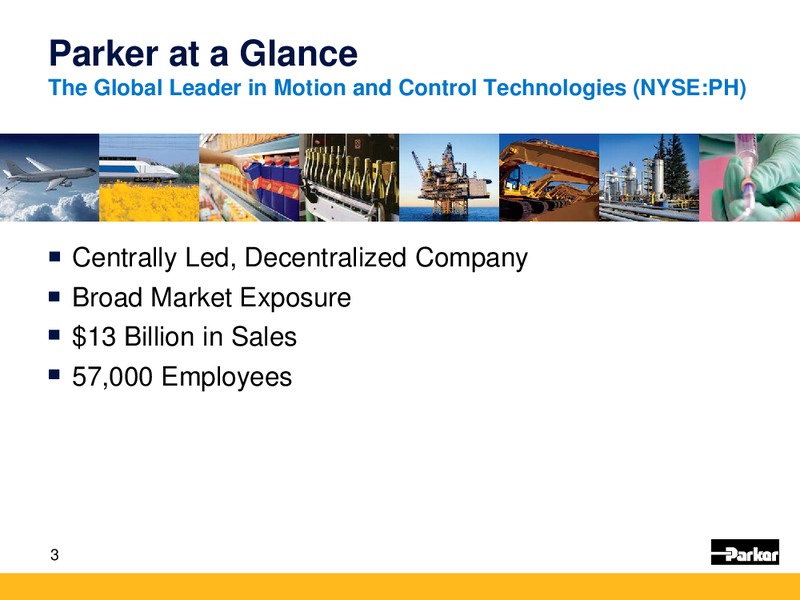
Parker at a Glance The Global Leader in Motion and Control Technologies (NYSE:PH) Centrally Led, Decentralized Company Broad Market Exposure 13 Billion in Sales 57,000 Employees 3
Why Invest in Parker Winning Culture & Values Strong Competitive Advantages Clear Strategy and Goals Consistent Execution and Performance Opportunities for Growth 4
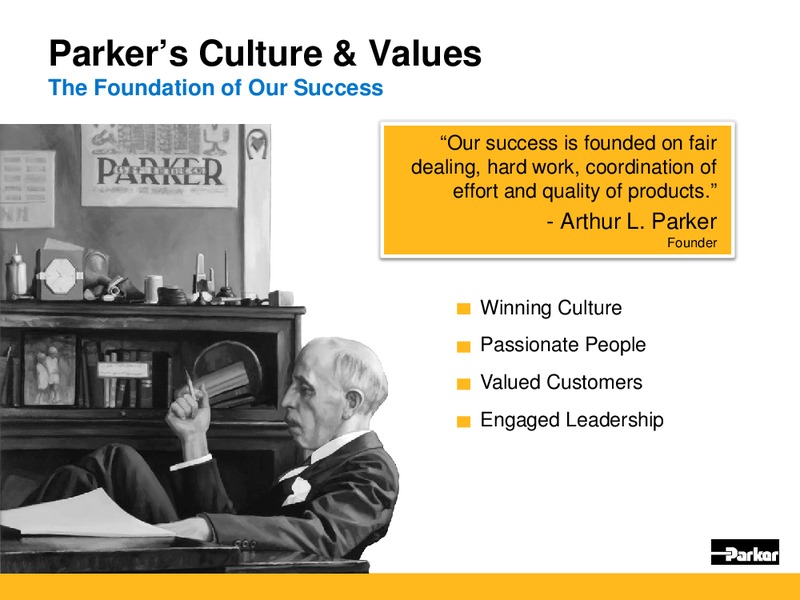
Parkers Culture & Values The Foundation of Our Success Our success is founded on fair dealing, hard work, coordination of effort and quality of products. - Arthur L. Parker Founder Winning Culture Passionate People Valued…
Why Invest in Parker Winning Culture & Values Strong Competitive Advantages Clear Strategy and Goals Consistent Execution and Performance Opportunities for Growth 6
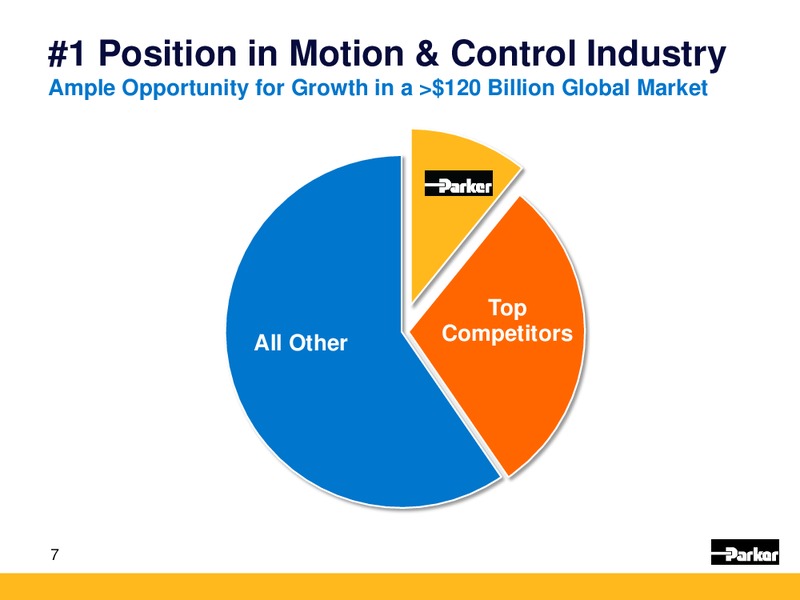
1 Position in Motion & Control Industry Ample Opportunity for Growth in a 120 Billion Global Market Top All Other Competitors 7
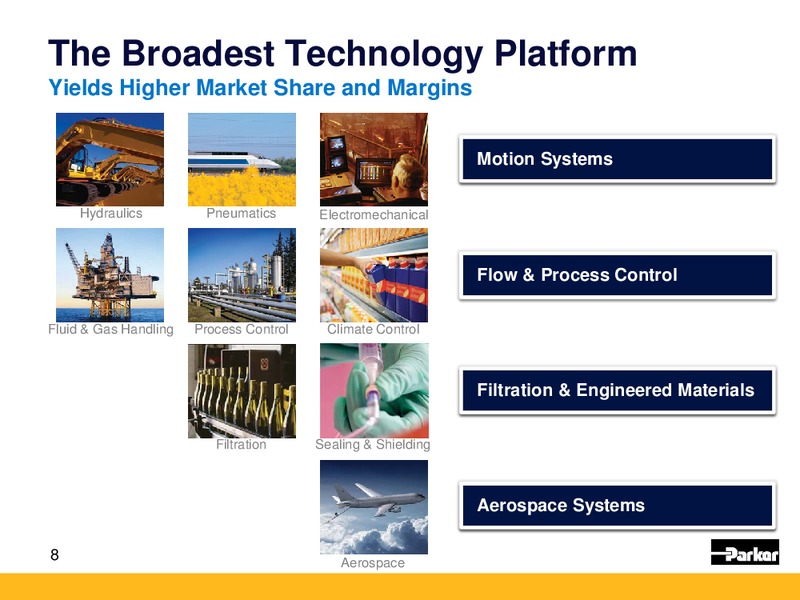
The Broadest Technology Platform Yields Higher Market Share and Margins Motion Systems Hydraulics Pneumatics Electromechanical Flow & Process Control Fluid & Gas Handling Process Control Climate Control Filtration &…
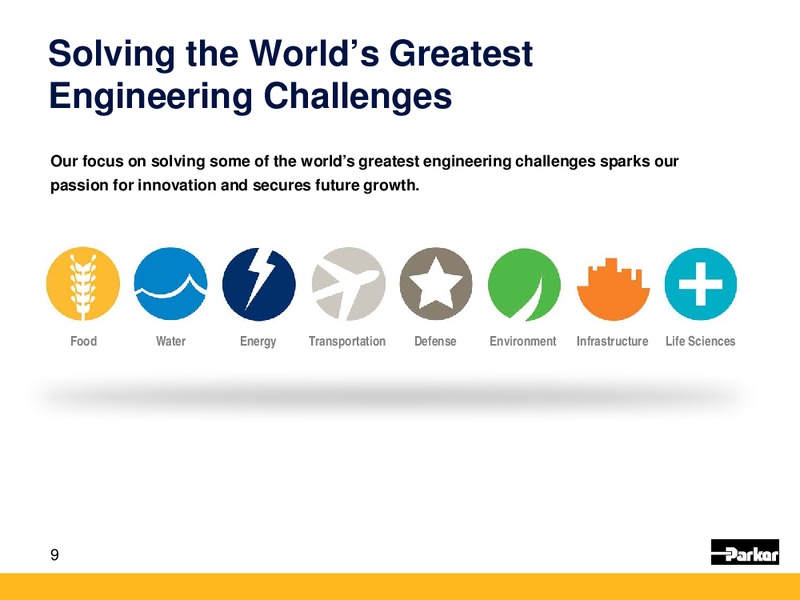
Solving the Worlds Greatest Engineering Challenges Our focus on solving some of the worlds greatest engineering challenges sparks our passion for innovation and secures future growth. Food Water Energy Transportation Defense…
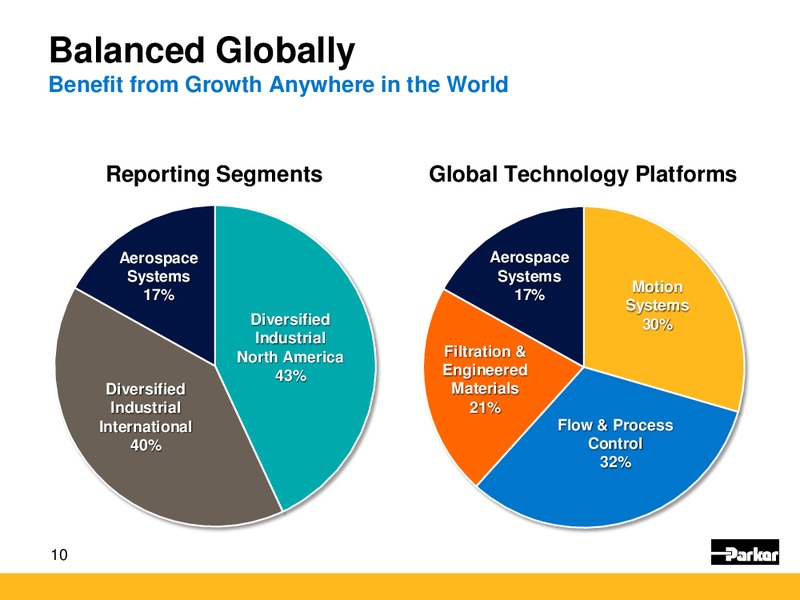
Balanced Globally Benefit from Growth Anywhere in the World Reporting Segments Global Technology Platforms Aerospace Aerospace Systems Systems Motion 17% 17% Systems Diversified 30% Industrial North America Filtration & 43%…
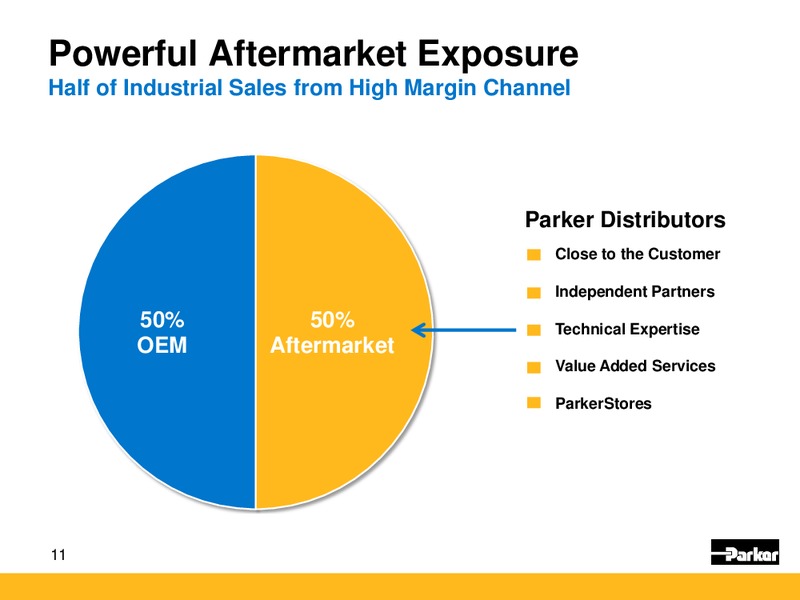
Powerful Aftermarket Exposure Half of Industrial Sales from High Margin Channel Parker Distributors Close to the Customer Independent Partners 50% 50% Technical Expertise OEM Aftermarket Value Added Services ParkerStores…
Why Invest in Parker Winning Culture & Values Strong Competitive Advantages Clear Strategy and Goals Consistent Execution and Performance Opportunities for Growth 12
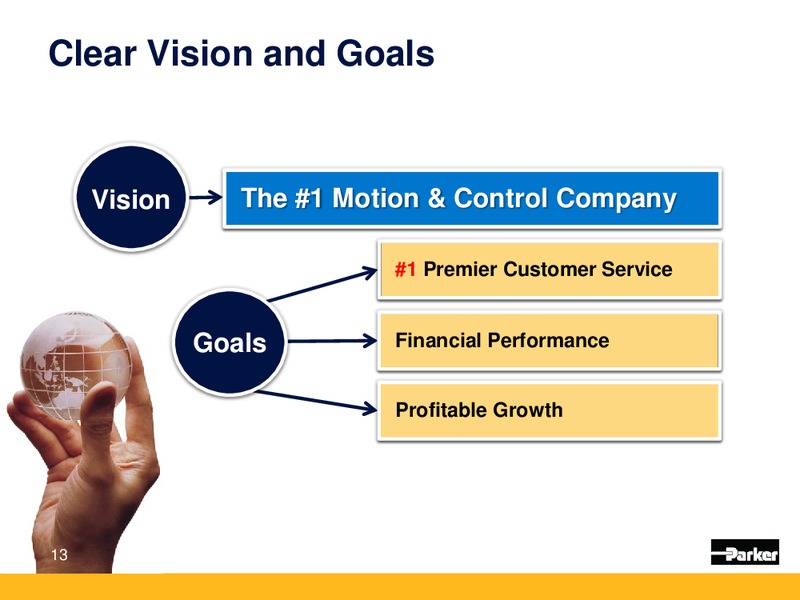
Clear Vision and Goals Vision Vision The 1 Motion & Control Company 1 Premier Customer Service Goals Financial Performance Profitable Growth 13
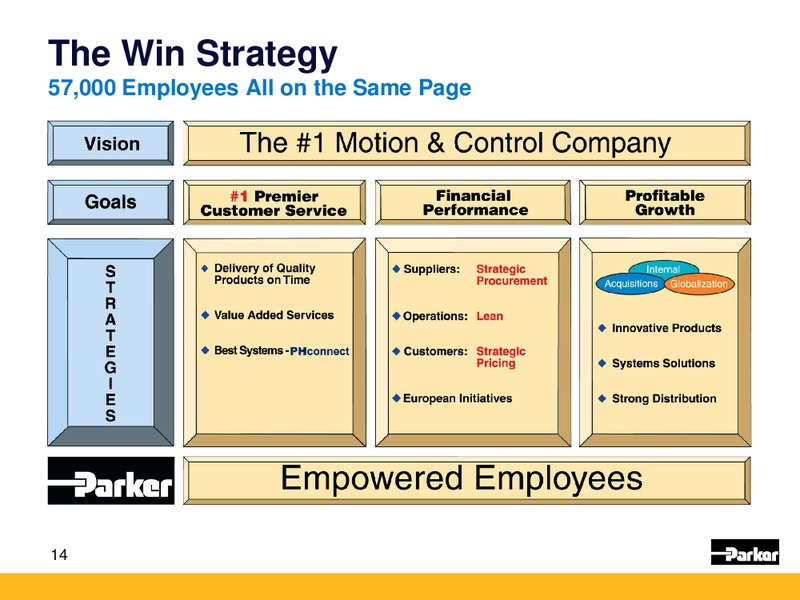
The Win Strategy 57,000 Employees All on the Same Page 14
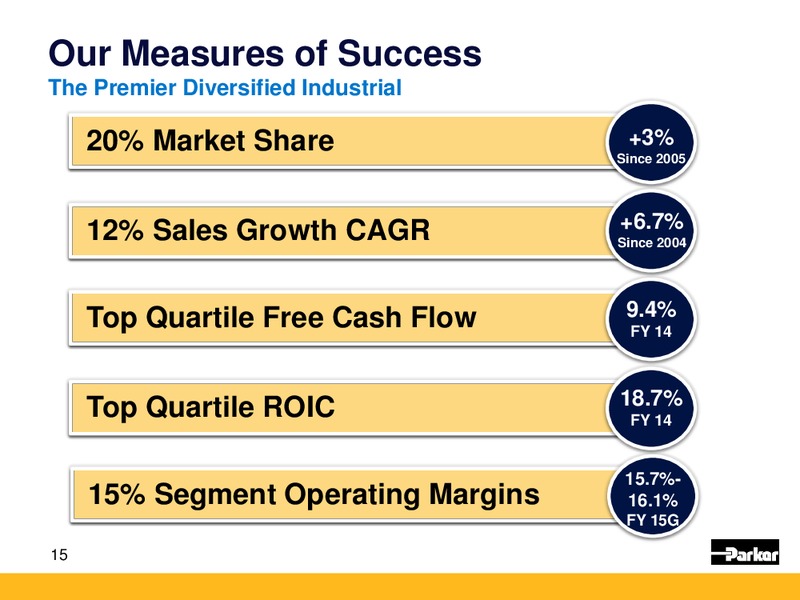
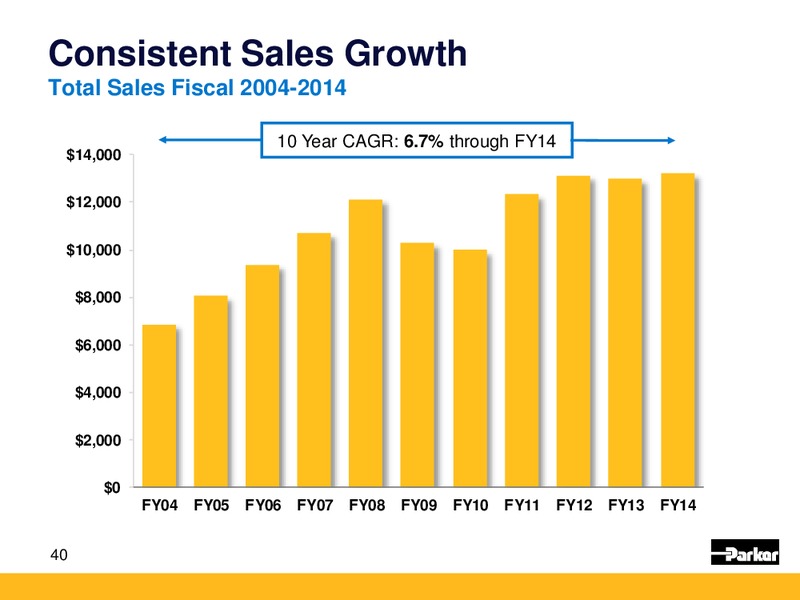
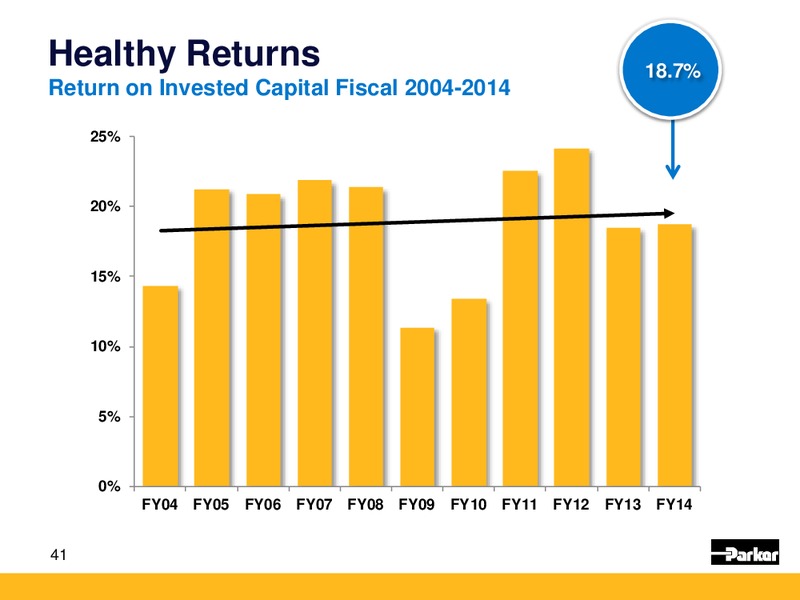
Our Measures of Success The Premier Diversified Industrial 20% Market Share +3% Since 2005 12% Sales Growth CAGR +6.7% Since 2004 Top Quartile Free Cash Flow 9.4% FY 14 Top Quartile ROIC 18.7% +2-4% FY 14 10%…
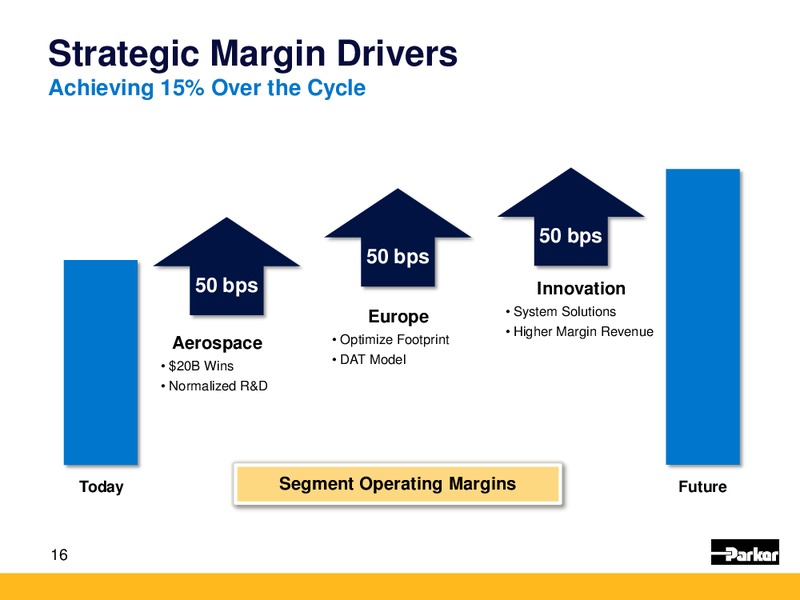
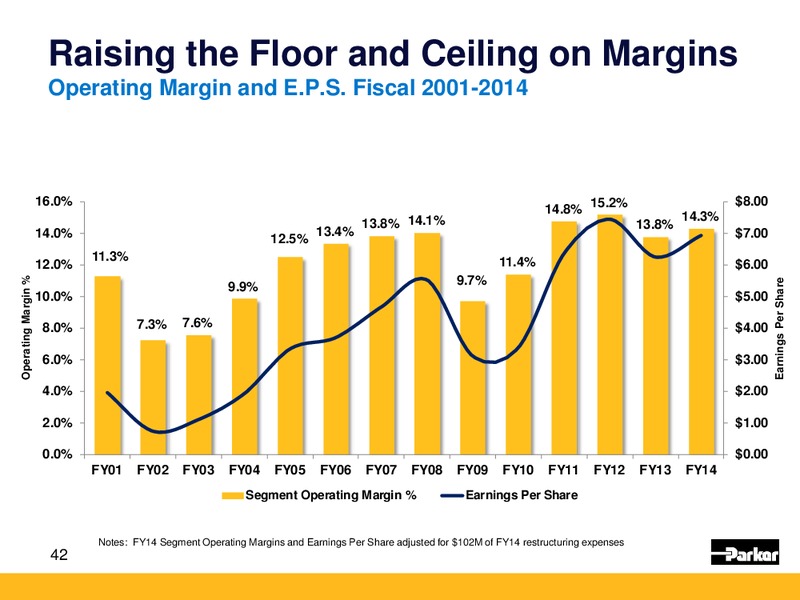
Strategic Margin Drivers Achieving 15% Over the Cycle 50 bps 50 bps 50 bps Innovation Europe System Solutions Higher Margin Revenue Aerospace Optimize Footprint 20B Wins DAT Model Normalized R&D Today Segment Operating…
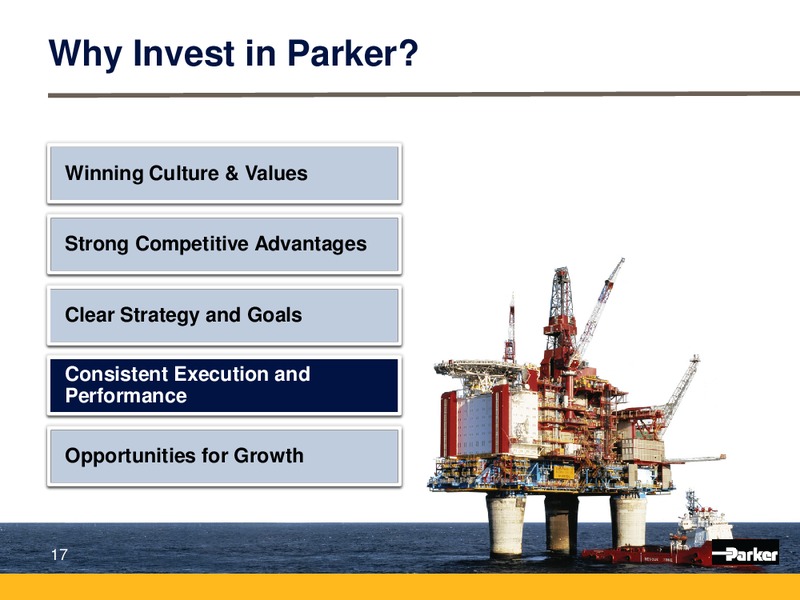
Why Invest in Parker Winning Culture & Values Strong Competitive Advantages Clear Strategy and Goals Consistent Execution and Performance Opportunities for Growth 17
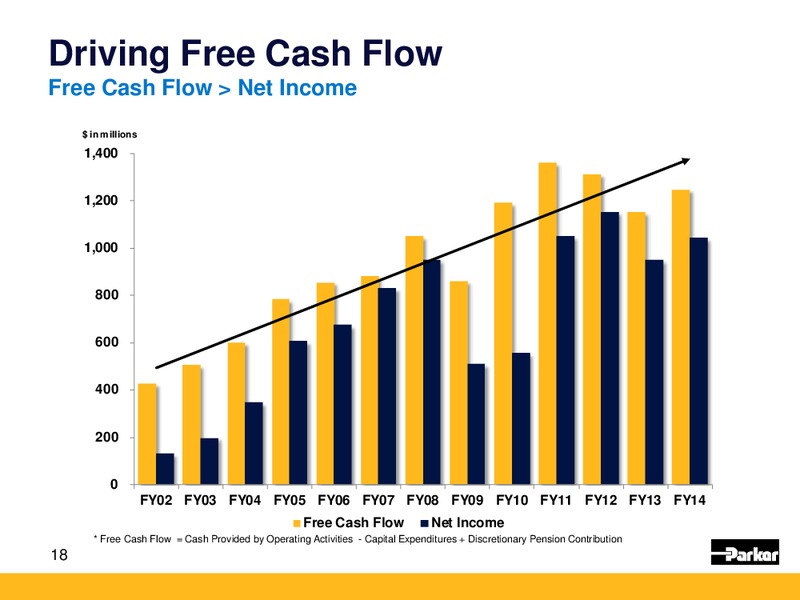
Driving Free Cash Flow Free Cash Flow Net Income in m illions 1,400 1,200 1,000 800 600 400 200 0 FY02 FY03 FY04 FY05 FY06 FY07 FY08 FY09 FY10 FY11 FY12 FY13 FY14 Free Cash Flow Net Income * Free Cash Flow =…
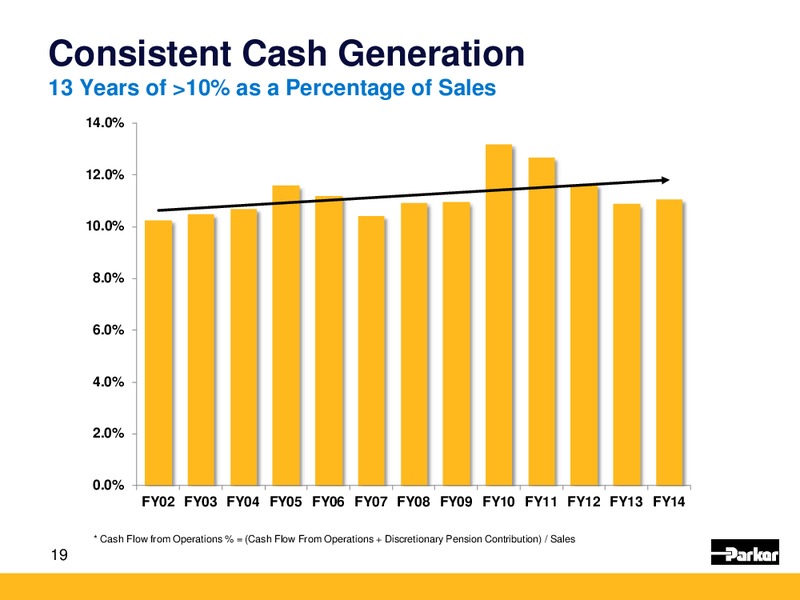
Consistent Cash Generation 13 Years of 10% as a Percentage of Sales 14.0% 12.0% 10.0% 8.0% 6.0% 4.0% 2.0% 0.0% FY02 FY03 FY04 FY05 FY06 FY07 FY08 FY09 FY10 FY11 FY12 FY13 FY14 * Cash Flow from Operations % = (Cash…
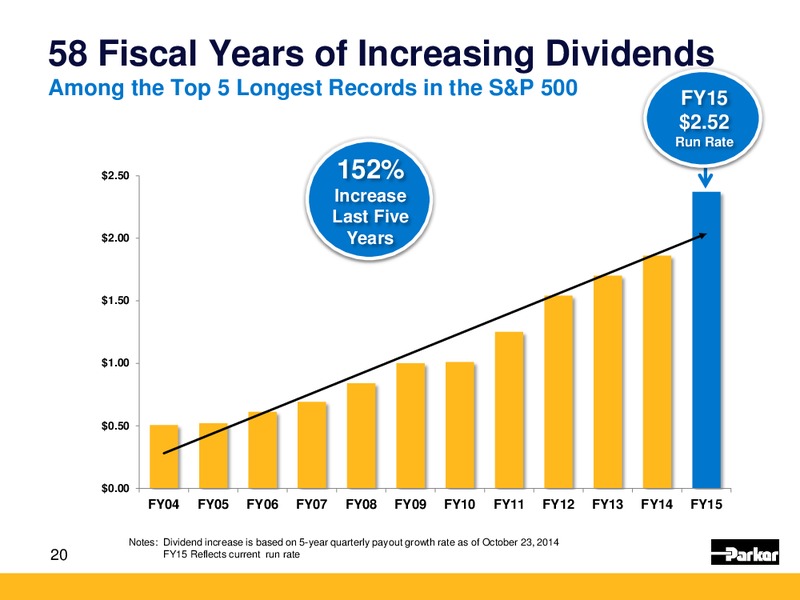
58 Fiscal Years of Increasing Dividends Among the Top 5 Longest Records in the S&P 500 FY15 2.52 Run Rate 2.50 152% Increase Last Five 2.00 Years 1.50 1.00 0.50 0.00 FY04 FY05 FY06 FY07 FY08 FY09 FY10 FY11 FY12…
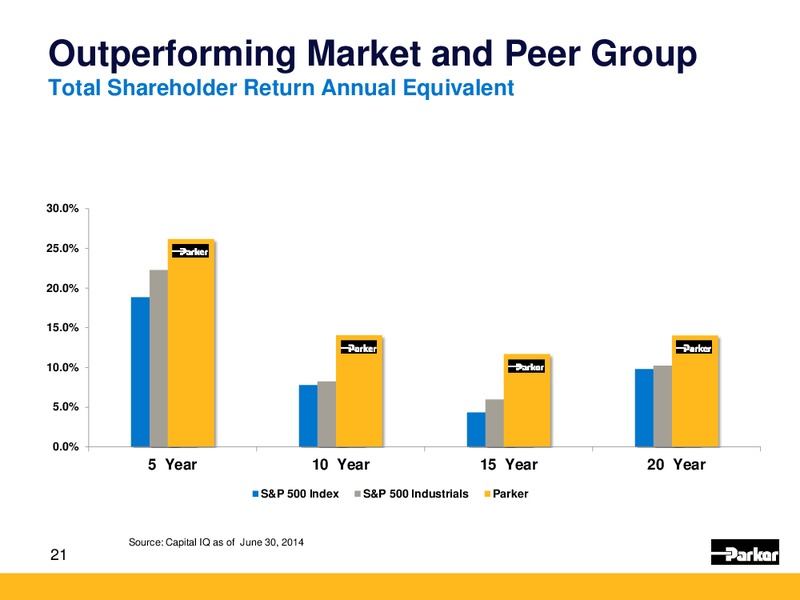
Outperforming Market and Peer Group Total Shareholder Return Annual Equivalent 30.0% 25.0% 20.0% 15.0% 10.0% 5.0% 0.0% 5 Year 10 Year 15 Year 20 Year S&P 500 Index S&P 500 Industrials Parker Source: Capital IQ as of…
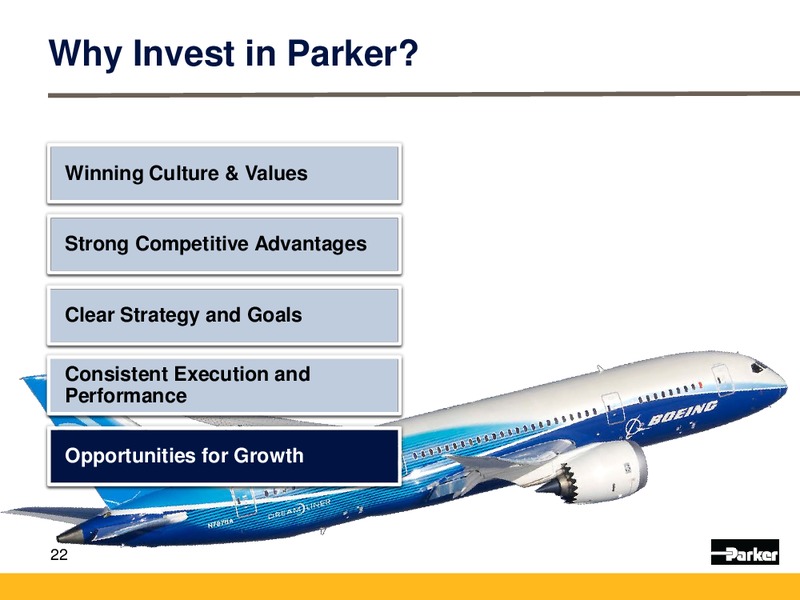
Why Invest in Parker Winning Culture & Values Strong Competitive Advantages Clear Strategy and Goals Consistent Execution and Performance Opportunities for Growth 22
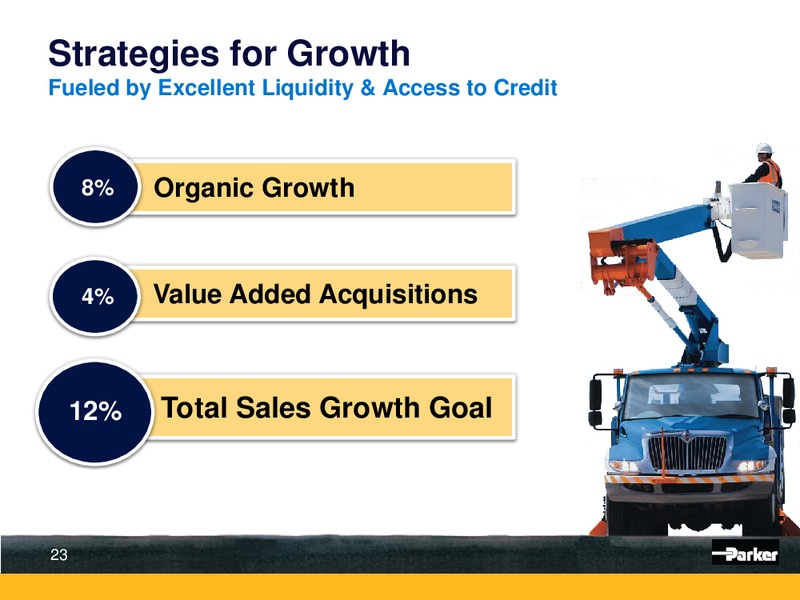
Strategies for Growth Fueled by Excellent Liquidity & Access to Credit 8% Organic Growth 4% Value Added Acquisitions 12% Total Sales Growth Goal 10% 23
Organic Growth Strategy Driven by Global Reach & Technology Synergies Emerging Markets Expanded Distribution Innovation Systems Solutions 24
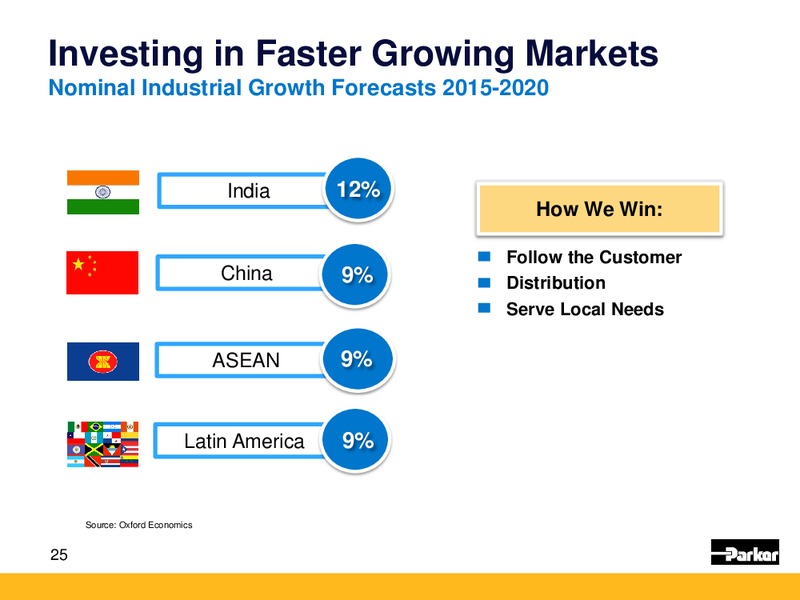
Investing in Faster Growing Markets Nominal Industrial Growth Forecasts 2015-2020 India 12% How We Win: Follow the Customer China 9% Distribution Serve Local Needs ASEAN 9% Latin America 9% Source: Oxford Economics 25
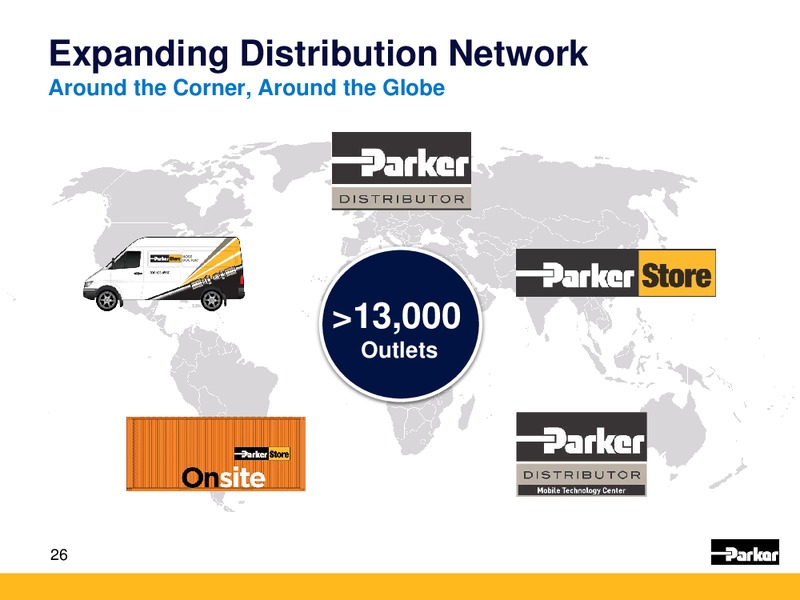
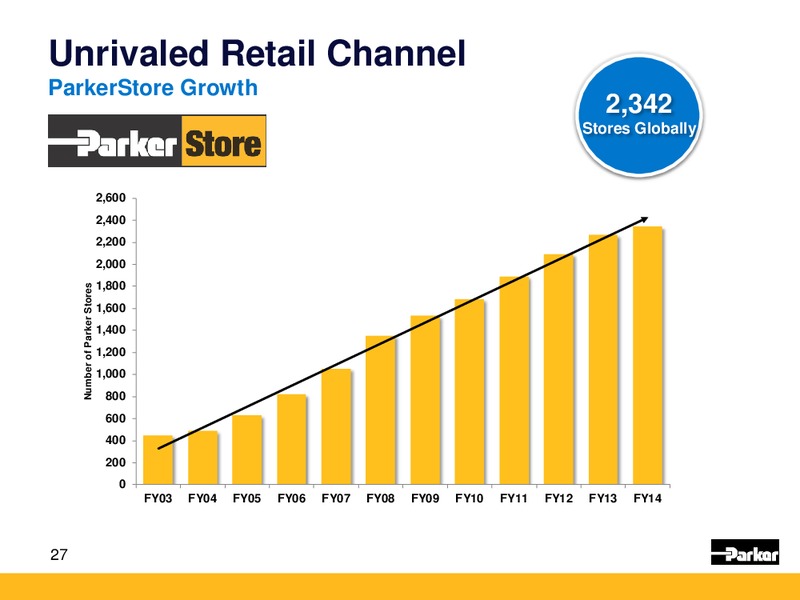
Expanding Distribution Network Around the Corner, Around the Globe 13,000 10% Outlets Growth 26
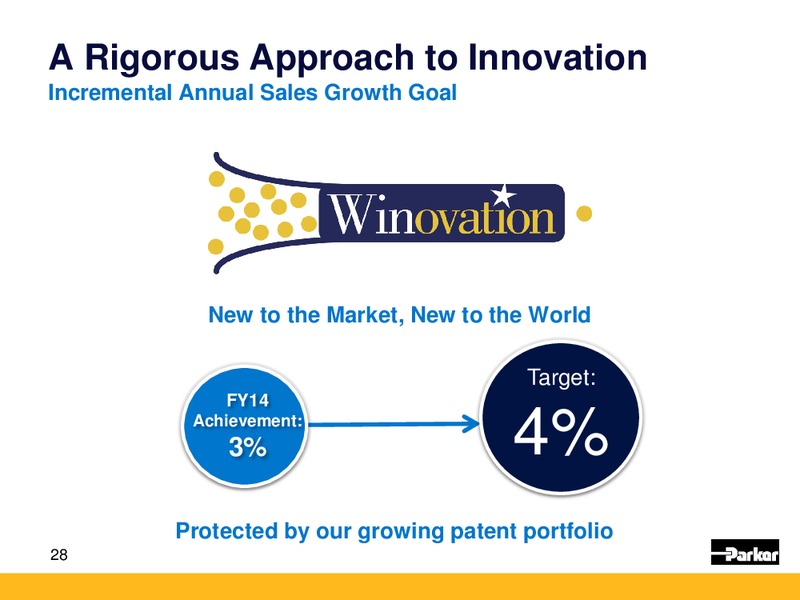
A Rigorous Approach to Innovation Incremental Annual Sales Growth Goal New to the Market, New to the World Target: FY14 Achievement: 3% 4% Protected by our growing patent portfolio 28
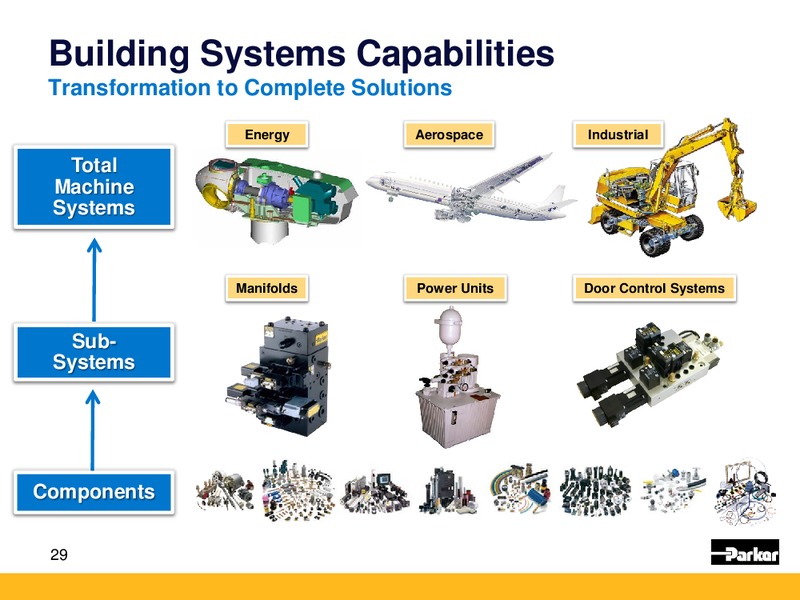
Building Systems Capabilities Transformation to Complete Solutions Energy Aerospace Industrial Total Machine Systems Manifolds Power Units Door Control Systems Sub- Systems Components 29
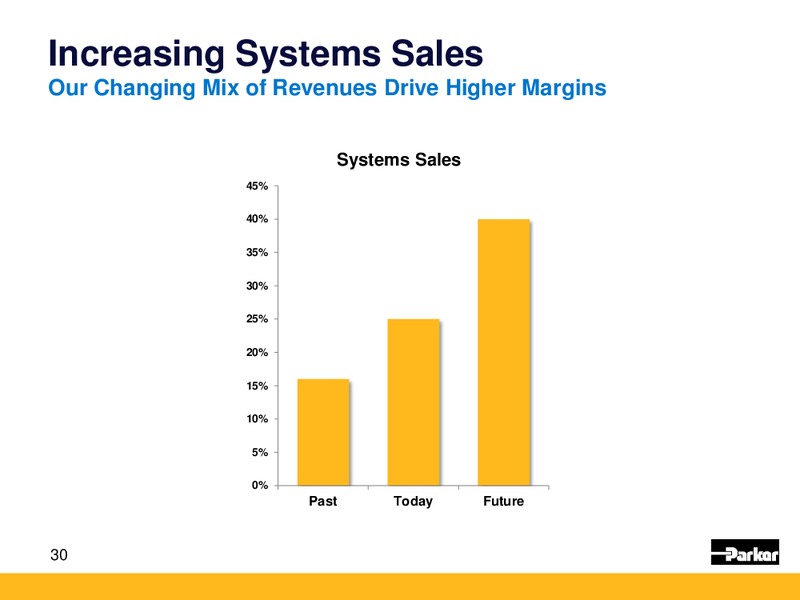
Increasing Systems Sales Our Changing Mix of Revenues Drive Higher Margins Systems Sales 45% 40% 35% 30% 25% 20% 15% 10% 5% 0% Past Today Future 30
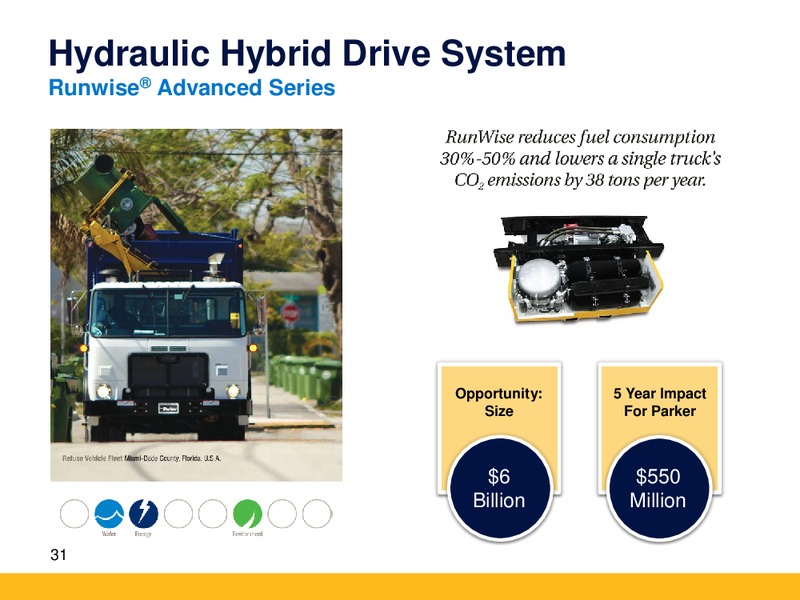
Hydraulic Hybrid Drive System Runwise Advanced Series Opportunity: 5 Year Impact Size For Parker 6 550 Billion Million 31
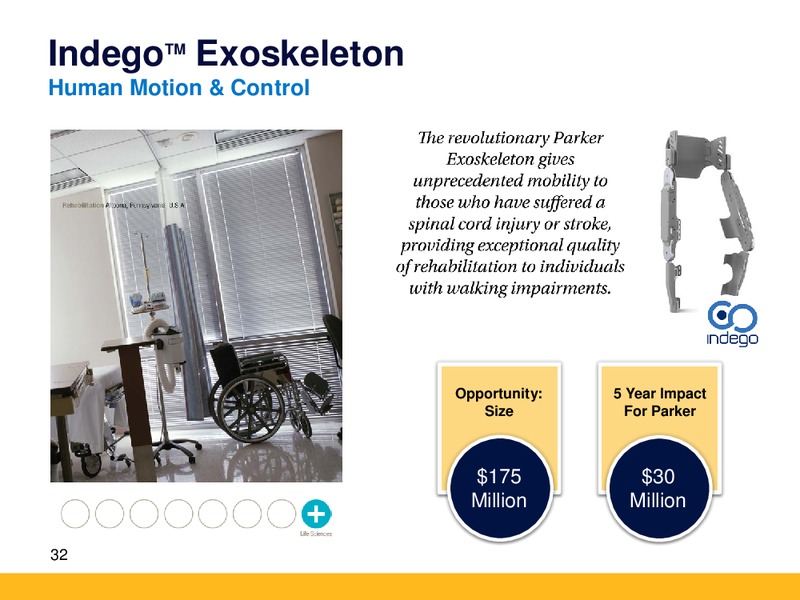
IndegoTM Exoskeleton Human Motion & Control Opportunity: 5 Year Impact Size For Parker 175 30 Million Million 32
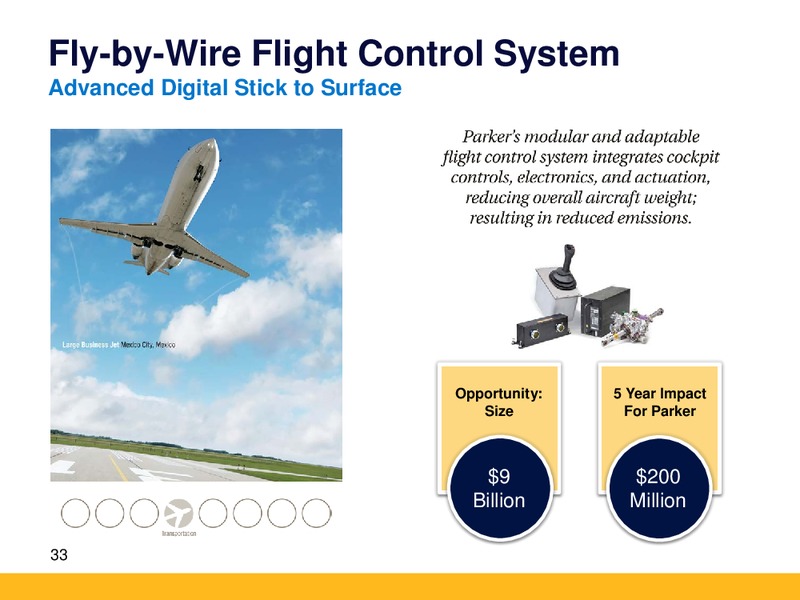
Fly-by-Wire Flight Control System Advanced Digital Stick to Surface Opportunity: 5 Year Impact Size For Parker 9 200 Billion Million 33
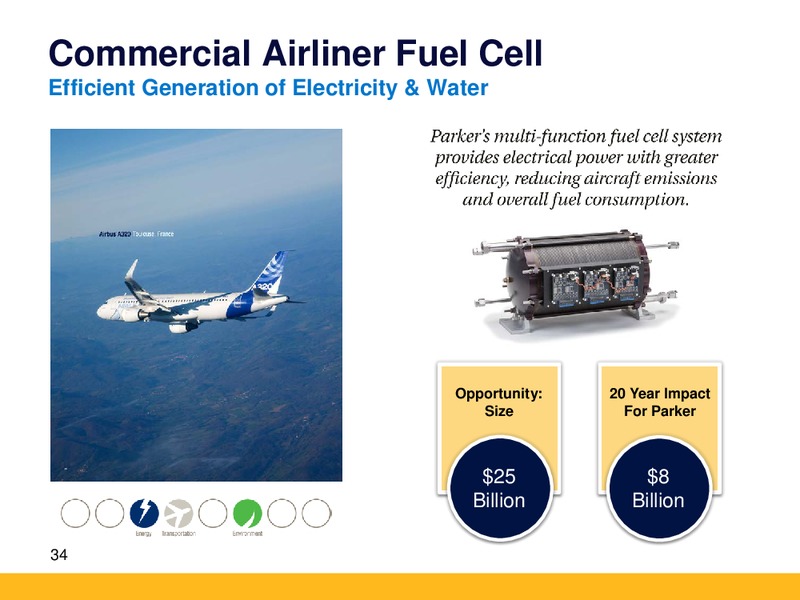
Commercial Airliner Fuel Cell Efficient Generation of Electricity & Water Opportunity: 20 Year Impact Size For Parker 25 8 Billion Billion 34
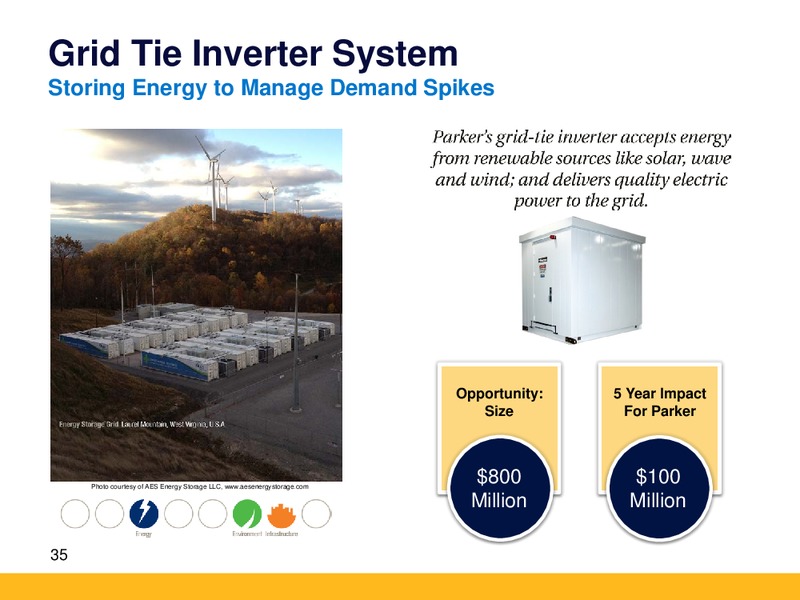
Grid Tie Inverter System Storing Energy to Manage Demand Spikes Opportunity: 5 Year Impact Size For Parker Photo courtesy of AES Energy Storage LLC, www.aesenergystorage.com 800 100 Million Million 35
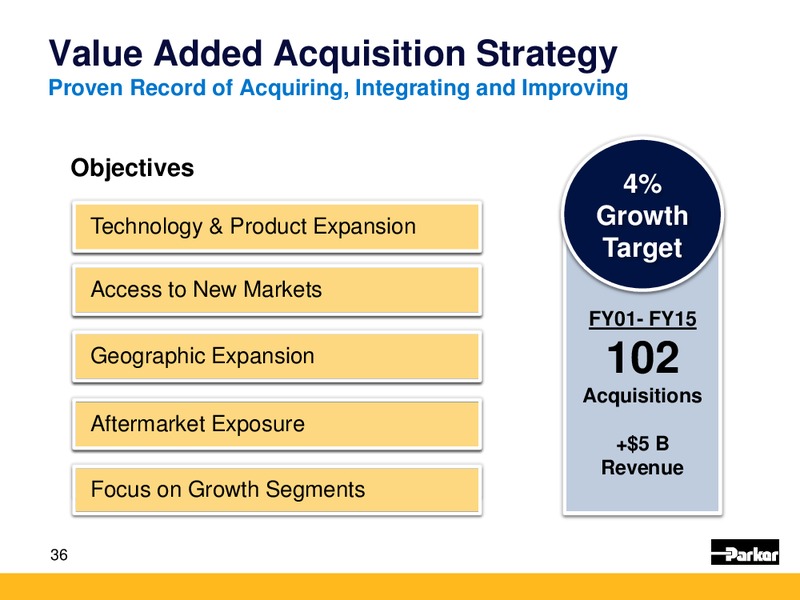
Value Added Acquisition Strategy Proven Record of Acquiring, Integrating and Improving Objectives 4% Technology & Product Expansion Growth Target Access to New Markets FY01- FY15 Geographic Expansion 102 Acquisitions…
Why Invest in Parker Winning Culture & Values Strong Competitive Advantages Clear Strategy and Goals Consistent Execution and Performance Opportunities for Growth 37
 Loading...