LINN Energy Response to Another Round of Short Seller Comments April 1, 2013
Introduction This presentation addresses the following three topics: 1. Cash flow from operating activities Historical cash flow from operating activities was prepared in accordance with generally accepted accounting principles (GAAP).…
Cash Flow Analysis The table below reconciles GAAP cash flow from operating activities to the non-GAAP metric of DCF. LINN has fully covered its distribution and maintenance capex and since 2009 has generated 325 million of excess cash…
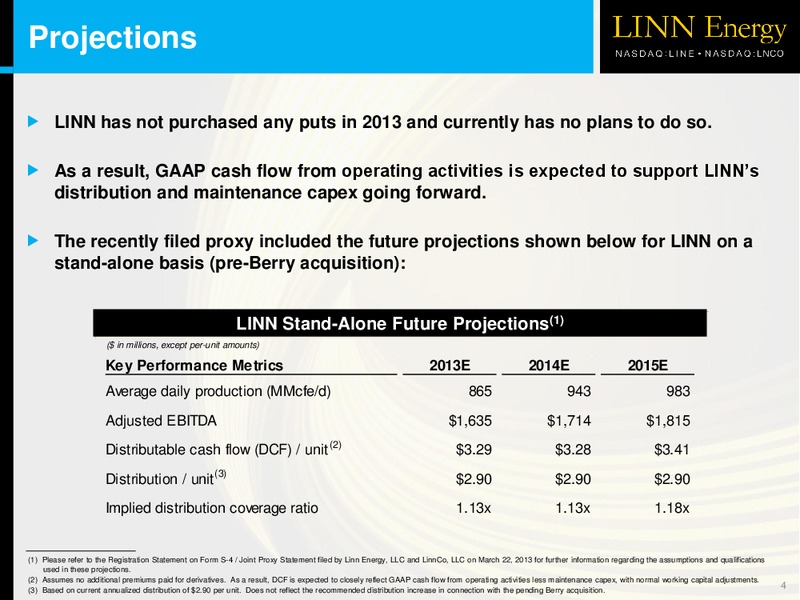
Projections LINN has not purchased any puts in 2013 and currently has no plans to do so. As a result, GAAP cash flow from operating activities is expected to support LINNs distribution and maintenance capex going forward. The…
Organic Reserve Replacement LINNs maintenance capex is a supportable metric. Maintenance includes LINNs most efficient inventory of projects. LINN has achieved organic reserve replacement of 168% for the last 4 years. Historical…
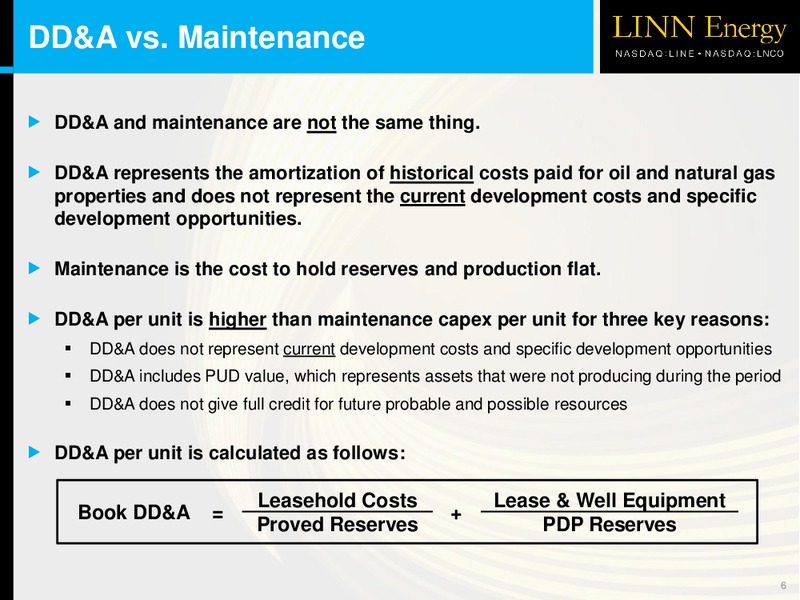
DD&A vs. Maintenance DD&A and maintenance are not the same thing. DD&A represents the amortization of historical costs paid for oil and natural gas properties and does not represent the current development costs and specific…
Maintenance Maintenance is defined as the cost to hold reserves and production flat. LINN continually ranks its extensive inventory of future drilling locations and other maintenance activities based on efficiency and implements the…
NAV Analysis LINN is undervalued (37.97 per unit as of March 28) relative to its NAV. Internal NAV analysis implies an equity value of 44.74 - 64.74 per unit. Third-party advisor analysis values LINN at 37.34 - 51.15 per unit. Upside…
NAV Schedule (Internal Case) Proved reserves discounted at 7.5%, hedge book value and facilities of 10 billion, combined with unproved discounted at 15% and 10% implies an equity value between 44.74 - 64.74 per unit, respectively.…
 Loading...