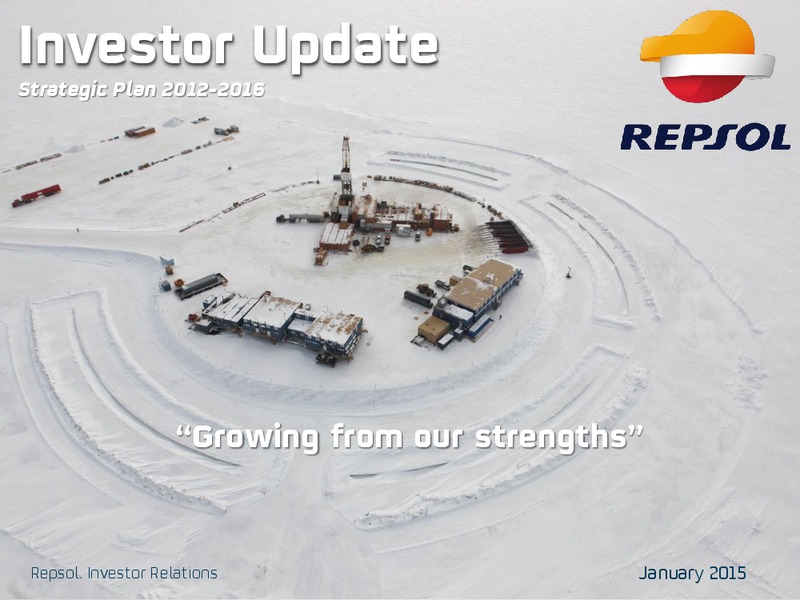
Investor Update Strategic Plan 2012-2016 Growing from our strengths Repsol. Investor Relations January 2015
1. Company Overview 2. Repsol: A Transformation Story 3. Acquisition of Talisman Energy 4. Upstream 5. Downstream 6. Gas Natural Fenosa 7. Financial Position 8. Environmental, Social & Governance 9. Summary 10. Annex 3
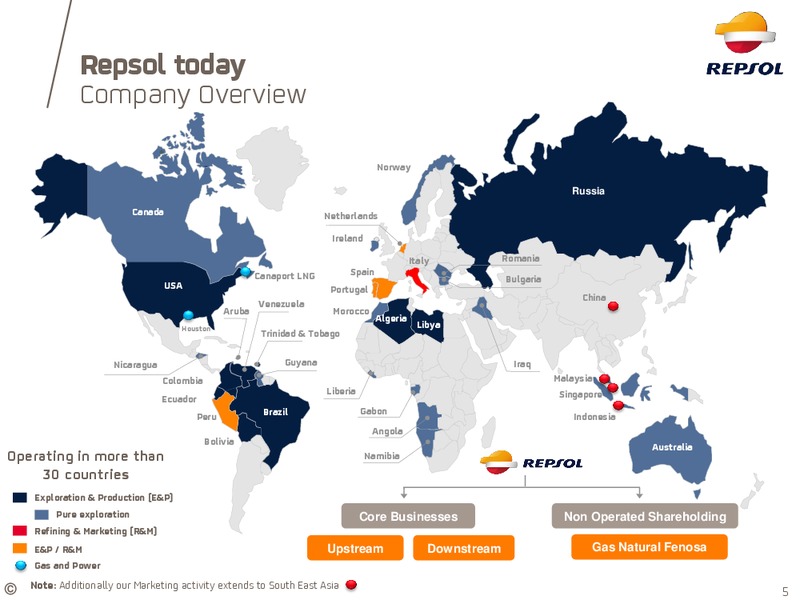
Repsol today Company Overview Norway Russia Canada Netherlands Ireland Italy Romania Canaport LNG Spain Bulgaria USA Portugal China Venezuela Aruba Morocco Algeria Houston Libya Trinidad & Tobago Nicaragua Guyana…
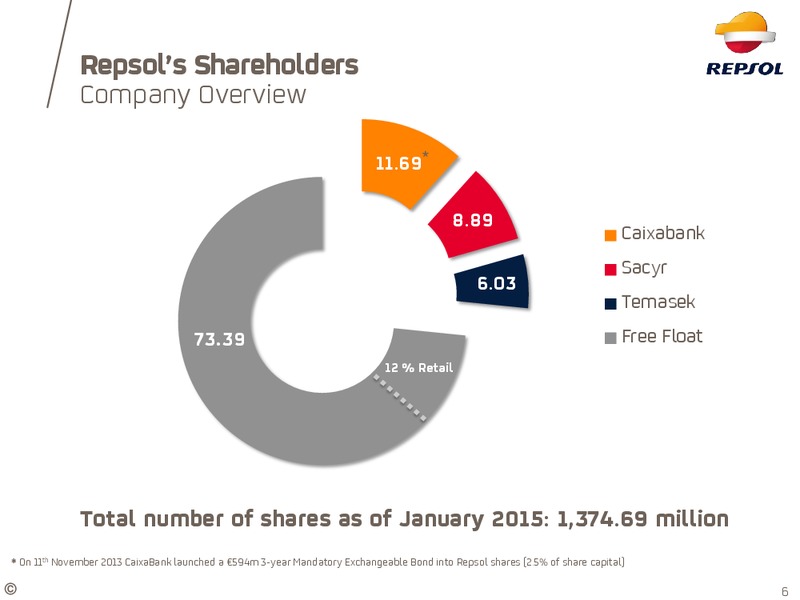
Repsols Shareholders Company Overview 11.69* 8.89 Caixabank Sacyr 6.03 Temasek 73.39 Free Float 12 % Retail Total number of shares as of January 2015: 1,374.69 million * On 11th November 2013 CaixaBank launched a 594m…
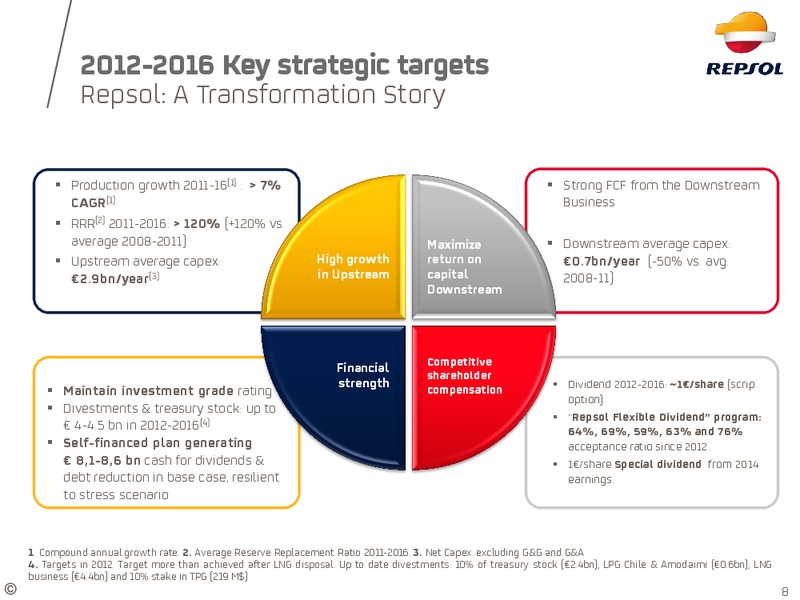
2012-2016 Key strategic targets Repsol: A Transformation Story Production growth 2011-16(1) : 7% Strong FCF from the Downstream CAGR(1) Business RRR(2) 2011-2016: 120% (+120% vs. average 2008-2011) Maximize Downstream average…
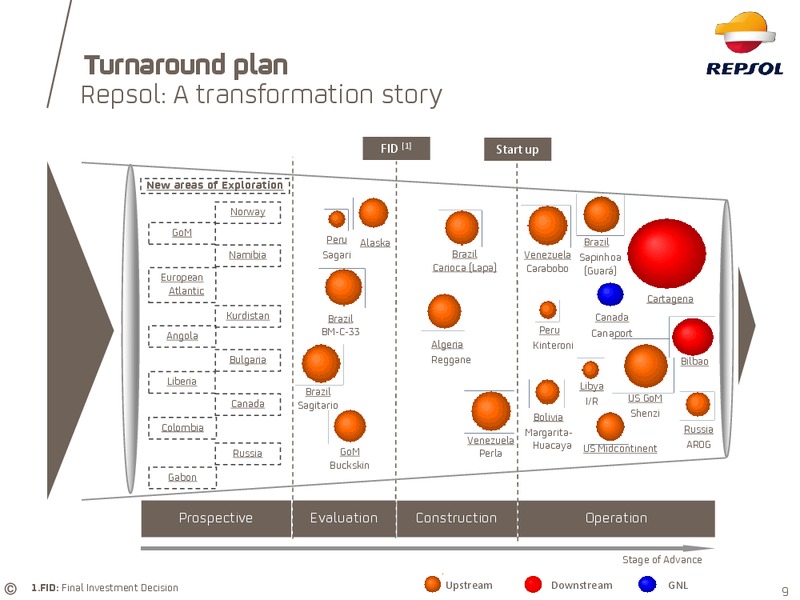
Turnaround plan Repsol: A transformation story FID [1] Start up New areas of Exploration Norway GoM Peru Alaska Brazil Namibia Sagari Brazil Venezuela Sapinhoa Carioca (Lapa) Carabobo (Guar) European Atlantic Cartagena…
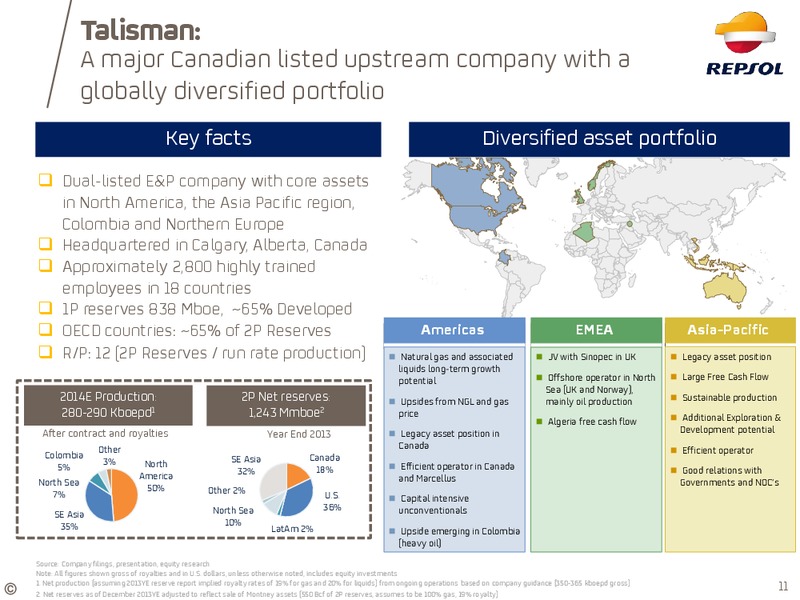
Talisman: A major Canadian listed upstream company with a globally diversified portfolio Key facts Diversified asset portfolio Dual-listed E&P company with core assets in North America, the Asia Pacific region, Colombia and…
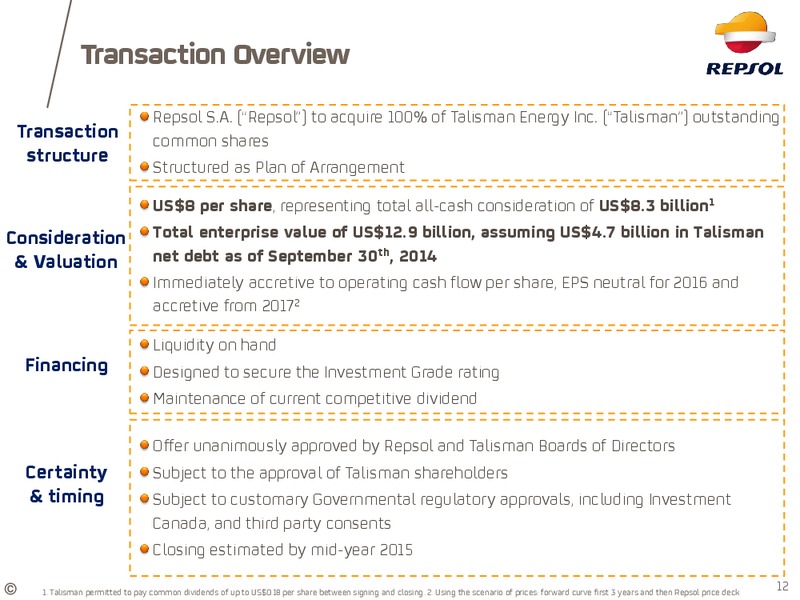
Transaction Overview Repsol S.A. (Repsol) to acquire 100% of Talisman Energy Inc. (Talisman) outstanding Transaction common shares structure Structured as Plan of Arrangement US8 per share, representing total all-cash consideration…
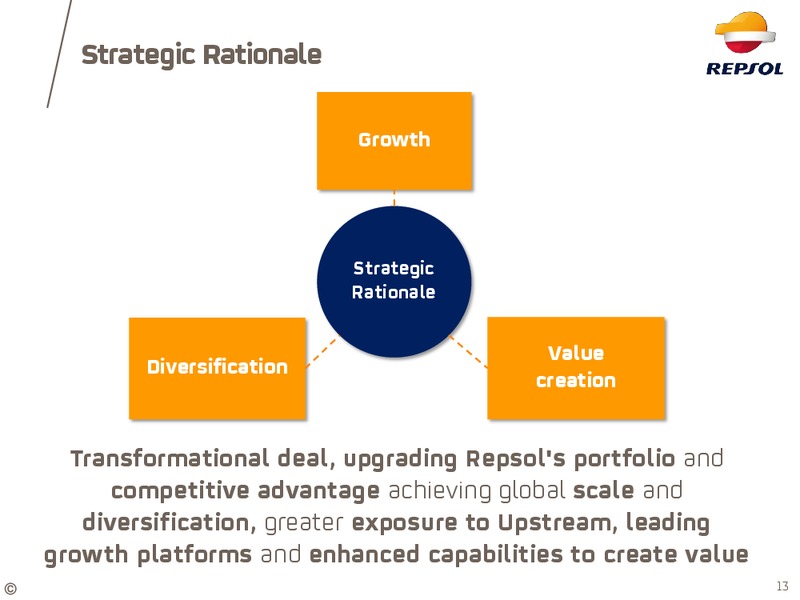
Strategic Rationale Growth Strategic Rationale Value Diversification creation Transformational deal, upgrading Repsol's portfolio and competitive advantage achieving global scale and diversification, greater exposure to…
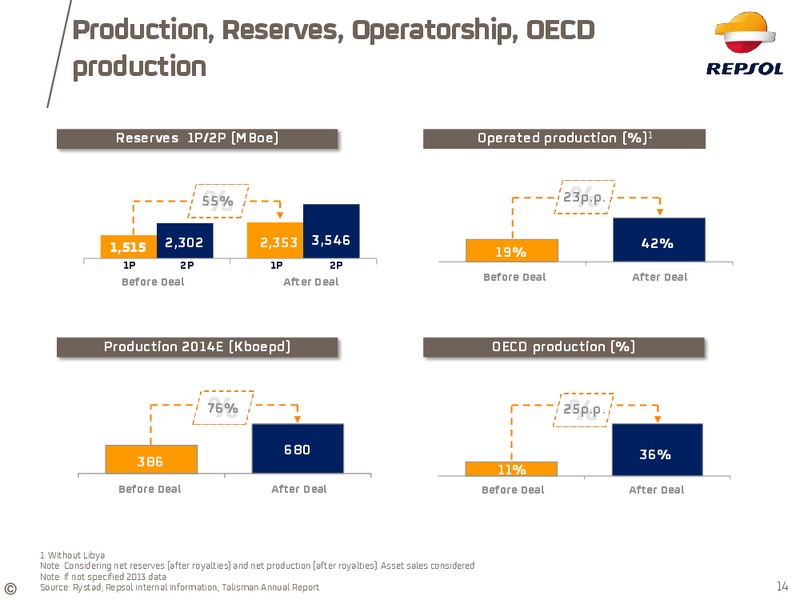
Production, Reserves, Operatorship, OECD production Reserves 1P/2P (MBoe) Operated production (%)1 55% 23p.p. 1,515 2,302 2,353 3,546 42% 19% 1P 2P 1P 2P Before Deal After Deal Before Deal After Deal Production 2014E…
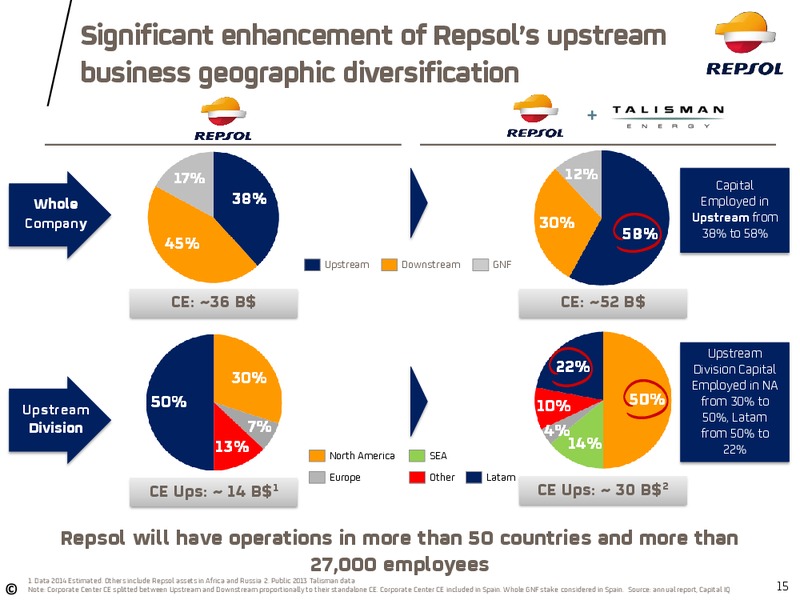
Significant enhancement of Repsols upstream business geographic diversification + Talisman Capital Whole Employed in Company Upstream from 38% to 58% Upstream Downstream GNF CE: 36 B CE: 52 B Upstream Division Capital…
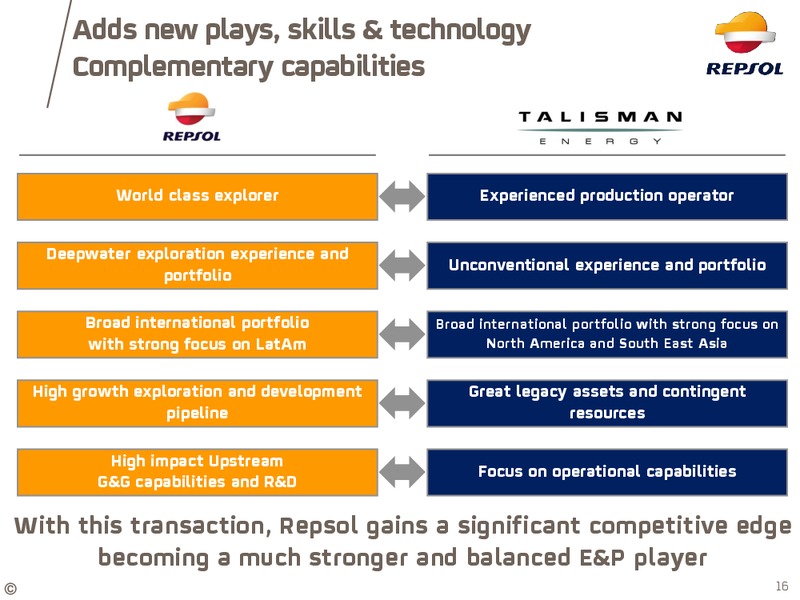
Adds new plays, skills & technology Complementary capabilities World class explorer Experienced production operator Deepwater exploration experience and Unconventional experience and portfolio portfolio Broad international…
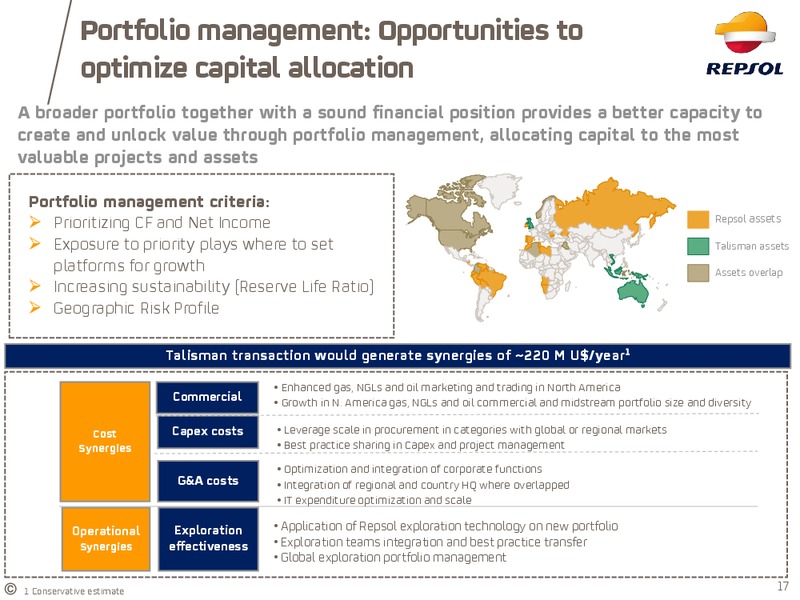
Portfolio management: Opportunities to optimize capital allocation A broader portfolio together with a sound financial position provides a better capacity to create and unlock value through portfolio management, allocating capital to…
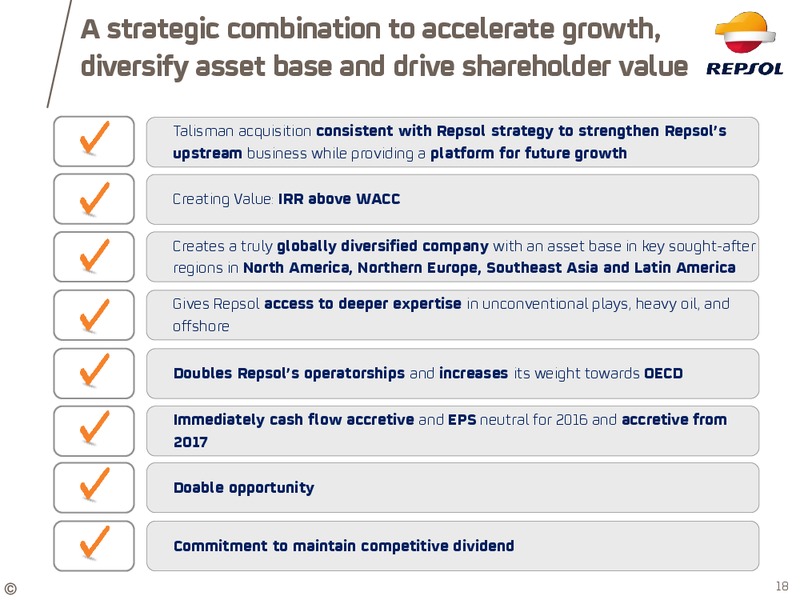
A strategic combination to accelerate growth, diversify asset base and drive shareholder value Talisman acquisition consistent with Repsol strategy to strengthen Repsols upstream business while providing a platform for future growth…
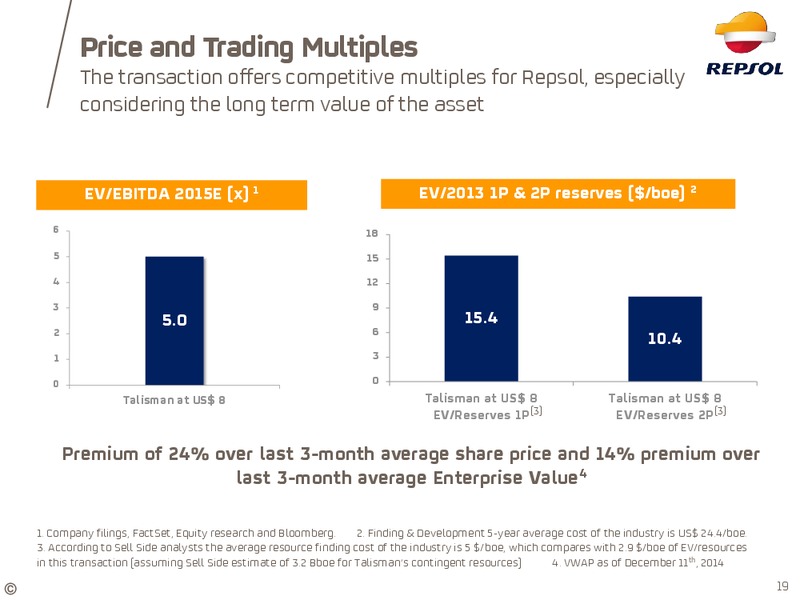
Price and Trading Multiples The transaction offers competitive multiples for Repsol, especially considering the long term value of the asset EV/EBITDA 2015E (x) 1 EV/2013 1P & 2P reserves (/boe) 2 6 18 5 15 4 12 3 9 5.0 15.4…
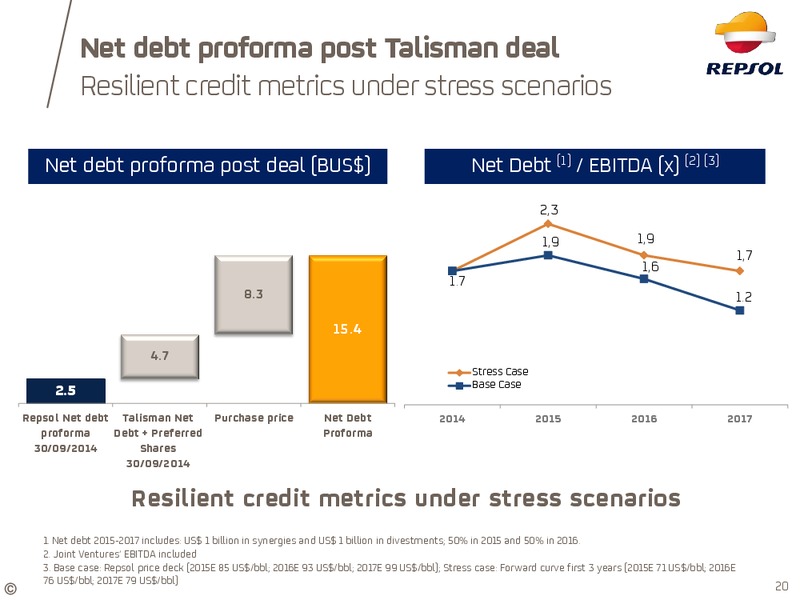
Net debt proforma post Talisman deal Resilient credit metrics under stress scenarios Net debt proforma post deal (BUS) Net Debt (1) / EBITDA (x) (2) (3) 2,3 1,9 1,9 1,7 1,6 1.7 8.3 1.2 15.4 4.7 Stress Case Base Case 2.5…
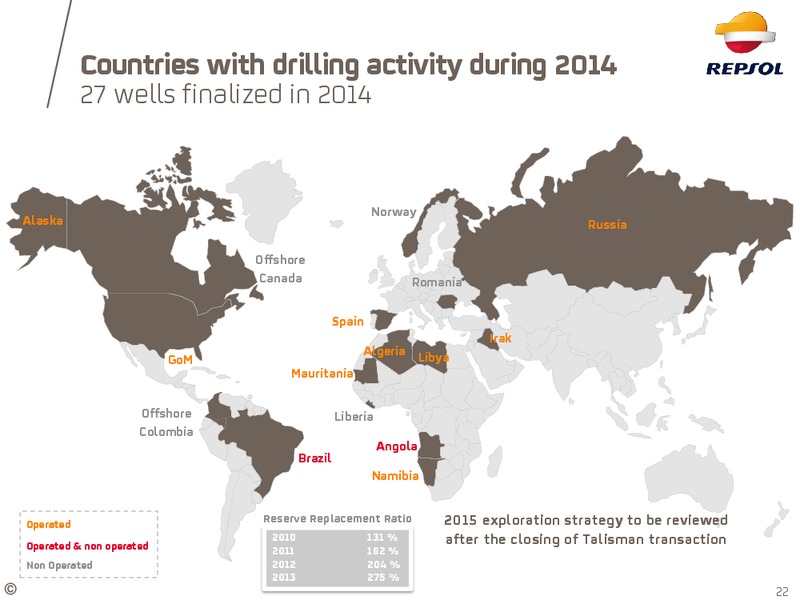
Countries with drilling activity during 2014 27 wells finalized in 2014 Norway Alaska Russia Offshore Canada Romania Spain Irak Algeria Libya GoM Mauritania Offshore Liberia Colombia Angola Brazil Namibia Operated…
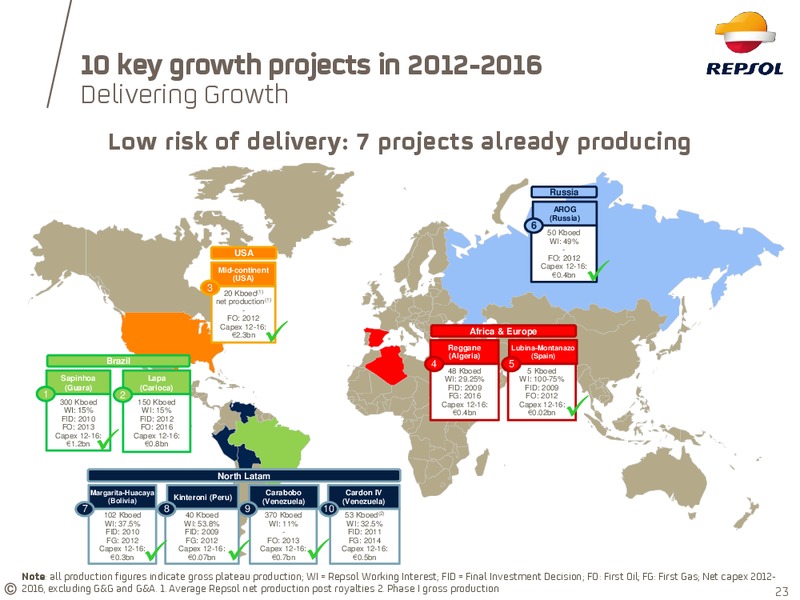
10 key growth projects in 2012-2016 Delivering Growth Low risk of delivery: 7 projects already producing Russia AROG (Russia) 6 50 Kboed WI: 49% - USA FO: 2012 Capex 12-16: Mid-continent 0.4bn (USA) 3 20 Kboed(1) net…
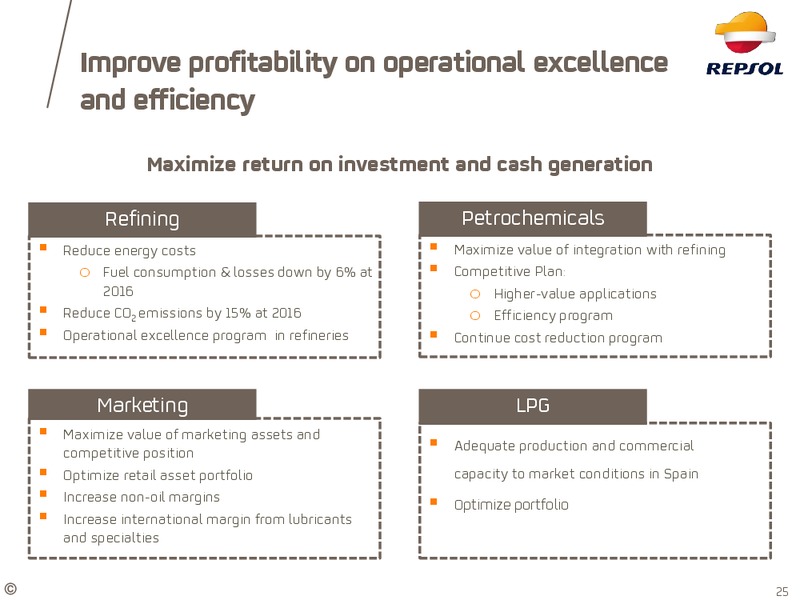
Improve profitability on operational excellence and efficiency Maximize return on investment and cash generation Refining Petrochemicals Reduce energy costs Maximize value of integration with refining o Fuel consumption & losses…
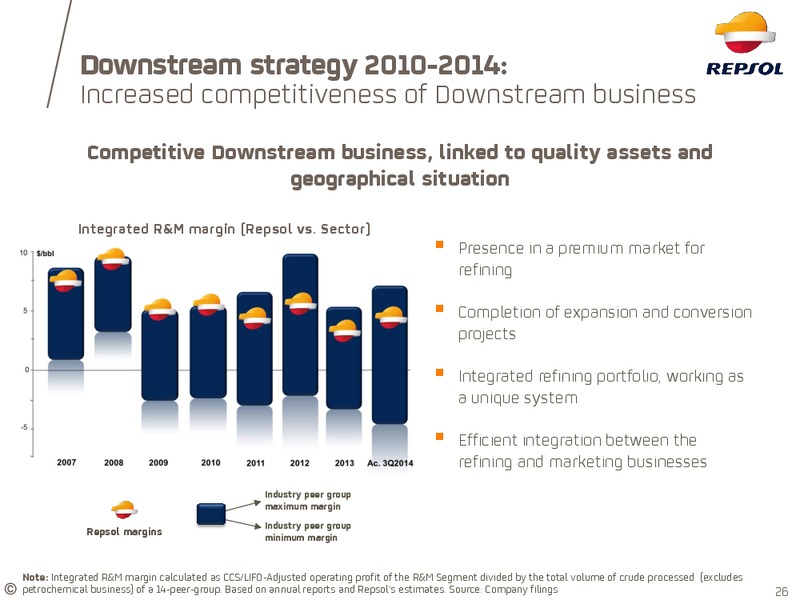
Downstream strategy 2010-2014: Increased competitiveness of Downstream business Competitive Downstream business, linked to quality assets and geographical situation Integrated R&M margin (Repsol vs. Sector) Presence in a premium…
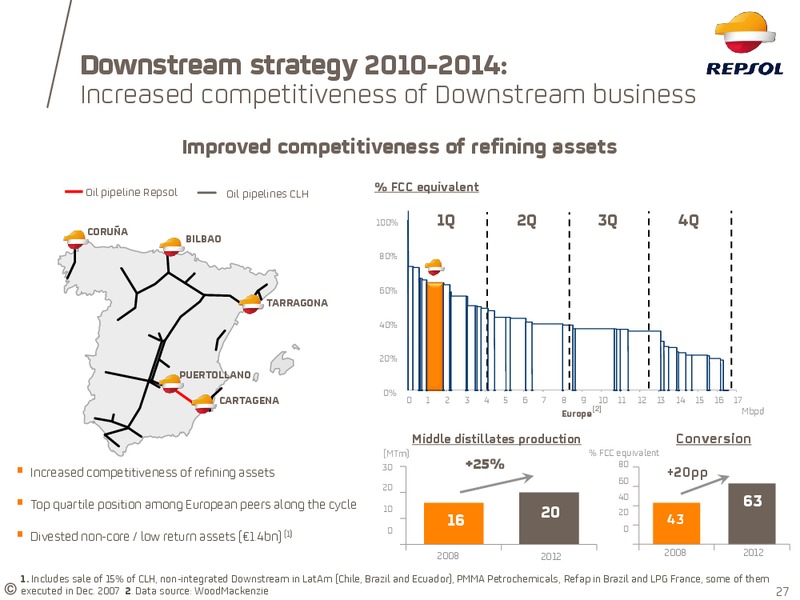
Downstream strategy 2010-2014: Increased competitiveness of Downstream business Improved competitiveness of refining assets Oil pipeline Repsol Oil pipelines CLH % FCC equivalent 100% 1Q 2Q 3Q 4Q CORUA BILBAO 80% 60%…
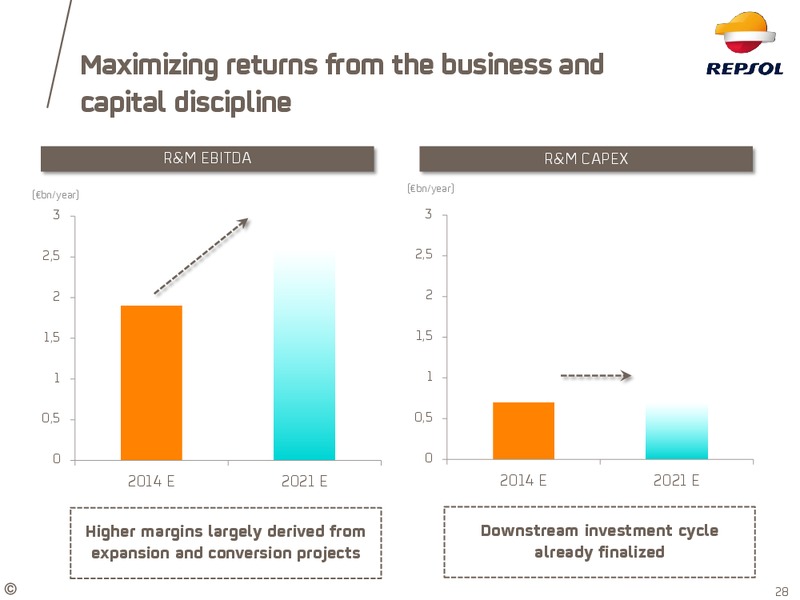
Maximizing returns from the business and capital discipline R&M EBITDA R&M CAPEX (bn/year) (bn/year) 3 3 2,5 2,5 2 2 1,5 1,5 1 1 0,5 0,5 0 0 2014 E 2021 E 2014 E 2021 E Higher margins largely derived from Downstream…
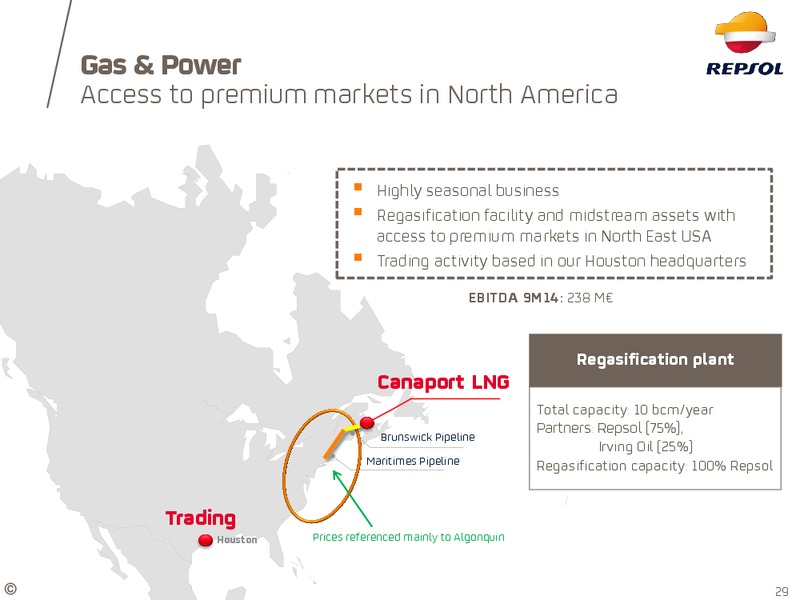
Gas & Power Access to premium markets in North America Highly seasonal business Regasification facility and midstream assets with access to premium markets in North East USA Trading activity based in our Houston headquarters…
Gas Natural Fenosa Our businesses strategy 6
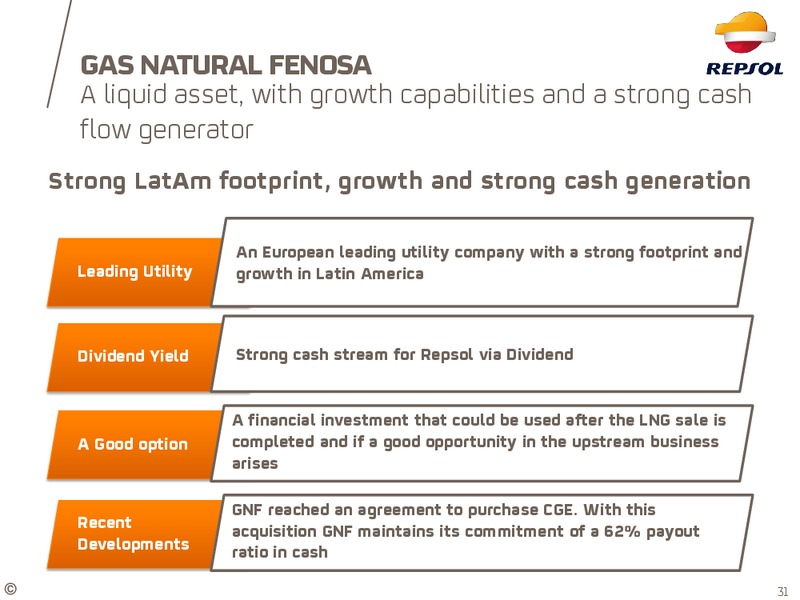
GAS NATURAL FENOSA A liquid asset, with growth capabilities and a strong cash flow generator Strong LatAm footprint, growth and strong cash generation An European leading utility company with a strong footprint and Leading Utility…
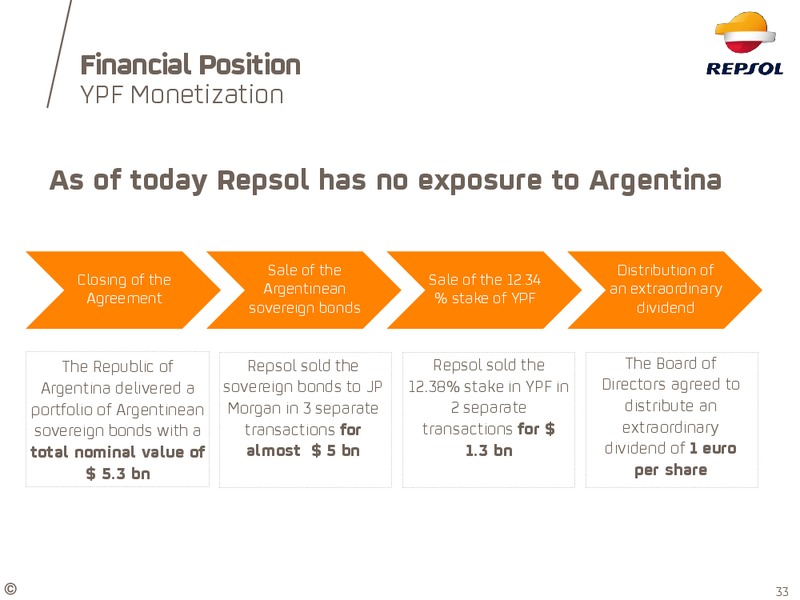
Financial Position YPF Monetization As of today Repsol has no exposure to Argentina Sale of the Distribution of Closing of the Sale of the 12.34 Argentinean an extraordinary Agreement % stake of YPF sovereign bonds dividend…
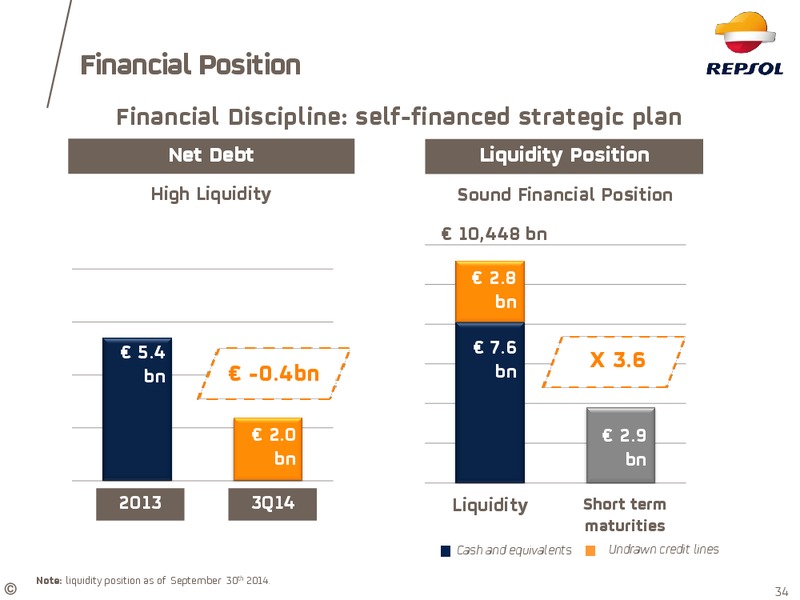
Financial Position Financial Discipline: self-financed strategic plan Net Debt Liquidity Position High Liquidity Sound Financial Position 10,448 bn 2.8 bn 5.4 7.6 X 3.6 bn -0.4bn bn 2.0 2.9 bn bn 2013 3Q14 Liquidity…
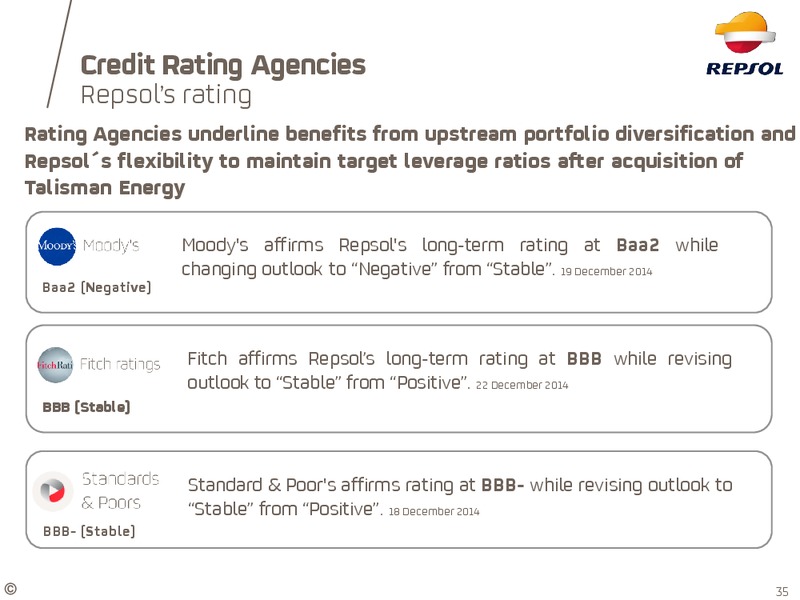
Credit Rating Agencies Repsols rating Rating Agencies underline benefits from upstream portfolio diversification and Repsols flexibility to maintain target leverage ratios after acquisition of Talisman Energy Moody's affirms…
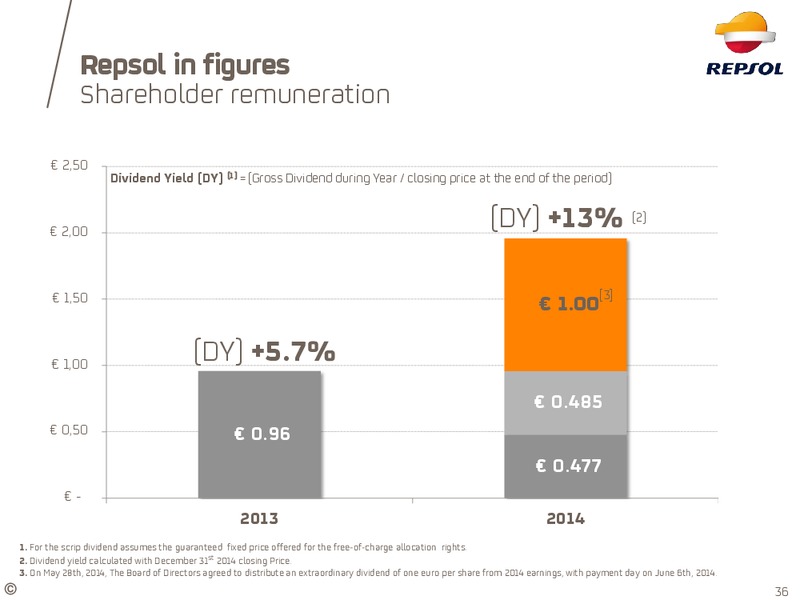
Repsol in figures Shareholder remuneration 2,50 Dividend Yield (DY) (1) = (Gross Dividend during Year / closing price at the end of the period) 2,00 (DY) +13% (2) 1,50 [3] 1.00 1,00 (DY) +5.7% 0.485 0,50 0.96 0.477 -…
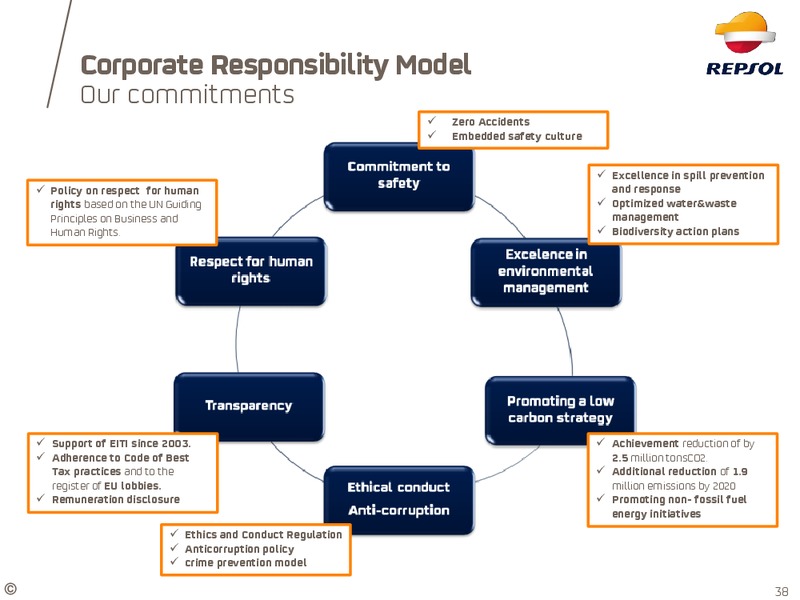
Corporate Responsibility Model Our commitments Zero Accidents Embedded safety culture Excellence in spill prevention Policy on respect for human and response rights based on the UN Guiding Optimized water&waste Principles on…
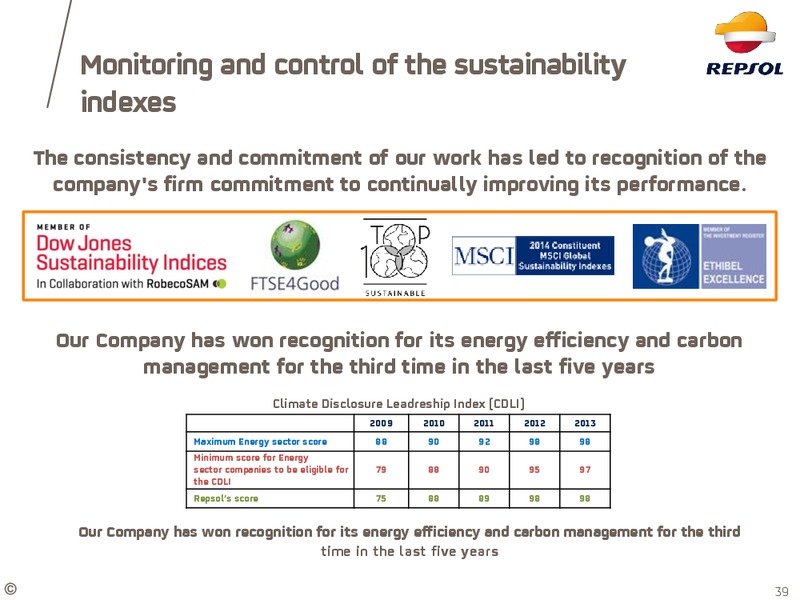
Monitoring and control of the sustainability indexes The consistency and commitment of our work has led to recognition of the company's firm commitment to continually improving its performance. Our Company has won recognition for…
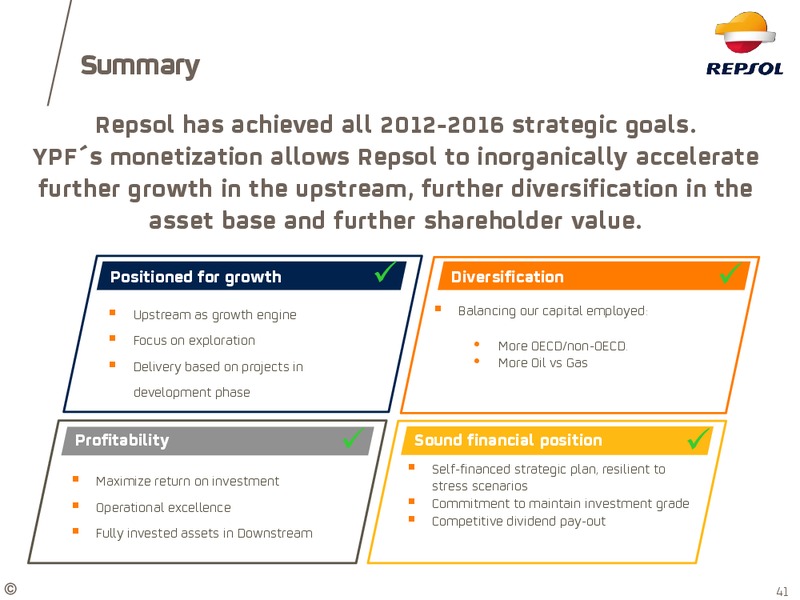
Summary Repsol has achieved all 2012-2016 strategic goals. YPFs monetization allows Repsol to inorganically accelerate further growth in the upstream, further diversification in the asset base and further shareholder value.…
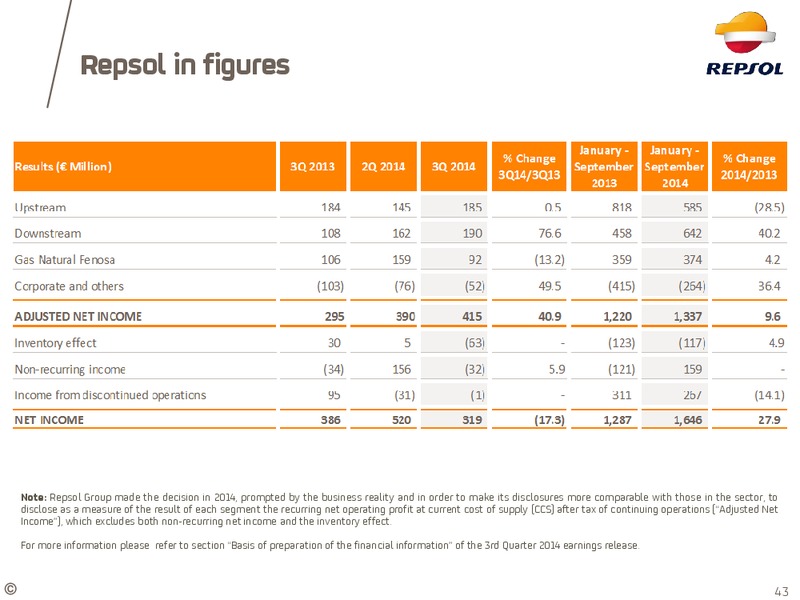
Repsol in figures Note: Repsol Group made the decision in 2014, prompted by the business reality and in order to make its disclosures more comparable with those in the sector, to disclose as a measure of the result of each segment…
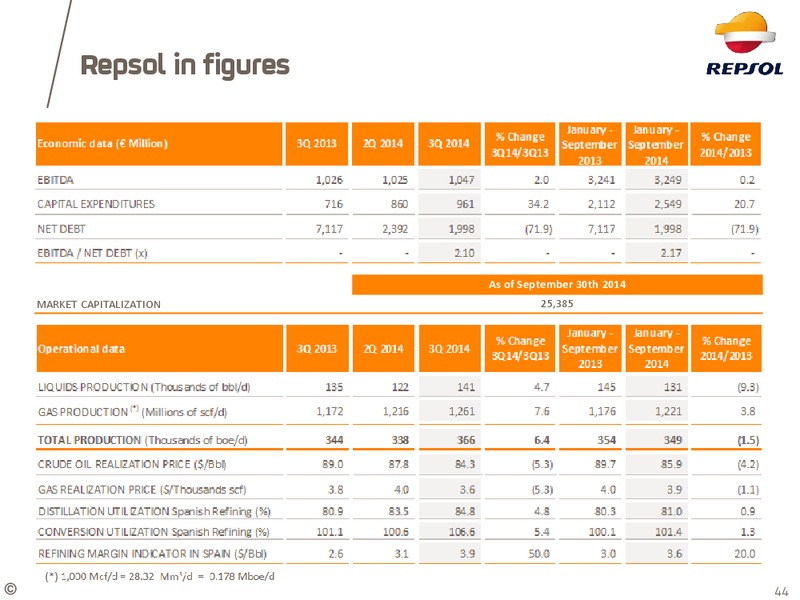
Repsol in figures January - January - % Change % Change Economic data ( Million) 3Q 2013 2Q 2014 3Q 2014 September September 3Q14/3Q13 2014/2013 2013 2014 EBITDA 1.026 1.025 1.047 2,0 3.241 3.249 0,2 CAPITAL EXPENDITURES 716 860…
Investor Update Strategic Plan 2012-2016 Growing from our strengths Repsol. Investor Relations January 2015
 Loading...