PROCESSING LEADERSHIP Leader in Subsea Processing 85% of all existing processing systems use OneSubseas single & multiphase pumping technology Unique, field-proven pumps, meters & state-of- the-art subsea processing systems for…
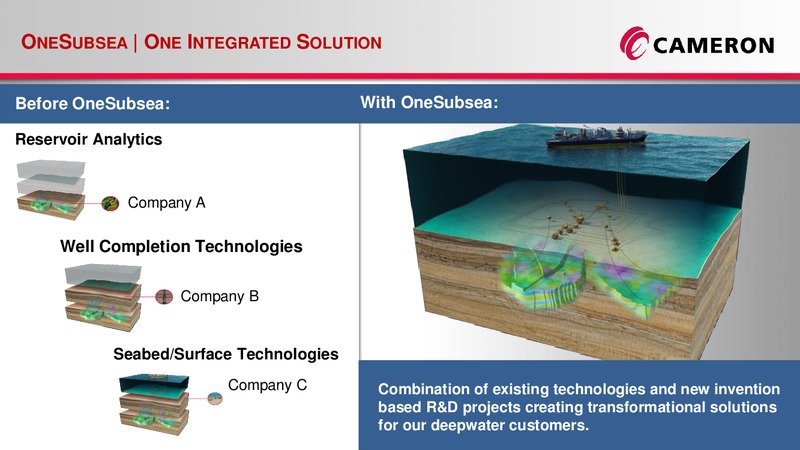
ONESUBSEA ONE INTEGRATED SOLUTION Before OneSubsea: With OneSubsea: Reservoir Analytics Company A Well Completion Technologies Company B Seabed/Surface Technologies Company C Combination of existing technologies and new…
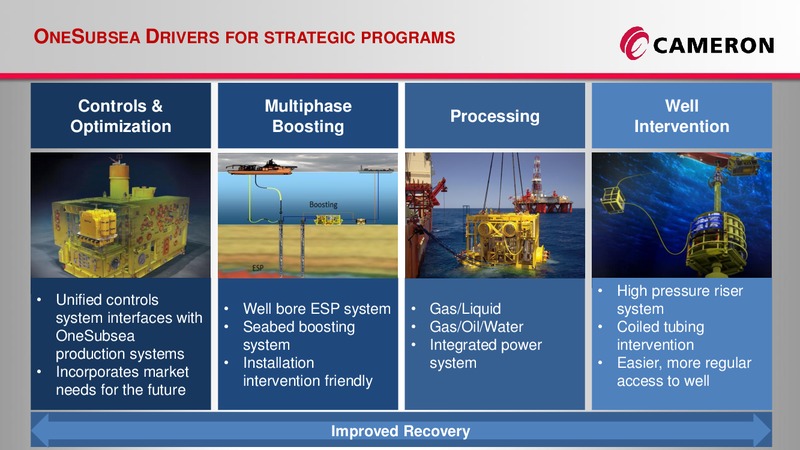
ONESUBSEA DRIVERS FOR STRATEGIC PROGRAMS Controls & Multiphase Well Processing Optimization Boosting Intervention High pressure riser Unified controls Well bore ESP system Gas/Liquid system system interfaces with Seabed…
Surface TM Upstream to Downstream, Onshore to Offshore, Were There.TM
SURFACE SYSTEMS OVERVIEW Surface: 2013 Surface Revenue % Breakdown Aftermarket 40% Global leader in wellhead market share New Most profitable Cameron division Equipment 60% Record backlog entering 2014 Surface Bookings (…
SURFACE WELLHEAD OVERVIEW Wellhead Alliances with major oil & gas customers provides growth drivers Extensive service network with state-of-the-art factories provides customer support Global share & price leader
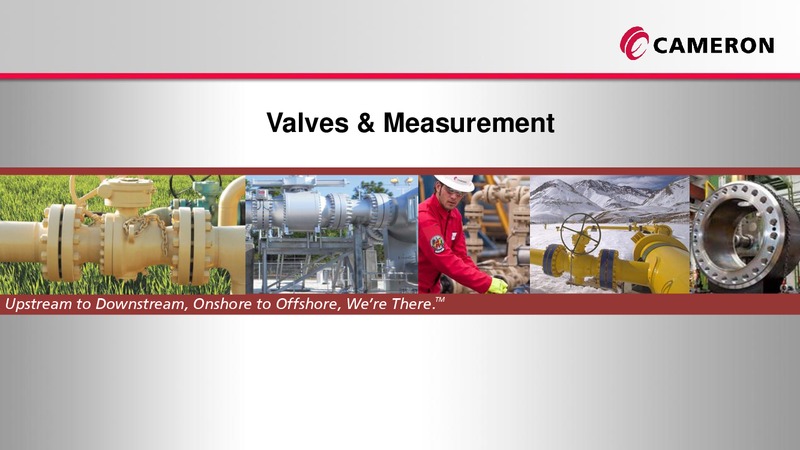
VALVES & MEASUREMENT OVERVIEW Worldwide Leading Oil & Division % of Total 2013 Gas Valve Company Valve & Measurement Revenue Measurement 11% Distributed 28% EPV Order rates near historical highs 61% EBITDA margins…
VALVE TECHNOLOGY CONNECTS CAMERON
Process Systems TM Upstream to Downstream, Onshore to Offshore, Were There.TM
PROCESS SYSTEMS Deepwater/Offshore Unconventionals Midstream Robust FPSO Oil & water separation at Gas/liquids opportunities wellhead Gathering & C02 separation systems High conditioning standardization Fractioning MEG…
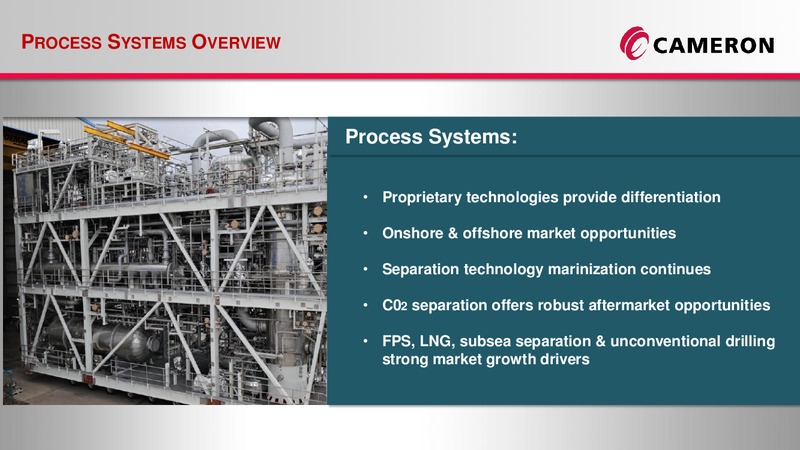
PROCESS SYSTEMS OVERVIEW Process Systems: Proprietary technologies provide differentiation Onshore & offshore market opportunities Separation technology marinization continues C02 separation offers robust aftermarket…
Financials Upstream to Downstream, Onshore to Offshore, Were There.TM
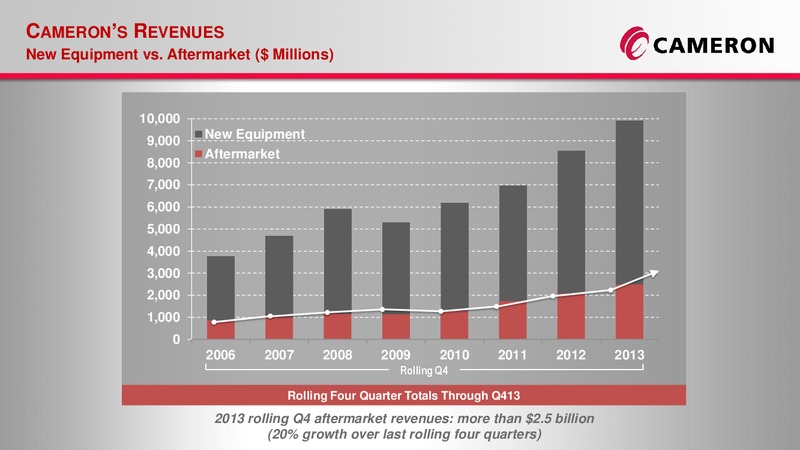
CAMERONS REVENUES New Equipment vs. Aftermarket ( Millions) 10,000 New Equipment 9,000 Aftermarket 8,000 7,000 6,000 5,000 4,000 3,000 2,000 1,000 0 2006 2007 2008 2009 2010 2011 2012 2013 Rolling Q4 Rolling Four…
CAMERONS BACKLOG (Millions End of Q413) 12,000 11,514 10,000 8,597 8,000 5,969 6,000 5,607 5,190 4,817 4,268 4,000 2,000 0 2007 2008 2009 2010 2011 2012 2013 Backlog up 2.7 x 2007; provides revenue visibility
USES OF FUNDS ( Millions) Capital Expenditure Acquisitions Share Repurchases 2000 1500 1000 500 0 2006 2007 2008 2009 2010 2011 2012 2013 Note: 2009 acquisitions does not include NATCO as that was a stock deal…
CAMERONS LONG TERM GROWTH DRIVERS Total Rig Unconventional Midstream OneSubsea Package Valve Alliances Aftermarket Resources Build-Out Solutions Global Scope
 Loading...