GROUP CORE NON-CORE CONCLUSION Good progress with tangible results Core business performed well with PBT of 3.8bn and RoE of 11% Investment Bank re-positioning on track Good start to Barclays Non-Core rundown Costs…
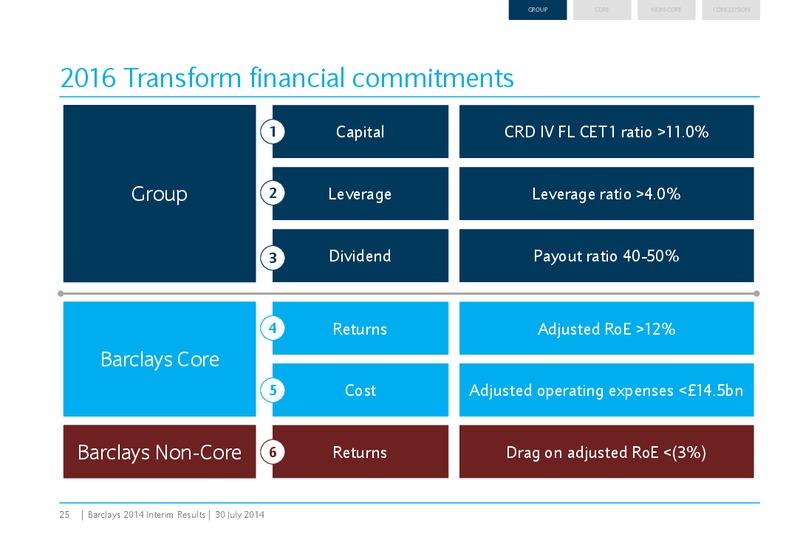
GROUP CORE NON-CORE CONCLUSION 2016 Transform financial commitments 1 Capital CRD IV FL CET1 ratio 11.0% Group 2 Leverage Leverage ratio 4.0% 3 Dividend Payout ratio 40-50% 4 Returns Adjusted RoE 12% Barclays Core 5 Cost…
Tushar Morzaria Barclays Group Finance Director
GROUP CORE NON-CORE CONCLUSION Good Core performance with Non-Core reductions on track Core business producing Core RoE of 11% (incl. CTA) double-digit returns RoTE of 13.5% Group CET1 ratio increased to 9.9% Capital and…
GROUP CORE NON-CORE CONCLUSION Summary Group financials Six months ended June (m) 2013 2014 Financial performance Income 15,071 13,332 Adjusted profit fell by 7% to 3.3bn, driven largely by a 12% Impairment (1,631) (1,086)…
GROUP CORE NON-CORE CONCLUSION Strengthening key financial metrics As at: Dec-13 Jun-14 Highlights CET1 increased to 9.9%, tracking towards 2016 target of 11% Fully-loaded CET1 ratio1 9.1% 9.9% Capital / PRA leverage ratio…
GROUP CORE NON-CORE CONCLUSION Core business performing well and as expected Highlights Six months ended June (m) 2013 2014 Financial performance Income 13,597 12,674 Good performance in Core business, despite weakness in…
GROUP CORE NON-CORE CONCLUSION Core customer assets and NIM growth driving NII Core income Six months ended June (m) 2013 2014 Steady performance in PCB and Barclaycard Personal and Corporate Banking 4,305 4,361 PCB grew NII 7%…
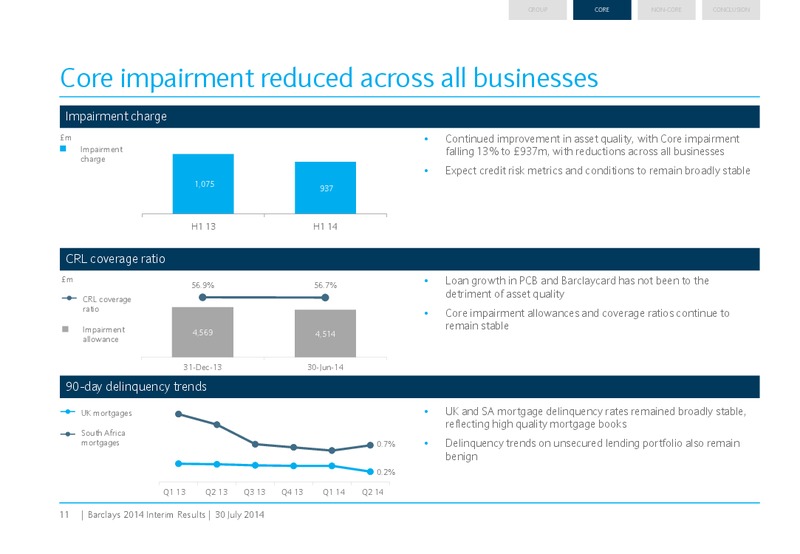
GROUP CORE NON-CORE CONCLUSION Core impairment reduced across all businesses Impairment charge m Continued improvement in asset quality, with Core impairment Impairment falling 13% to 937m, with reductions across all businesses…
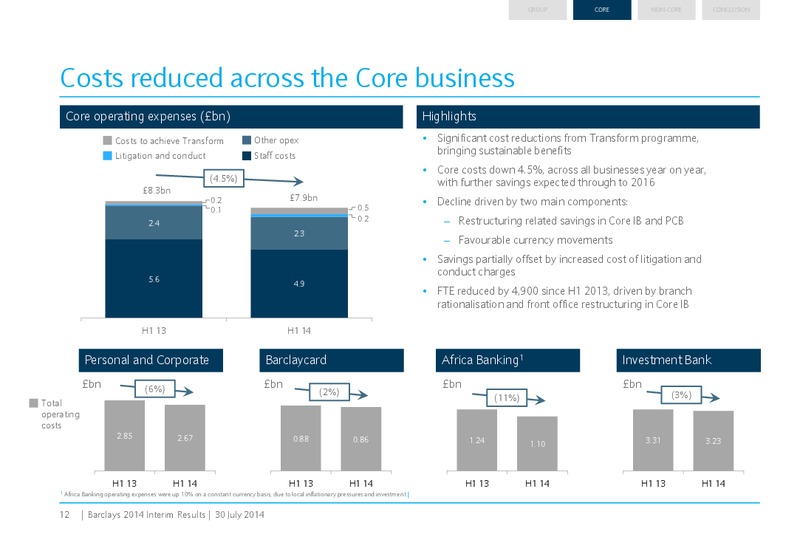
GROUP CORE NON-CORE CONCLUSION Costs reduced across the Core business Core operating expenses (bn) Highlights Costs to achieve Transform Other opex Significant cost reductions from Transform programme, Litigation and conduct…
GROUP CORE NON-CORE CONCLUSION Personal and Corporate Banking good progress in H1 Six months ended June (m) 2013 2014 Financial performance Income 4,305 4,361 Largest business by PBT made good progress in H1 Impairment (299)…
GROUP CORE NON-CORE CONCLUSION Barclaycard growth across all businesses and geographies Six months ended June (m) 2013 2014 Financial performance Income 2,019 2,124 Encouraging growth across all businesses and geographies with…
GROUP CORE NON-CORE CONCLUSION Africa Banking income growth and good credit performance Constant Financial performance Six months ended June (m) 2013 2014 currency PBT on a constant currency basis increased by 13%, Income 2,055…
GROUP CORE NON-CORE CONCLUSION Investment Bank early signs of progress Six months ended June (m) 2013 2014 Q2 13 Q2 14 GBP change USD change2 - Banking 1,278 1,343 629 727 +16% +28% - Markets 3,699 2,892 1,678 1,403 (16%) (8%) -…
GROUP CORE NON-CORE CONCLUSION Barclays Non-Core good start to RWA reduction Six months ended June (m) 2013 2014 Highlights Income 1,474 658 Attributable loss before tax reduced by 25% following significant declines in income,…
GROUP CORE NON-CORE CONCLUSION Barclays Non-Core income and cost on track H114 vs H113 Non-Core adjusted income splits (m) Businesses - retail Businesses - non-retail Non-retail business reduction of 185m due to winding down and…
GROUP CORE NON-CORE CONCLUSION Barclays Non-Core encouraging progress on RWA reductions RWA reduction (bn) Highlights Businesses Securities and Loans RWA reductions concentrated in Securities and Loans Derivatives Operational Risk…
GROUP CORE NON-CORE CONCLUSION Costs reduced across all businesses Operating expenses progress (m) H113 operating H114 operating CTA spend Net decrease YoY Savings initiatives from CTA expenses expenses to date 1,700 FTE…
GROUP CORE NON-CORE CONCLUSION Progressive strengthening of capital and leverage ratios Fully loaded CRD IV CET1 ratio (%)1 Continue to show good progress on our CRD IV CET1 ratio and estimated PRA leverage ratio towards 2016…
GROUP CORE NON-CORE CONCLUSION TNAV underlying profit growth offset by FX impact and PPI Tangible net asset value Highlights TNAV reduced by 4p over the past six months to 279p Excluding Excluding the movement in the currency…
GROUP CORE NON-CORE CONCLUSION Good Core performance with Non-Core reductions on track Core business producing double digit returns Capital and leverage ratios continuing to improve steadily Non-Core reductions on track…
Antony Jenkins Barclays Group Chief Executive
GROUP CORE NON-CORE CONCLUSION 2016 Transform financial commitments 1 Capital CRD IV FL CET1 ratio 11.0% Group 2 Leverage Leverage ratio 4.0% 3 Dividend Payout ratio 40-50% 4 Returns Adjusted RoE 12% Barclays Core 5 Cost…
Appendix
Reorganising to a simpler, focused and balanced structure Barclays Group H1 2014 Personal & Africa Investment Barclays Non-Core Barclaycard Corporate Banking Banking Bank (BNC) PBT 1,468m PBT 764m PBT 484m PBT 1,058m LBT 491m RoE…
Adjusted Return on Average Equity (RoE) RoE Six months ended June 2013 RoE Six months ended June 2014 10.3% Personal and Corporate Banking 12.1% 16.8% Barclaycard 18.9% 9.4% Africa Banking 9.6% 15.7% Investment Bank 5.7%…
Impact of Costs to achieve Transform Six months ended June 2014 Costs to Return on Profit Cost : income achieve average Adjusted performance measures by business Transform before tax1 equity1,2 ratio1 (m) (%) (m) (%) Personal…
Net interest margins and balances1 Six months ended June 2013 Six months ended June 2014 Average Average Net interest Net interest Net interest Net interest customer customer income margin income margin assets assets (m) (%) (m)…
Group Cost targets Group cost guidance1 (bn) Core cost targets1 (bn) Original Group cost target and interim guidance Revised Group cost guidance Core cost targets 19 18.7 c.(9%) c.(13%) 19 18 18 c.(10%) c.17 17 c.16.3 17…
Investment Bank quarterly progression Q2 on Q2 change in business mix Banking (m) (m) +16% 727 663 649 629 639 616 Inv. 568 Banking 423 488 Inv. Investment Lending Banking Banking Banking fees 141 661 727m Lending Lending 66…
Broad contribution by diverse businesses Income Profit Before Tax Six months ended June (m) 2013 2014 2013 2014 Personal and Corporate Banking 4,305 4,361 1,197 1,468 Barclaycard 2,019 2,124 616 764 Africa Banking 2,055 1,773 547…
RWAs by Business (bn) December 2013 June 2014 Personal and Corporate Banking 118.3 117.9 Barclaycard 35.7 37.7 Africa Banking 38.0 36.5 Investment Bank 126.0 125.5 Head Office 14.6 6.0 Total Core 332.6 323.5 Barclays…
Continued progress on the transition towards target end-state capital structure Evolution of capital structure Fully loaded CRD IV capital position FLCRD IV CET1 ratio at 9.9% on track to meet target of 11% in 2016. The ratio was well…
Plan incorporates the progressive implementation of CET1 requirements Regulatory targets, excluding internal buffer Key assumptions in this illustration CRD IV minimum CET1 requirement CET1 minimum requirements per PRA implementation of…
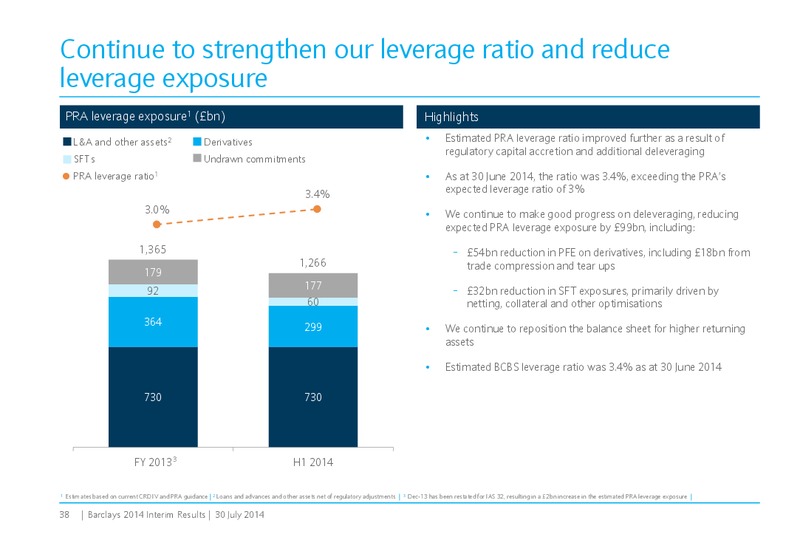
Continue to strengthen our leverage ratio and reduce leverage exposure PRA leverage exposure1 (bn) Highlights L&A and other assets2 Derivatives Estimated PRA leverage ratio improved further as a result of regulatory capital accretion…
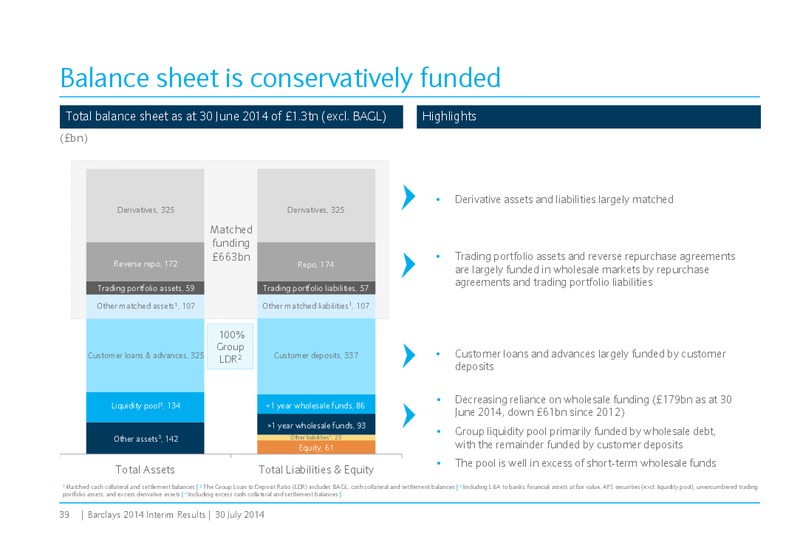
Balance sheet is conservatively funded Total balance sheet as at 30 June 2014 of 1.3tn (excl. BAGL) Highlights (bn) Derivative assets and liabilities largely matched Derivatives, 325 Derivatives, 325 Matched funding 663bn…
Capital resources1 (m) 31 December 2013 30 June 2014 Shareholders' equity (excluding non controlling interests) per the balance sheet 55,385 58,068 Less: other equity instruments (recognised as AT1 capital) (2,063) (4,326) Adjustment…
Estimated leverage exposure PRA Leverage exposure BCBS 270 Leverage exposure (bn) 31 December 2013 30 June 2014 30 June 2014 IFRS derivative financial instruments 355 333 333 Mark-to-market and margin netting adjustments for…
 Loading...