Earnings Presentation Fourth Quarter and Full Year 2013 5 March 2014 12:00 noon UK time
Forward-looking statements Certain statements made in this announcement may include forward-looking statements. These statements may be identified by the use of words like anticipate, believe, could, estimate, expect, forecast, intend,…
Q4 2013 summary HIGHLIGHTS FINANCIAL OPERATIONAL ORDER IN-TAKE Underlying 15% Adjusted Global vessel Record 11.8bn results in line EBITDA margin, utilisation of backlog with including further 80% maintained, of expectations…
Operational highlights AFGOM APME BRAZIL NSC CLOV progressed AOM Gorgon Heavy Lift Guar-Lula NE Life-of-Field well; successful and Tie-ins project achieved activities installation of two prepared for its key milestones, continued…
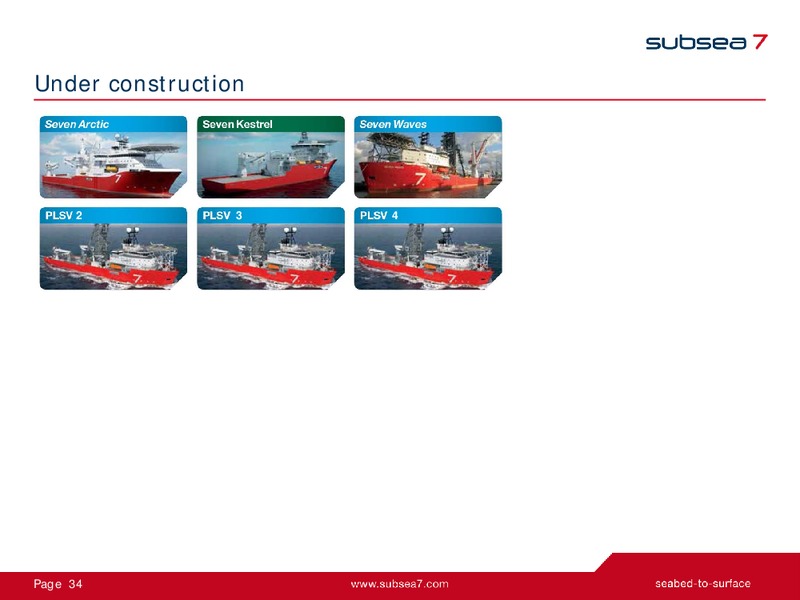
Vessels under construction Ship Principal Details Mission Equipment Operational Seven Waves 550t Tiltable Lay System 2nd Quarter 2014 149.5m x 29.9m x 13m 400t Crane Accommodation for 120 2 x Work class ROV Service Speed 13 knots…
Income statement key highlights In millions, unless otherwise indicated Three months ended Twelve months ended 31 Dec 13 31 Dec 12 31 Dec 13 31 Dec 12 Revenue 1,586 1,611 6,297 6,297 Net operating income (NOI) 109 180 573 808…
Territory performance Q4 2013 AFGOM Brazil 673m 206m 89m Revenue NOI Revenue NOI (13m) APME NSC 544m 160m 63m 9m Revenue NOI Revenue NOI Note: excludes contribution from Corporate segment Page 8
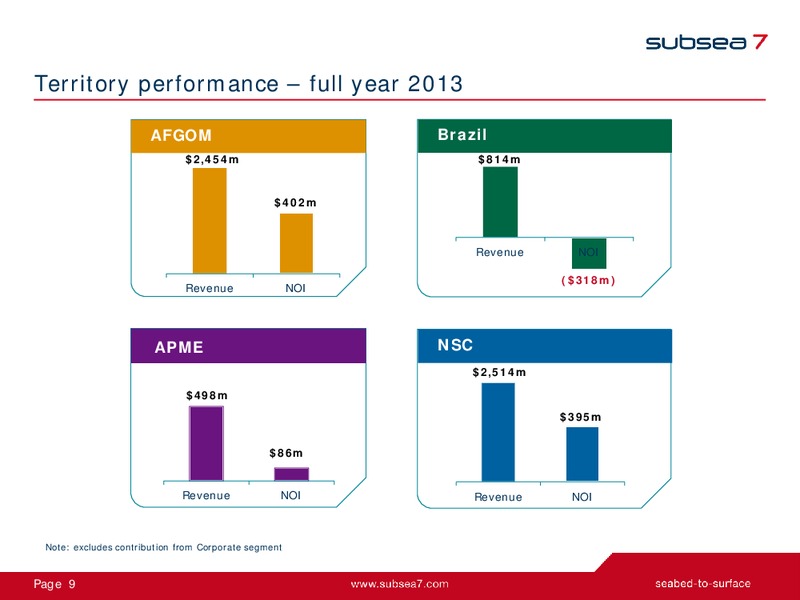
Territory performance full year 2013 AFGOM Brazil 2,454m 814m 402m Revenue NOI (318m) Revenue NOI APME NSC 2,514m 498m 395m 86m Revenue NOI Revenue NOI Note: excludes contribution from Corporate segment…
Income statement supplementary details Three months ended Twelve months ended In millions 31 Dec 13 31 Dec 12 31 Dec 13 31 Dec 12 Administrative expenses (81) (106) (296) (373) Share of net income of associates 1 44 127 86 and…
Overview of 2013 cash flow millions Cash and cash equivalents at 31 Dec 2012 1,288 Net cash generated from operating Includes decrease in net operating 981 activities assets of 330m Includes capital expenditure of 739m Net cash…
Summary balance sheet 31 Dec 31 Dec 31 Dec 31 Dec In millions 2013 2012 In millions 2013 2012 Assets Equity & Liabilities Non-current assets Total Equity 6,612 6,368 Goodwill 2,585 2,575 Non-current liabilities Property, plant and…
2014 financial guidance Group revenue expected to increase from 2013 level Adjusted EBITDA expected to increase moderately from that achieved in 2013 after adding back the 355 million full life loss provision recognised on the…
2014 financial guidance (continued) Contribution from Seaway Heavy Lifting joint venture expected to decline, due to a multi-month in-shipyard life extension of the Stanislav Yudin; SapuraAcergys contribution also expected to…
Vessel new build programme: realised and projected capex1 millions 557 570 600 Total (E) - 1.9 billion 190 Up to 31 Dec 2013 2014 E 2015 E 2016 E 2 Notes: 1 Comprises four PLSVs being constructed for long-term…
Market overview and outlook Delays in project awards remain a feature of the industry, driven by clients capex constraints AFGOM Timing of future market awards uncertain but SURF tendering activity is good in West and East Africa…
Market overview and outlook (continued) Brazil Benefits of PLSV renewals to be fully reflected from H2 2014 onwards NSC Continuing strong demand for Life-of-Field work and our Bundle offering Market awards for some large SURF…
Summary 2013 was another year of good performance for Subsea 7, marred by one challenging project Q4 2013 saw solid results despite the additional 49 million full-life loss provision on Guar-Lula NE project Order intake expected to…
Appendix Page 19
Major project progression Continuing projects 100m between 5% and 95% complete as at 31 Dec 2013 excl. long-term PLSV contracts and Life-of-Field day-rate contracts Line 60 (Mexico) West Franklin (North Sea) Laggan Tormore (North…
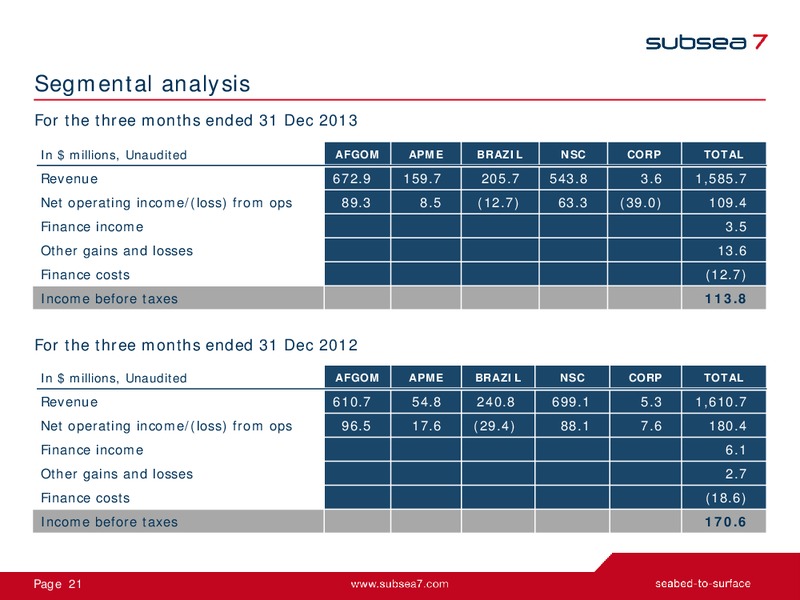
Segmental analysis For the three months ended 31 Dec 2013 In millions, Unaudited AFGOM APME BRAZIL NSC CORP TOTAL Revenue 672.9 159.7 205.7 543.8 3.6 1,585.7 Net operating income/(loss) from ops 89.3 8.5 (12.7) 63.3 (39.0) 109.4 Finance…
Adjusted EBITDA Adjusted earnings before interest, taxation, depreciation and amortisation (Adjusted EBITDA) is a non-IFRS measure that represents net income before additional specific items that are considered to impact the comparison…
Reconciliation of Adjusted EBITDA Net operating income to Adjusted EBITDA Three Months Ended Three Months Ended For the period (in millions) 31 Dec 2013 Unaudited 31 Dec 2012 Unaudited Net operating income 109 180 Depreciation,…
Gorgon Heavy Lift and Tie-ins, and Umbilicals - Australia Located 130km off the northwest coast of Western Australia The Gorgon project is one of the world's largest natural gas projects Heaviest and deepest subsea lifts in the…
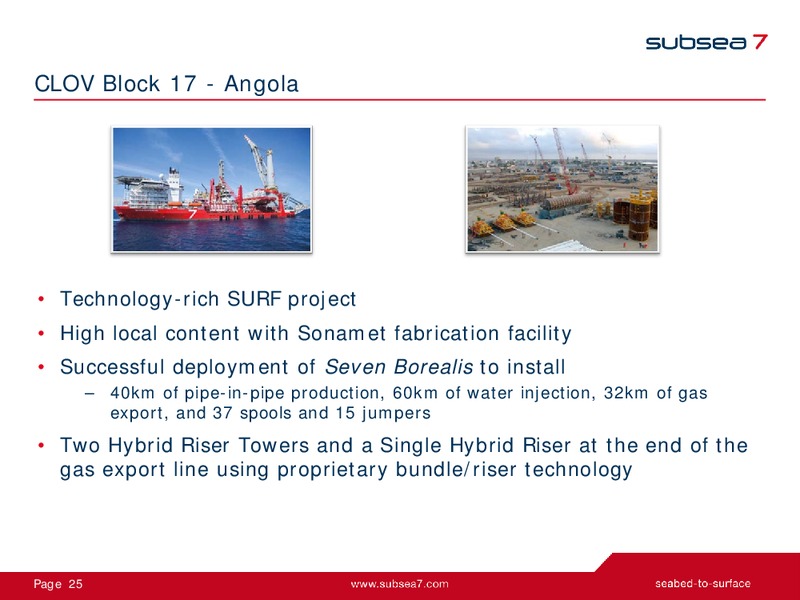
CLOV Block 17 - Angola Technology-rich SURF project High local content with Sonamet fabrication facility Successful deployment of Seven Borealis to install 40km of pipe-in-pipe production, 60km of water injection, 32km of gas…
Aasta Hansteen gas field - Norway Technology-rich SURF project 1200m water depth, deepest in North Sea 300km off northern Norway, harsh environment First SCRs (x4) in the Norwegian Sea, manufactured at Vigra spool base First…
 Loading...