Non-GAAP Measures Distributable Cash Flow, Adjusted EBITDA, and Net Operating Margin are not measures of performance calculated in accordance with GAAP, and should not be considered separately from or as a substitute for net income,…
Key Investment Considerations HIGH-QUALITY PROVEN GROWTH S U B S TAN T I AL STRONG DIVERSIFIED &CUSTOMER GROWTH FINANCIAL ASSETS SATISFACTION OPPORTUNITIES PROFILE Quarterly Distribution Growth of 244% 0.80 Since IPO 0.60…
MarkWest Assets: Expansion & Diversification Utica Developing a leading position in the southern core of the Utica Shale with 585 MMcf/d of processing Northeast capacity. Growing to nearly 1 Bcf/d of processing capacity and 138,000…
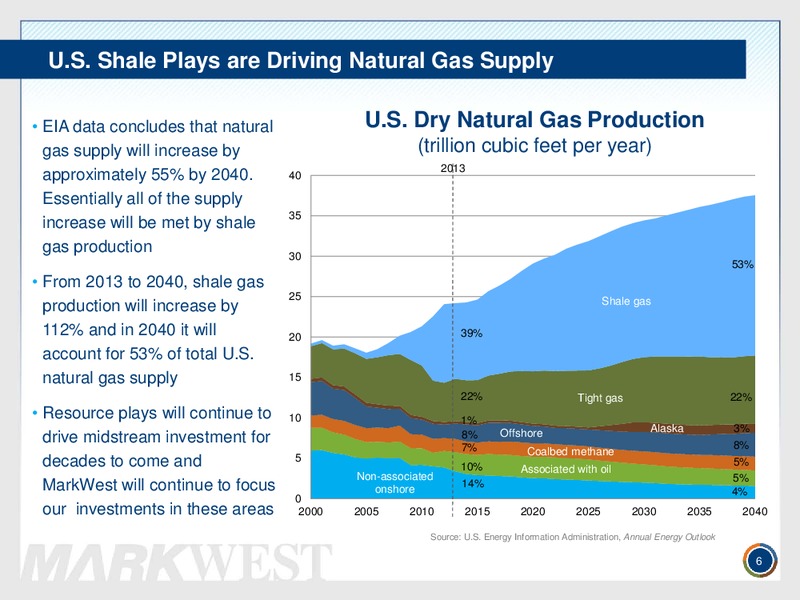
U.S. Shale Plays are Driving Natural Gas Supply EIA data concludes that natural U.S. Dry Natural Gas Production gas supply will increase by (trillion cubic feet per year) 2013 approximately 55% by 2040. 40 Essentially all of the…
Marcellus & Utica: Driving U.S. Gas Production Growth Wellhead Gas Production (before flaring and NGL extraction) 65 Rest of U.S. Marcellus & Utica 16 64 15 14 63 Billion cubic feet per day Billion cubic feet per day 13…
Commitment to Resource Plays Capital investments and acquisitions in resource plays since 2008 Net Capital Expenditures Acquisitions Organic Growth ( in thousands) 2,000 1,000 - Base Production (Conventional / Tight…
Growth Driven by Customer Satisfaction MarkWest has received the top rating in three of the last four EnergyPoint Research surveys 9 9
Significant Growth Requires a Highly Skilled Team and a culture focused on high quality customer service 1,800 1,600 1,537 1,400 Number of employees 1,200 1,000 809% 1,099 growth increase 870 800 over 10 years 669…
Rapid Plant & Processing Capacity Growth MarkWest anticipates completing 10 processing plants this year, increasing the Partnerships total processing capacity to approximately 6 Bcf/d 7 Northeast Southwest Marcellus Utica 6 48…
What a Difference a Year Makes In 2013 We 2014 & Beyond Completed 8 new rich-gas +17 new projects, 4.7 Bcf/d processing facilities in the total processing capacity in the Northeast, adding over Marcellus and Utica Shales 1.4 Bcf/d…
17 Plants Completed in the Last Two Years Sarsen I Bluestone I Langley III Arapahoe III Carthage East Mobley I Sherwood I Cadiz Refrigeration I Mobley II Sherwood II Majorsville III Cadiz I Majorsville V Mobley III…
2014 Forecasted Operating Income by Segment Marcellus Utica* 47% 13% Northeast Southwest 9% 31% *Utica Operating Income Percentage is Gross of Non-Controlling Interest 14
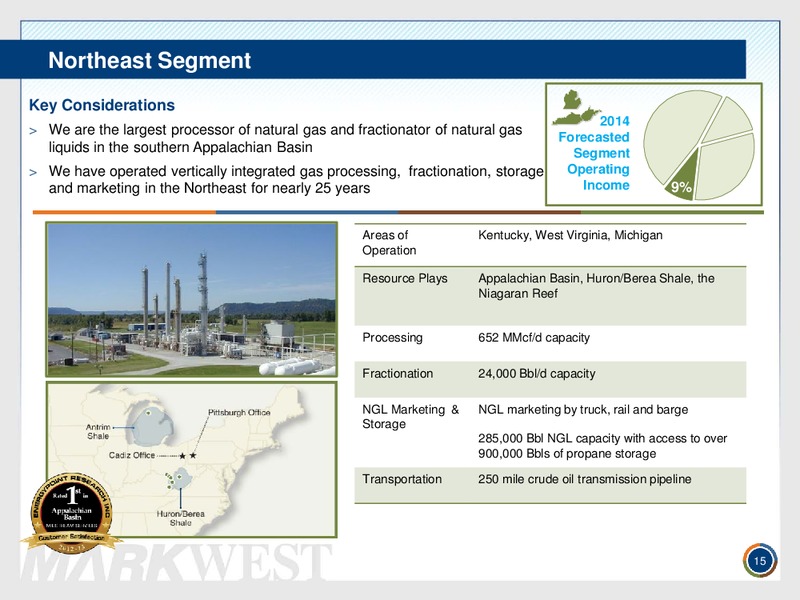
Northeast Segment Key Considerations 2014 We are the largest processor of natural gas and fractionator of natural gas Forecasted liquids in the southern Appalachian Basin Segment We have operated vertically integrated gas processing,…
Southwest Segment Key Considerations We maintain best-in-class midstream services in the Granite Wash, 2014 Haynesville, Woodford and Eagle Ford Shales Forecasted In 2013, we expanded in the Granite Wash through a 225 million…
Marcellus Segment Key Considerations 2014 We are the largest processor of natural gas and fractionator of natural gas Forecasted 47% liquids in the Marcellus Shale Segment Operate fully integrated gathering, processing,…
MarkWest Marcellus: Current Processing Capacity of 2.2 Bcf/d Growing to over 3.7 Bcf/d of processing capacity in the Marcellus Shale 4,000 Bluestone III 3,500 Houston IV 2015+ Majorsville VI 3,000 Bluestone II Majorsville IV…
Utica Segment Key Considerations We are developing a leading position in the southern core of the highly 2014 13% prospective Utica Shale Forecasted Segment We have partnered with The Energy & Minerals Group (EMG) to develop fully…
Utica Processing Capacity Growing to nearly 1 Bcf/d in the Utica Shale by the end of 2014 1,000 900 2014 Cadiz II 800 Seneca III 700 600 500 Cadiz I Current & 400 Refrigeration Seneca I - II 300 200 100 0…
Condensate Solutions in the Utica Shale MarkWest Utica EMG Condensate will 23,000 Bbl/d construct a condensate stabilization Hopedale JV Condensate facility with associated logistics and storage terminal capabilities in Harrison…
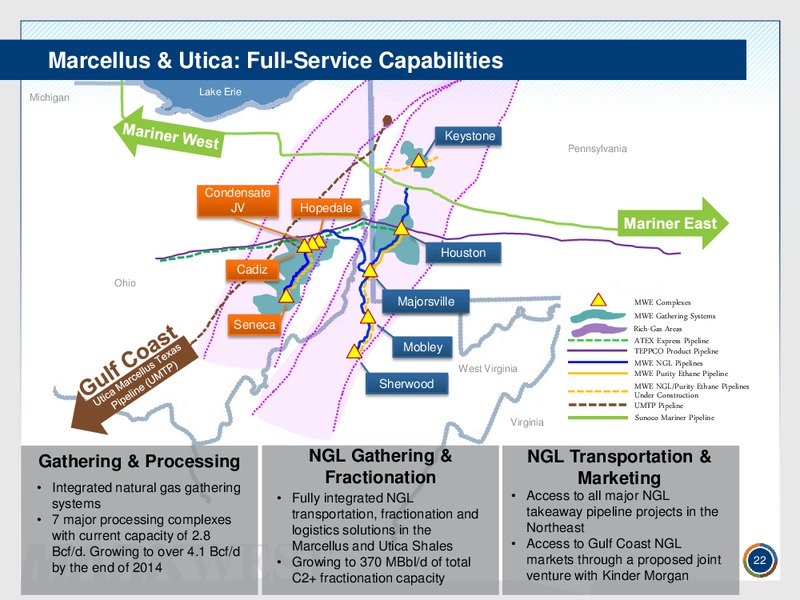
Marcellus & Utica: Full-Service Capabilities Lake Erie Michigan Keystone Pennsylvania Condensate JV Hopedale Houston Cadiz Ohio Majorsville MWE Complexes MWE Gathering Systems Seneca Rich-Gas Areas ATEX Express…
Northeast Processing Capacity Volume Growth Increasing total processing capacity in the rich-gas areas of the Marcellus and Utica to over 4.1 Bcf/d by the end of 2014 4,500 Marcellus Processing Capacity Utica Processing Capacity…
Hopedale Fractionator: Growing Our Integrated Asset Base In January 2014, MarkWest began operations of its third world-class fractionation and marketing complex in the Northeast The Hopedale fractionator is located in Harrison…
Northeast Ethane: Innovative Solutions MarkWests fractionation solutions are a critical link to the successful development of ethane pipeline projects in the Northeast MarkWest is currently operating two large-scale de-ethanization…
Marcellus & Utica: 23 Major Projects Complete Crawford 17 Major projects under construction KEYSTONE COMPLEX Venango Bluestone I Trumbull & Sarsen I 90 MMcf/d Complete Mercer Bluestone II 120 MMcf/d 2Q14 HOPEDALE FRACTIONATOR…
Kinder Morgan/MarkWest Utica EMG Joint Venture New JV Processing Facility and JV NGL Connection JV would develop a large-scale processing complex in Tuscarawas County, OH and connect the JV NGL pipeline to existing MarkWest…
U.S. NGL Supply: Set to Soar Field production from highly productive shale resource plays will continue to drive U.S. NGL supply growth 5,000 Field Production Supply From Refineries Imports 4,000 Barrels per day (thousands)…
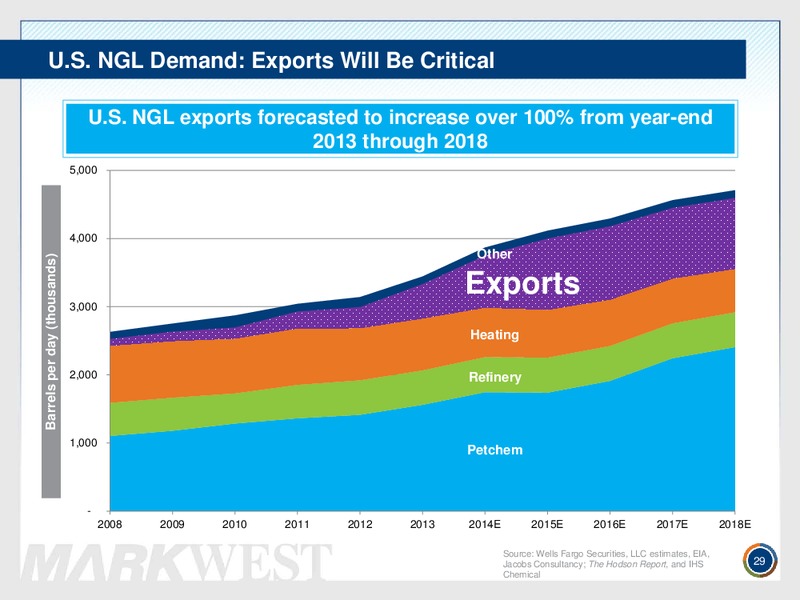
U.S. NGL Demand: Exports Will Be Critical U.S. NGL exports forecasted to increase over 100% from year-end 2013 through 2018 5,000 4,000 Other Barrels per day (thousands) Exports 3,000 Heating 2,000 Refinery 1,000…
U.S. Propane Exports: Arbitrage & Expansion U.S. propane prices remain significantly Forecasted Price of U.S. Propane to Remain Attractive lower than international grades and present versus Northwest Europe and Japan compelling…
U.S. Butane Exports: A Growing Opportunity Forecasted Price of U.S. Butane to Remain Attractive versus Northwest Europe and Japan U.S. butane prices are forecasted to remain highly competitive versus major would markets through…
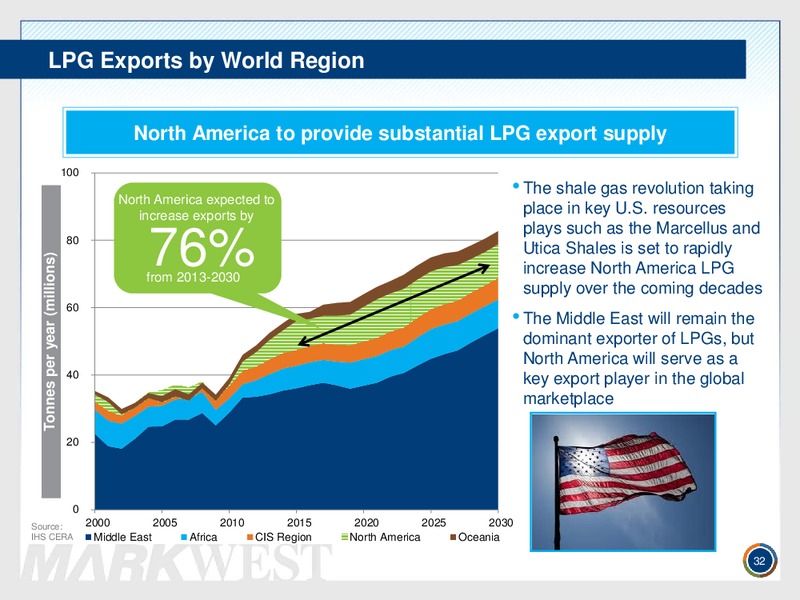
LPG Exports by World Region North America to provide substantial LPG export supply 100 North America expected to The shale gas revolution taking increase exports by place in key U.S. resources plays such as the Marcellus and…
World LPG Demand by Region Asia will become the primary demand Asian Demand for LPG at Forefront market for LPG, as strong economic growth and the rise in personal 160 incomes will drive consumption 140 LPG imports in Asia will be…
World Destinations for Propane & Butane by Region in 2020 Asia is forecasted to account for two-thirds of the total global net imports in 2020 18% 75% 7% Source: IHS CERA Asia includes Far East, Southeast Asia and Indian…
MarkWest C3+ Production Forecast Propane and heavier liquids production for Marcellus & Utica has capability to exceed 250,000 Bbl/d by 2018 Over 1,000% Barrels Per Day (Bbl/d) Increase from 2012 to 2018 Jan-12 Jan-13…
Capital Investments 2014 Capital Expenditures Forecast of 1.8 to 2.3 billion 2014 Capital Forecast by Segment 2014 Capital Forecast by Category 60% Utica 35% 50% 40% 30% 20% 10% Southwest Marcellus 5% 60% 0%…
Distributable Cash Flow 2014 DCF Forecast of 600 million to 690 million 700 600 500 DCF (millions ) 400 300 200 100 0 2004 2005 2006 2007 2008 2009 2010 2011 2012 2013F 2014F From 2004 to 2012, DCF has grown…
Risk Management Program 2014 Forecast Increasing Fee-Based Margin to over 70% Net Operating Margin by Contract Type by the end of 2014 75% Fee-Based 73% Keep-Whole Increase of 8% 3x since 2008 POP&POI 50% 19% NOTE: Net…
MarkWest Investment Considerations: What to Expect Maintain strong customer base in key resource plays with high-quality assets and exceptional service Continue to execute on growth projects that are well diversified across the…
APPENDIX
Reconciliation of DCF and Distribution Coverage Nine Months Year Ended Ended ( in millions) 12/31/2012 9/30/2013 Net Income 218.8 44.3 Depreciation, amortization, impairment, and other non-cash operating 250.1 232.0 expenses…
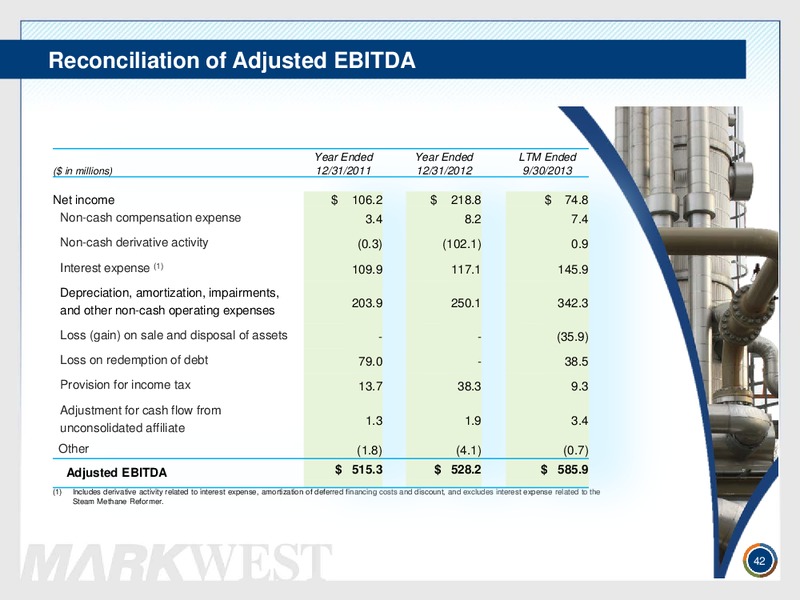
Reconciliation of Adjusted EBITDA Year Ended Year Ended LTM Ended ( in millions) 12/31/2011 12/31/2012 9/30/2013 Net income 106.2 218.8 74.8 Non-cash compensation expense 3.4 8.2 7.4 Non-cash derivative activity (0.3) (102.1) 0.9…
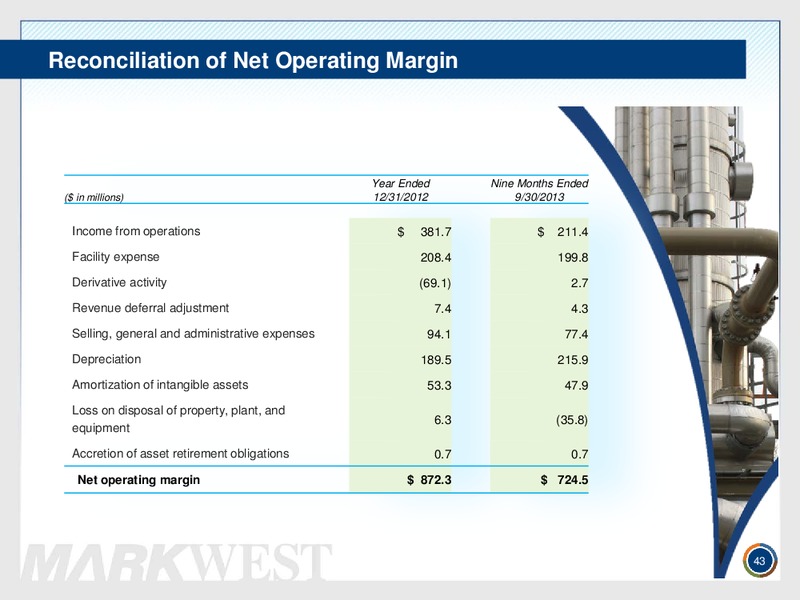
Reconciliation of Net Operating Margin Year Ended Nine Months Ended ( in millions) 12/31/2012 9/30/2013 Income from operations 381.7 211.4 Facility expense 208.4 199.8 Derivative activity (69.1) 2.7 Revenue deferral…
1515 Arapahoe Street Tower 1, Suite 1600 Denver, Colorado 80202 Phone: 303-925-9200 Investor Relations: 866-858-0482 Email: investorrelationsmarkwest.com Website: www.markwest.com
 Loading...