We add150value years as one company Erwin Rauhe 150 years Senior Vice President Business Center Europe South Roadshow Madrid January 15, 2015 BASF Capital Market Story January 2015 1
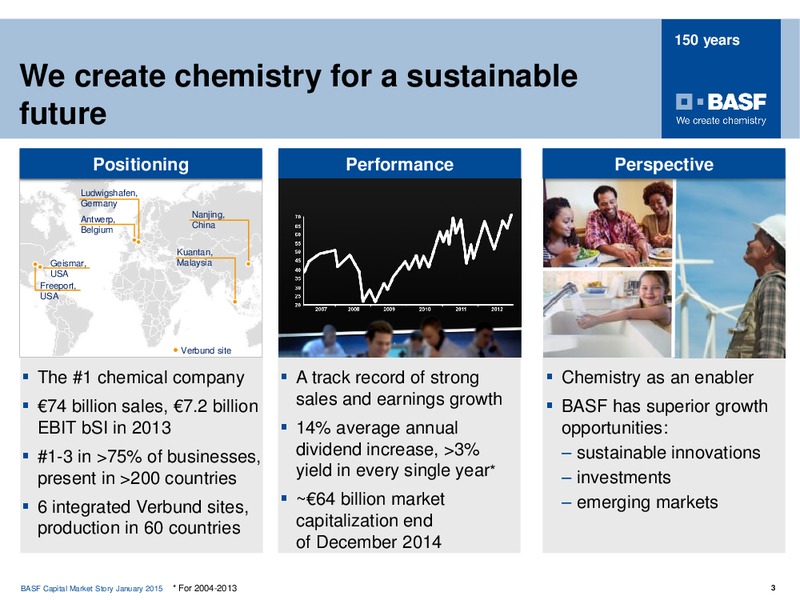
150 years We create chemistry for a sustainable future Positioning Performance Perspective Ludwigshafen, Germany Nanjing, Antwerp, China Belgium Kuantan, Geismar, Malaysia USA Freeport, USA Verbund site The 1…
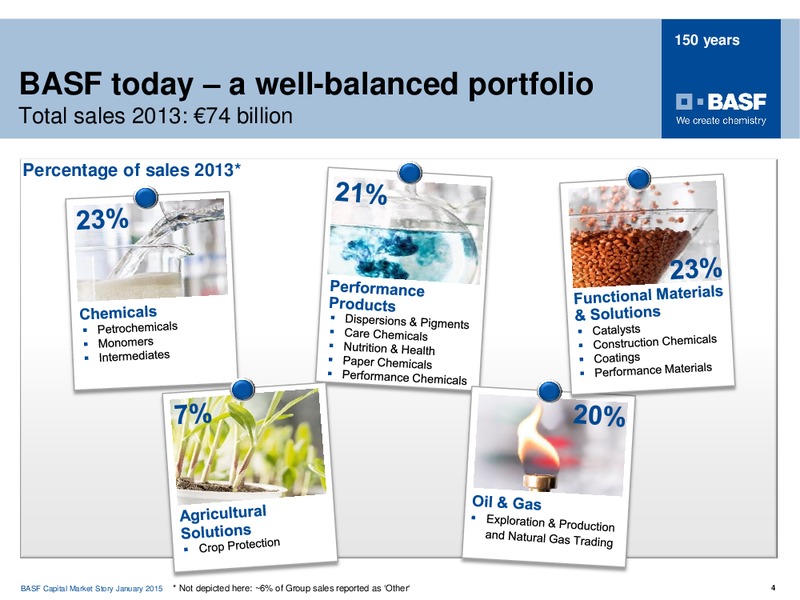
150 years BASF today a well-balanced portfolio Total sales 2013: 74 billion Percentage of sales 2013* BASF Capital Market Story January 2015 * Not depicted here: 6% of Group sales reported as Other 4
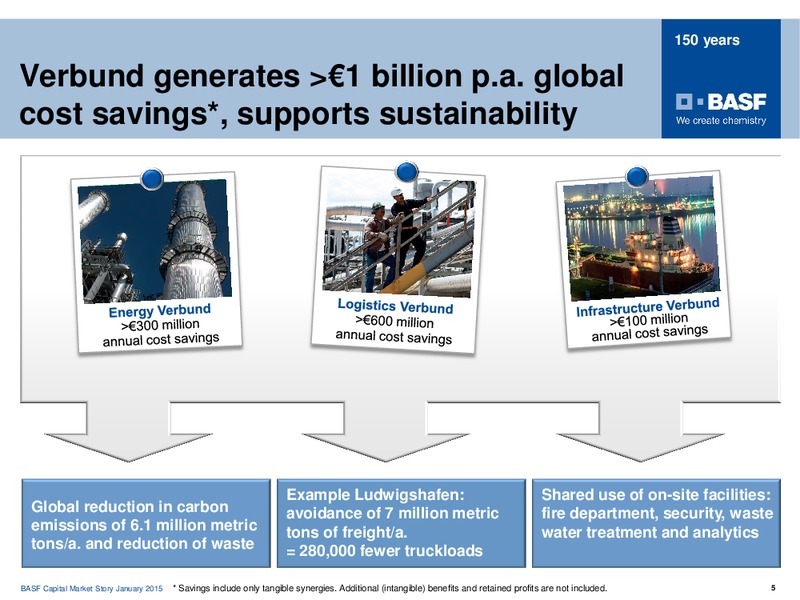
150 years Verbund generates 1 billion p.a. global cost savings*, supports sustainability Example Ludwigshafen: Shared use of on-site facilities: Global reduction in carbon avoidance of 7 million metric fire department, security,…
Business review Growth Levers BASF Capital Market Story January 2015 6
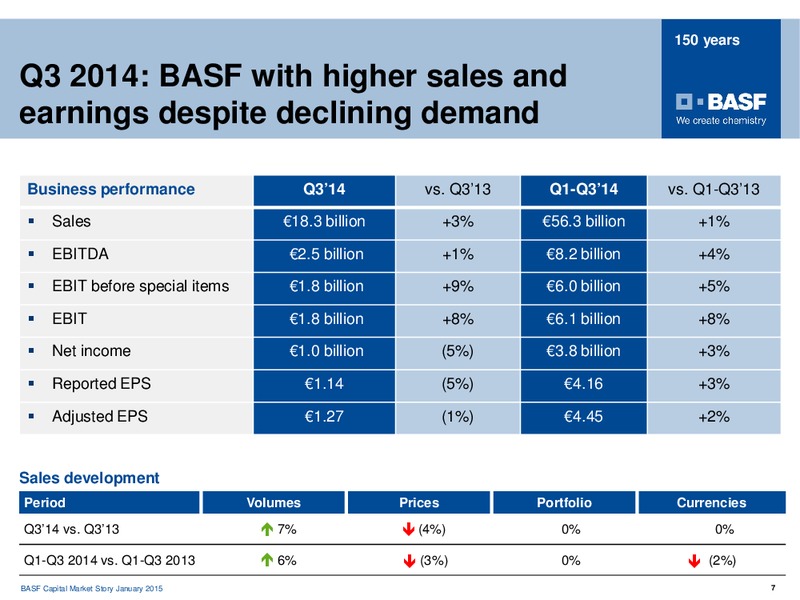
150 years Q3 2014: BASF with higher sales and earnings despite declining demand Business performance Q314 vs. Q313 Q1-Q314 vs. Q1-Q313 Sales 18.3 billion +3% 56.3 billion +1% EBITDA 2.5 billion +1% 8.2 billion +4% EBIT before…
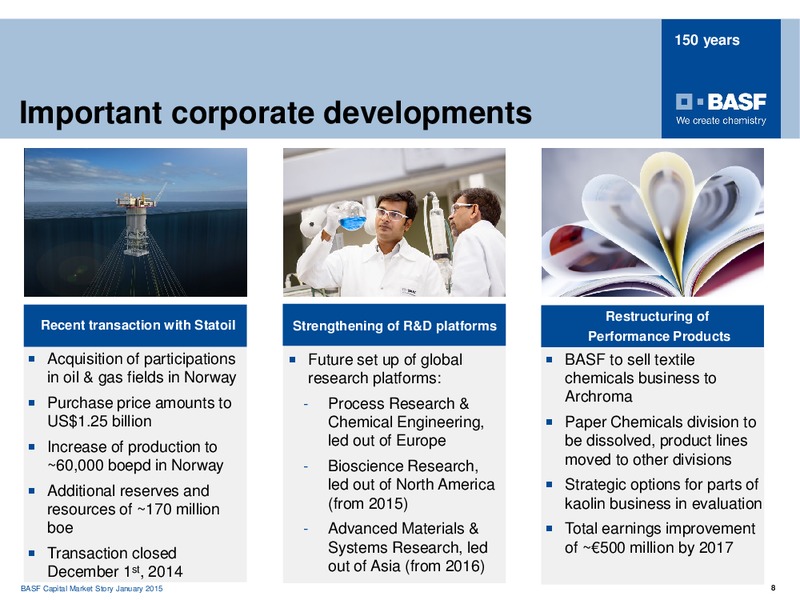
150 years Important corporate developments Restructuring of Recent transaction with Statoil Strengthening of R&D platforms Performance Products Acquisition of participations Future set up of global BASF to sell textile in…
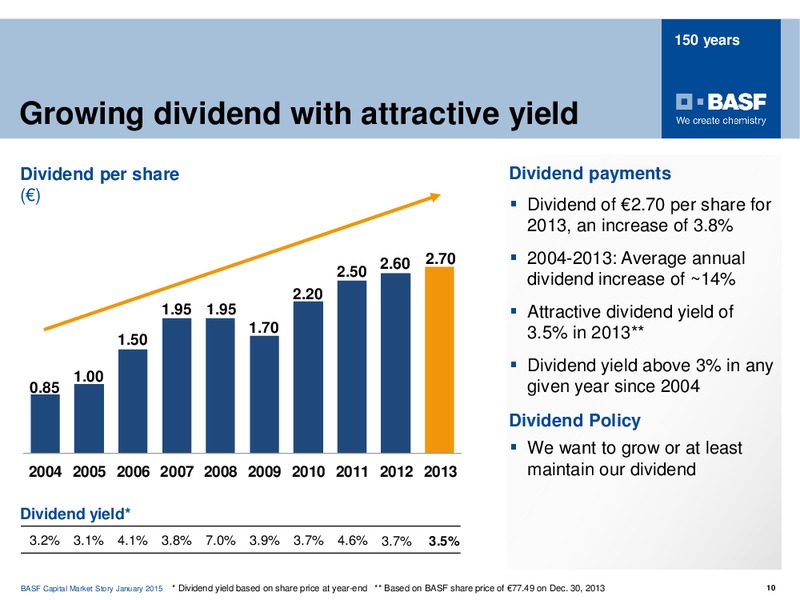
150 years Growing dividend with attractive yield Dividend per share Dividend payments () Dividend of 2.70 per share for 2013, an increase of 3.8% 2.70 2004-2013: Average annual 2.50 2.60 dividend increase of 14% 2.20 1.95 1.95…
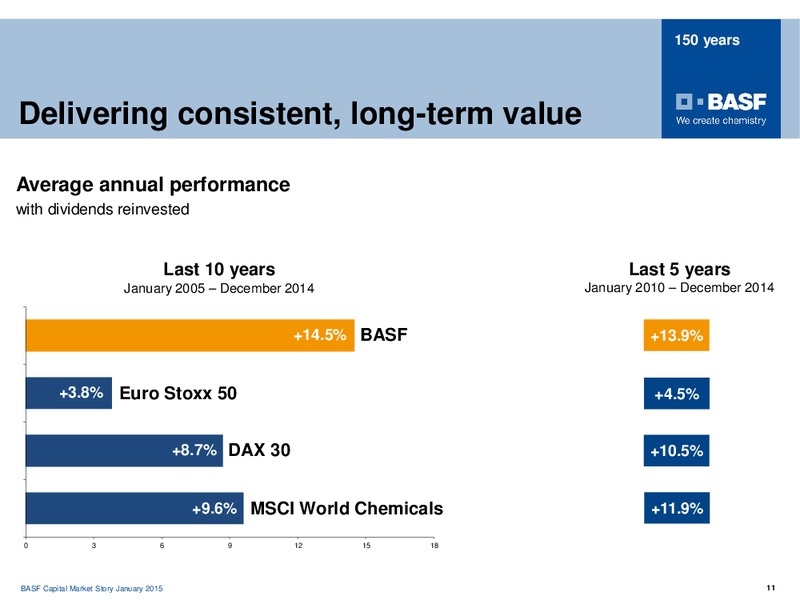
150 years Delivering consistent, long-term value Average annual performance with dividends reinvested Last 10 years Last 5 years January 2005 December 2014 January 2010 December 2014 +14.5% BASF +13.9% +3.8% Euro Stoxx 50…
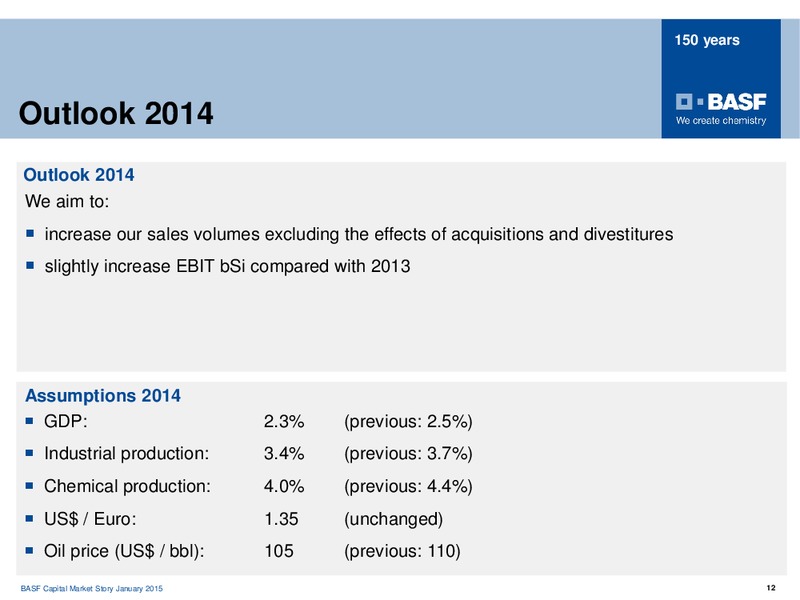
150 years Outlook 2014 Outlook 2014 We aim to: increase our sales volumes excluding the effects of acquisitions and divestitures slightly increase EBIT bSi compared with 2013 Assumptions 2014 GDP: 2.3% (previous: 2.5%)…
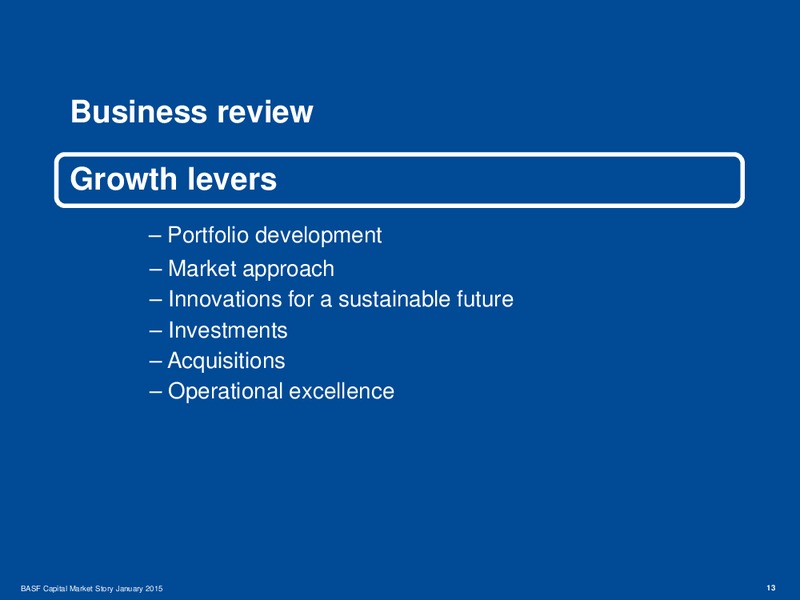
Business review Growth levers Portfolio development Market approach Innovations for a sustainable future Investments Acquisitions Operational excellence BASF Capital Market Story January 2015 13
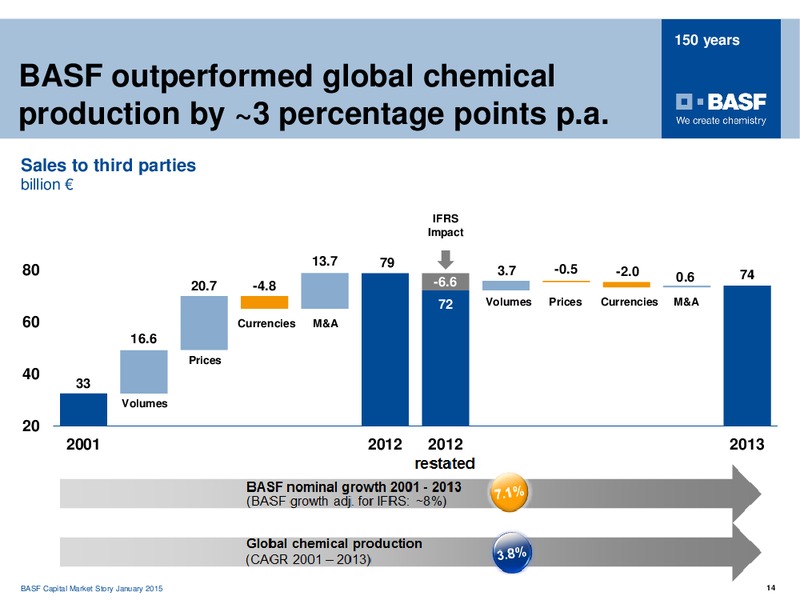
150 years BASF outperformed global chemical production by 3 percentage points p.a. Sales to third parties billion IFRS Impact 13.7 79 80 3.7 -0.5 -2.0 0.6 74 20.7 -4.8 -6.6 72 Volumes Prices Currencies M&A 60 Currencies M&A…
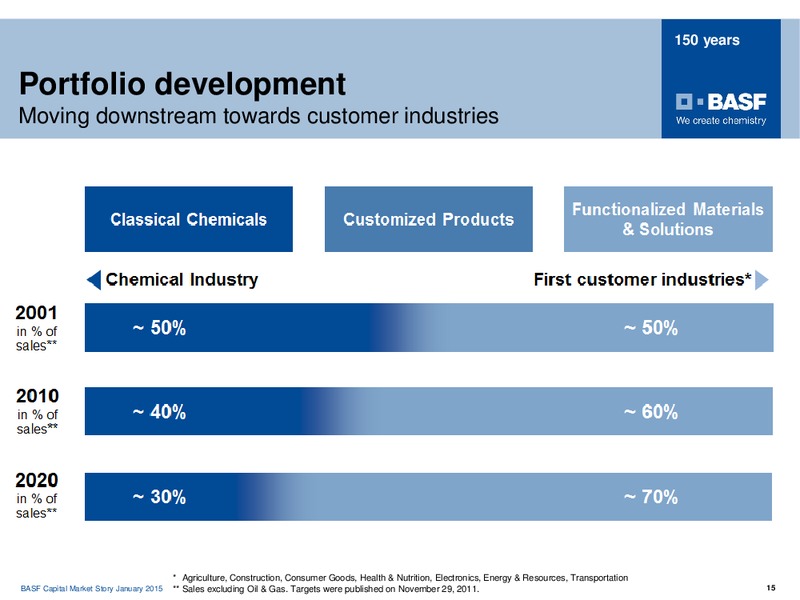
150 years Portfolio development Moving downstream towards customer industries * Agriculture, Construction, Consumer Goods, Health & Nutrition, Electronics, Energy & Resources, Transportation BASF Capital Market Story January 2015…
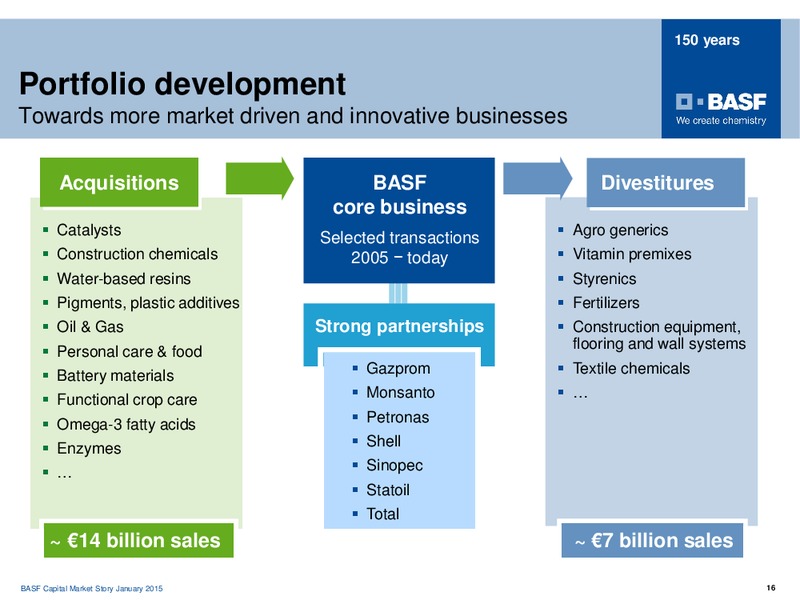
150 years Portfolio development Towards more market driven and innovative businesses Acquisitions BASF Divestitures core business Catalysts Agro generics Selected transactions Construction chemicals 2005 today Vitamin premixes…
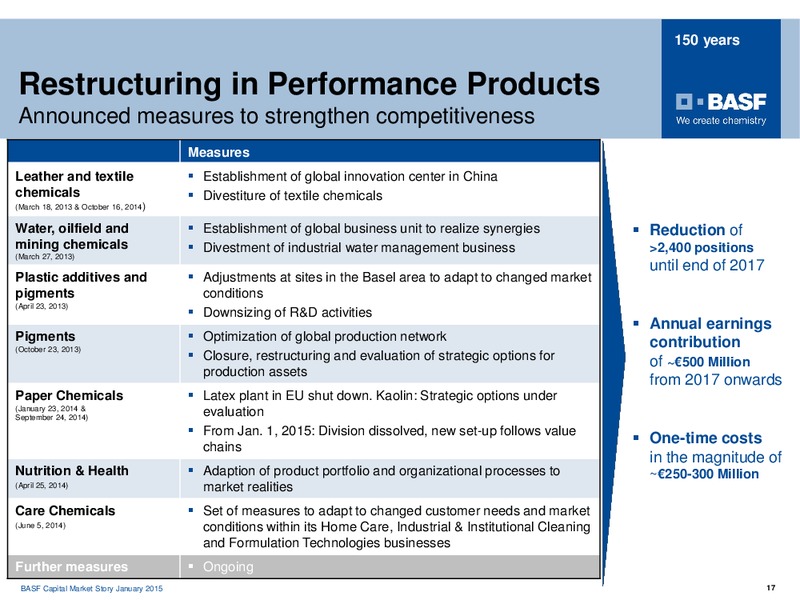
150 years Restructuring in Performance Products Announced measures to strengthen competitiveness Measures Leather and textile Establishment of global innovation center in China chemicals Divestiture of textile chemicals (March 18,…
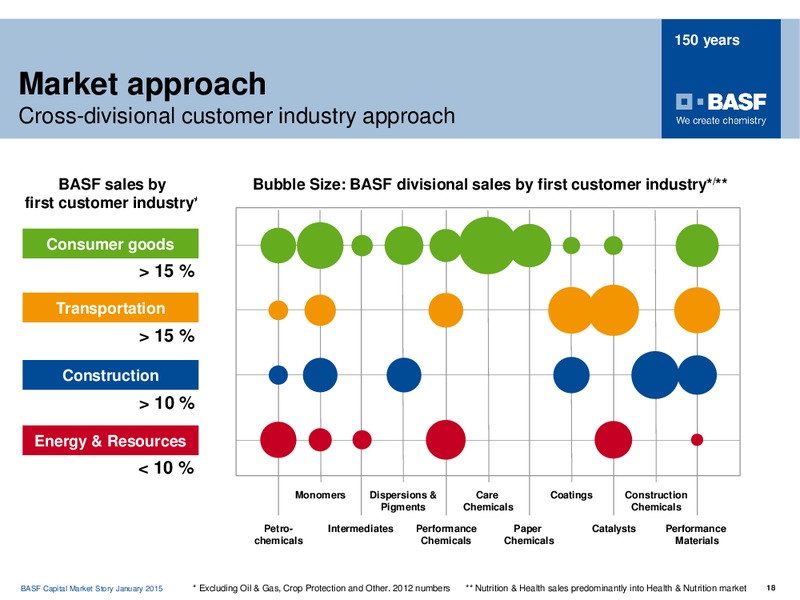
150 years Market approach Cross-divisional customer industry approach BASF sales by Bubble Size: BASF divisional sales by first customer industry*/** first customer industry* Consumer goods 15 % Transportation 15 %…
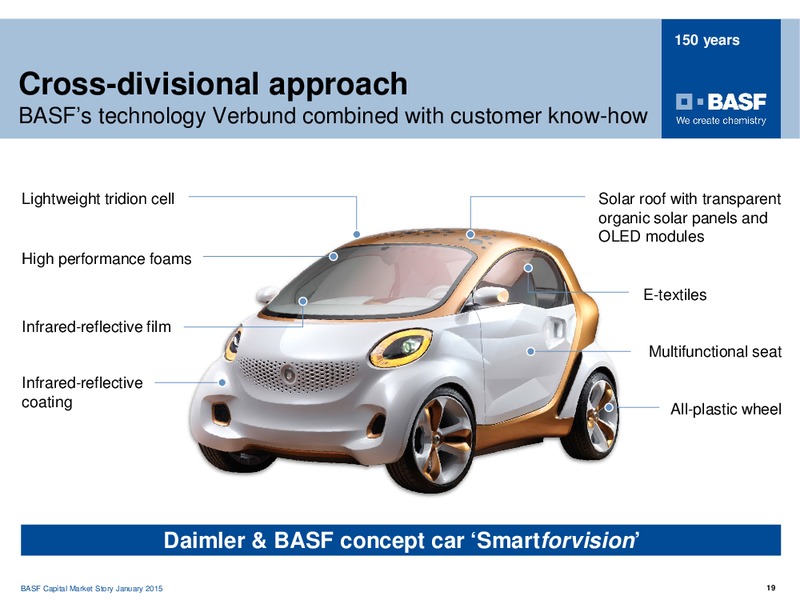
150 years Cross-divisional approach BASFs technology Verbund combined with customer know-how Lightweight tridion cell Solar roof with transparent organic solar panels and OLED modules High performance foams E-textiles…
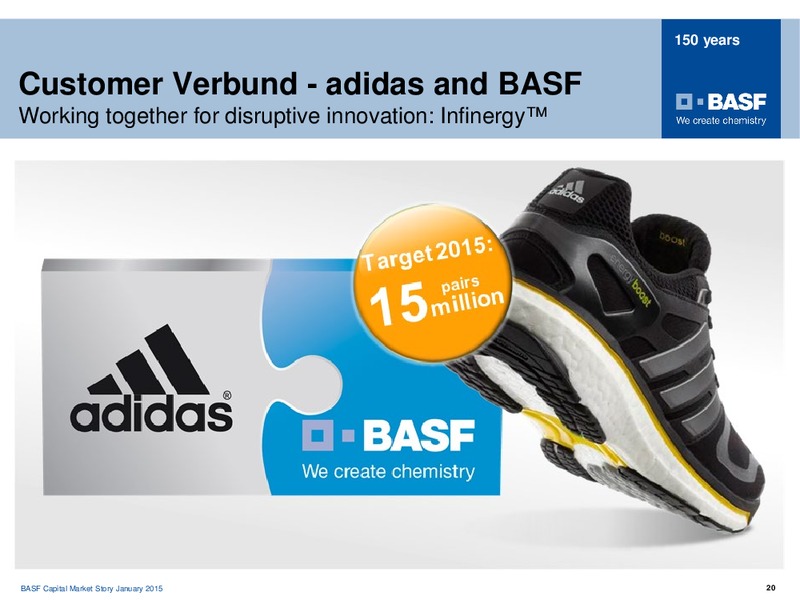
150 years Customer Verbund - adidas and BASF Working together for disruptive innovation: Infinergy BASF Capital Market Story January 2015 20
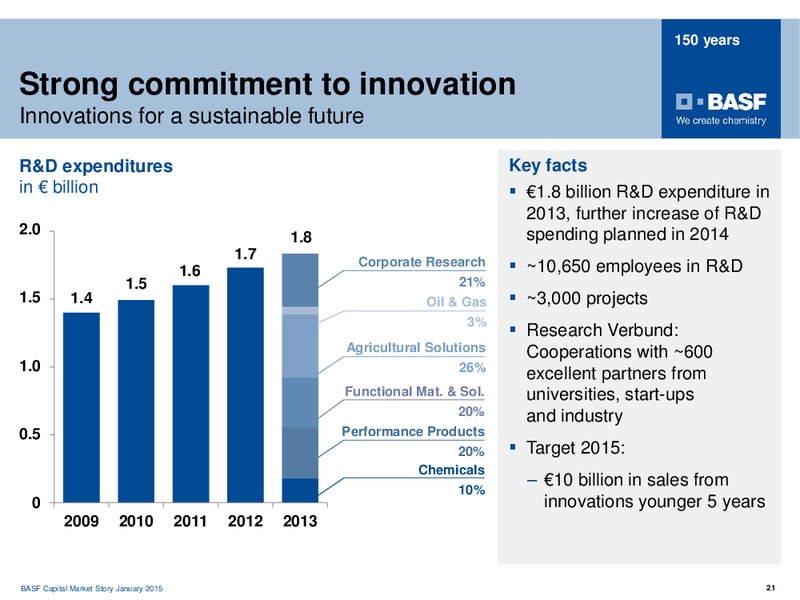
150 years Strong commitment to innovation Innovations for a sustainable future R&D expenditures Key facts in billion 1.8 billion R&D expenditure in 2013, further increase of R&D 2.0 2,0 spending planned in 2014 1.8 1.7 1.6…
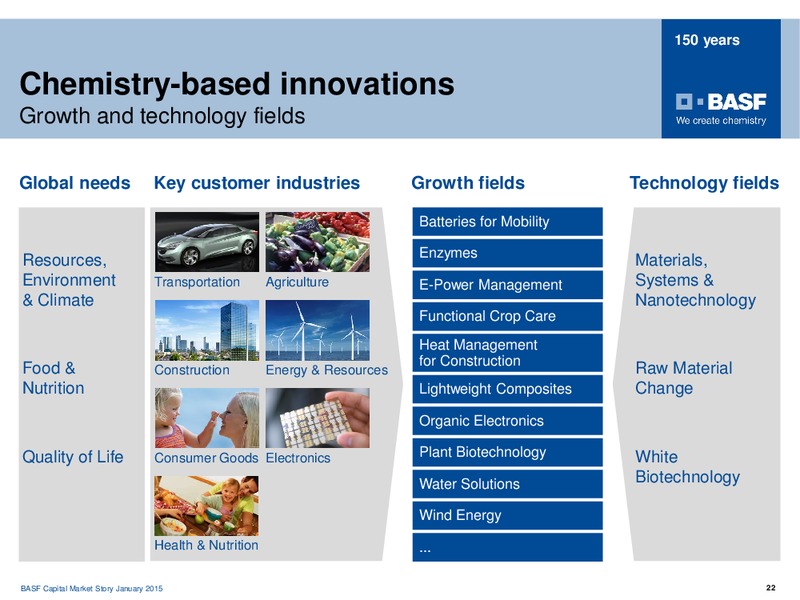
150 years Chemistry-based innovations Growth and technology fields Global needs Key customer industries Growth fields Technology fields Batteries for Mobility Enzymes Resources, Materials, Environment Transportation Agriculture…
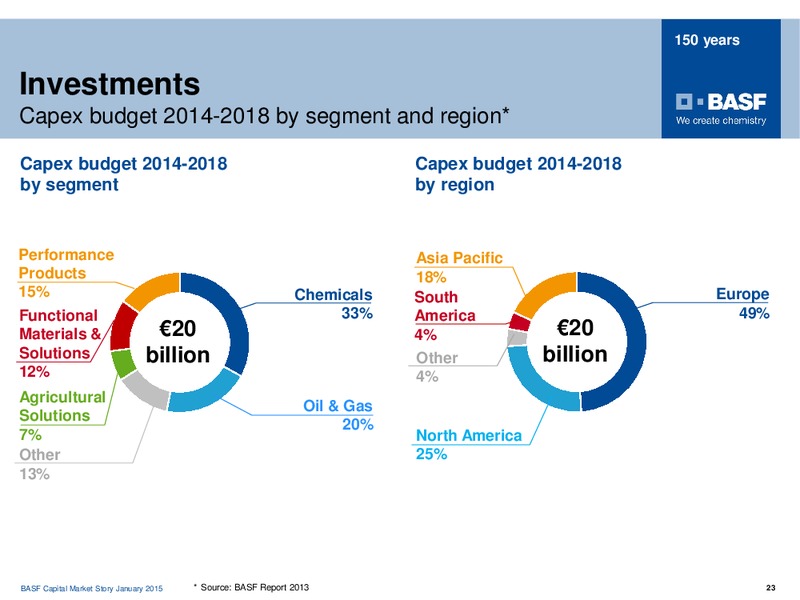
150 years Investments Capex budget 2014-2018 by segment and region* Capex budget 2014-2018 Capex budget 2014-2018 by segment by region Performance Asia Pacific Products 18% 15% Chemicals South Europe Functional 33% America 49%…
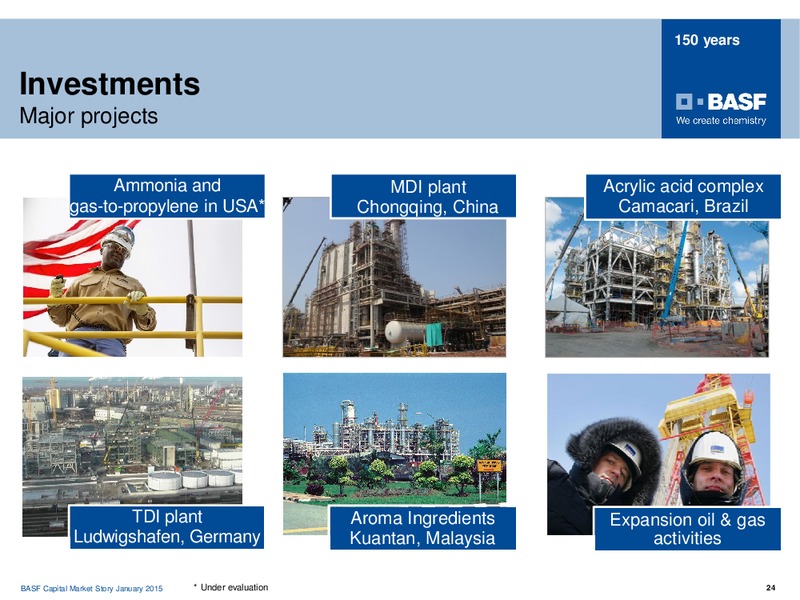
150 years Investments Major projects Ammonia and MDI plant Acrylic acid complex gas-to-propylene in USA* Chongqing, China Camacari, Brazil TDI plant Aroma Ingredients Expansion oil & gas Ludwigshafen, Germany Kuantan,…
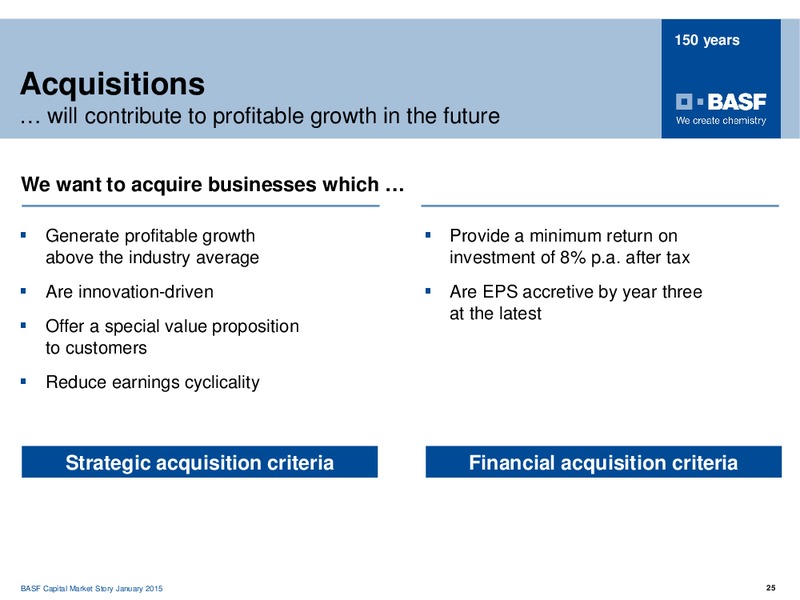
150 years Acquisitions will contribute to profitable growth in the future We want to acquire businesses which Generate profitable growth Provide a minimum return on above the industry average investment of 8% p.a. after tax Are…
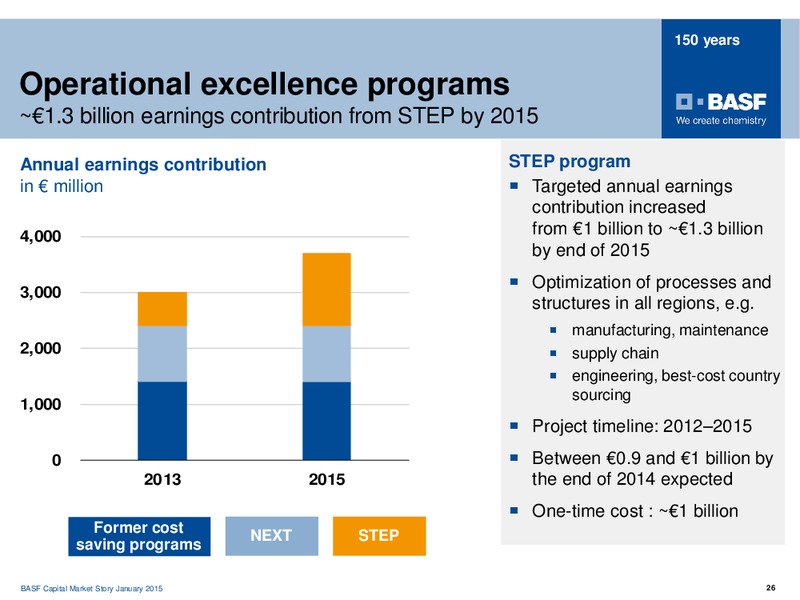
150 years Operational excellence programs 1.3 billion earnings contribution from STEP by 2015 Annual earnings contribution STEP program in million Targeted annual earnings contribution increased 4,000 from 1 billion to 1.3 billion…
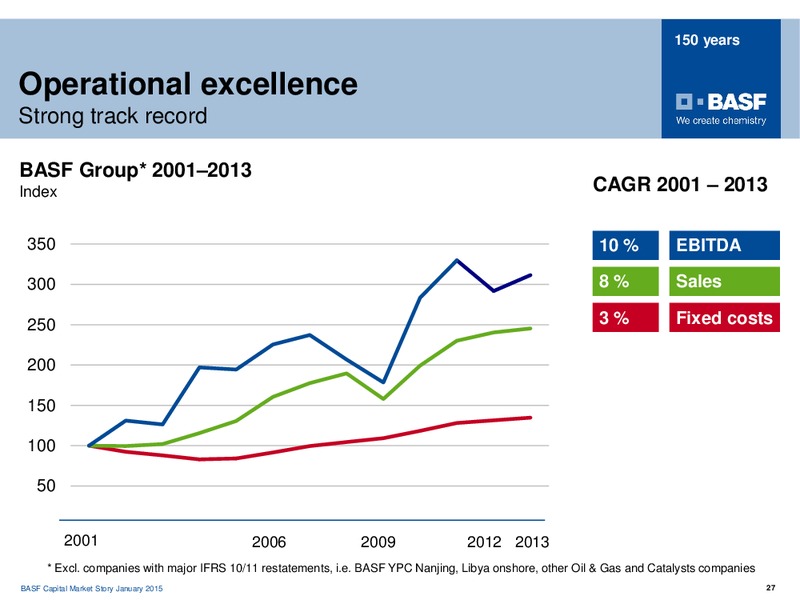
150 years Operational excellence Strong track record BASF Group* 20012013 Index CAGR 2001 2013 350 10 % EBITDA 300 8% Sales 250 3% Fixed costs 200 150 100 50 2001 2006 2009 2012 2013 * Excl. companies with major IFRS…
Appendix I: Chemicals Day BASF Capital Market Story January 2015 28
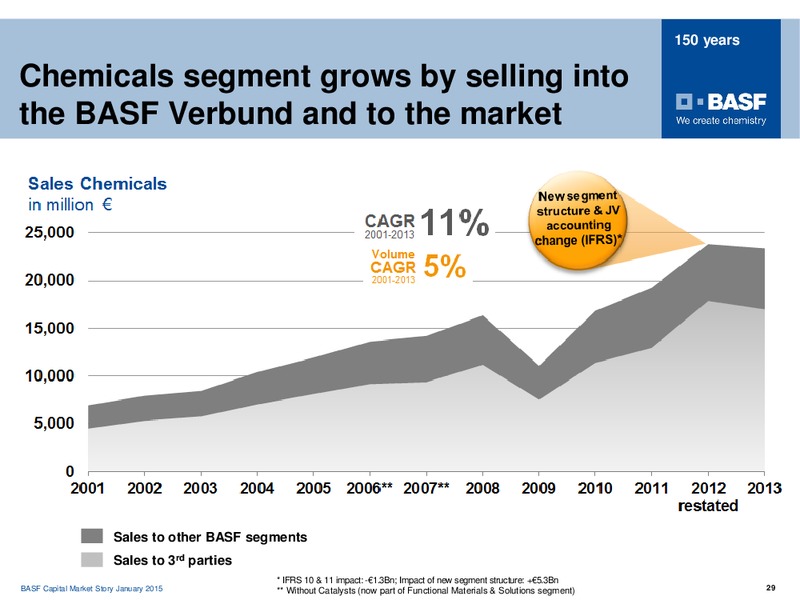
150 years Chemicals segment grows by selling into the BASF Verbund and to the market Sales to other BASF segments Sales to 3rd parties * IFRS 10 & 11 impact: -1.3Bn; Impact of new segment structure: +5.3Bn BASF Capital Market…
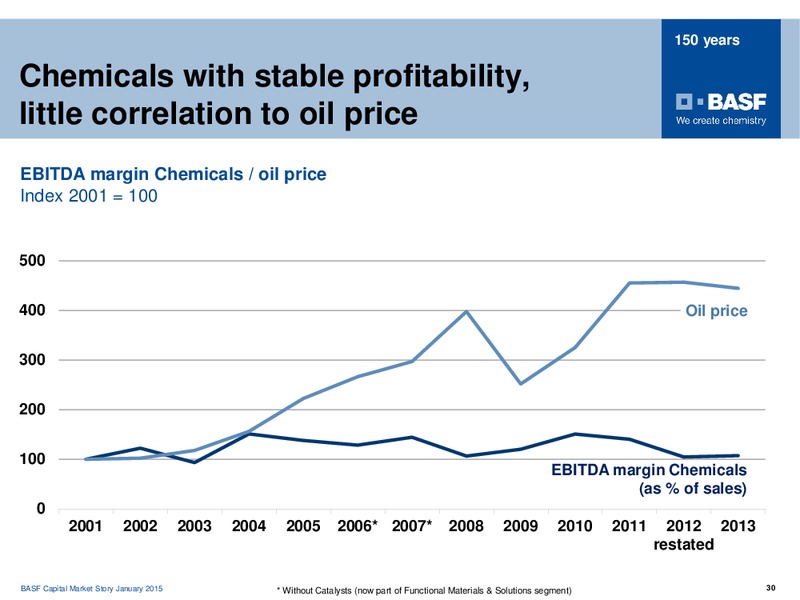
150 years Chemicals with stable profitability, little correlation to oil price EBITDA margin Chemicals / oil price Index 2001 = 100 500 400 Oil price 300 200 100 EBITDA margin Chemicals (as % of sales) 0 2001 2002 2003…
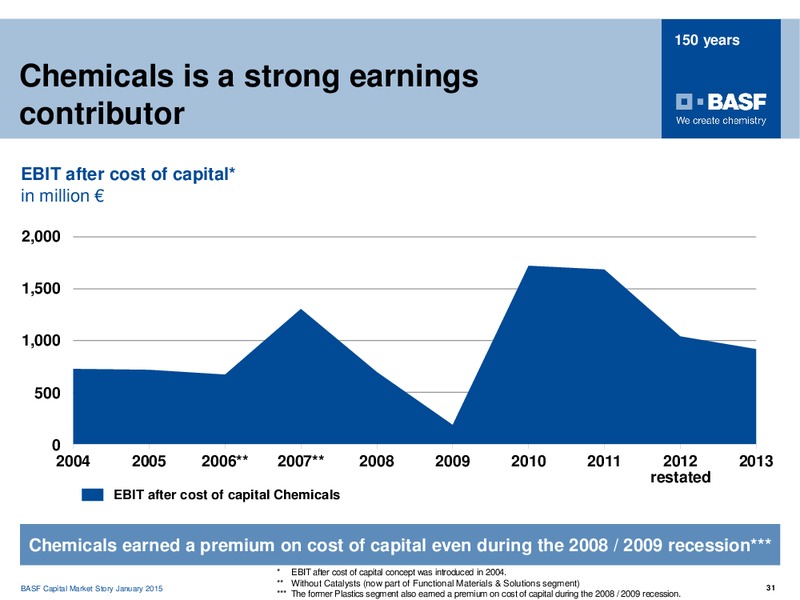
150 years Chemicals is a strong earnings contributor EBIT after cost of capital* in million 2,000 2.000 1,500 1.500 1.000 1,000 500 0 2004 2005 2006** 2007** 2008 2009 2010 2011 2012 2013 restated EBIT after cost of…
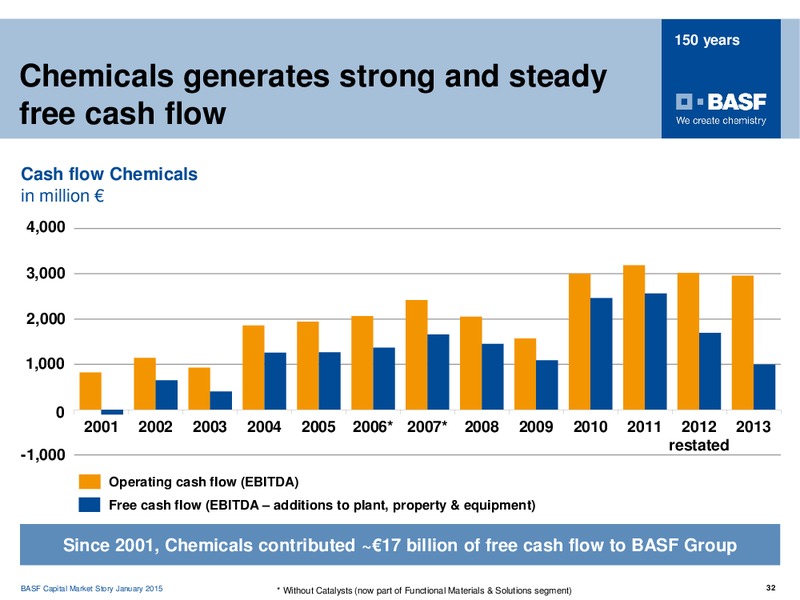
150 years Chemicals generates strong and steady free cash flow Cash flow Chemicals in million 4,000 3,000 2,000 1,000 0 2001 2002 2003 2004 2005 2006* 2007* 2008 2009 2010 2011 2012 2013 restated -1,000 Operating cash flow…
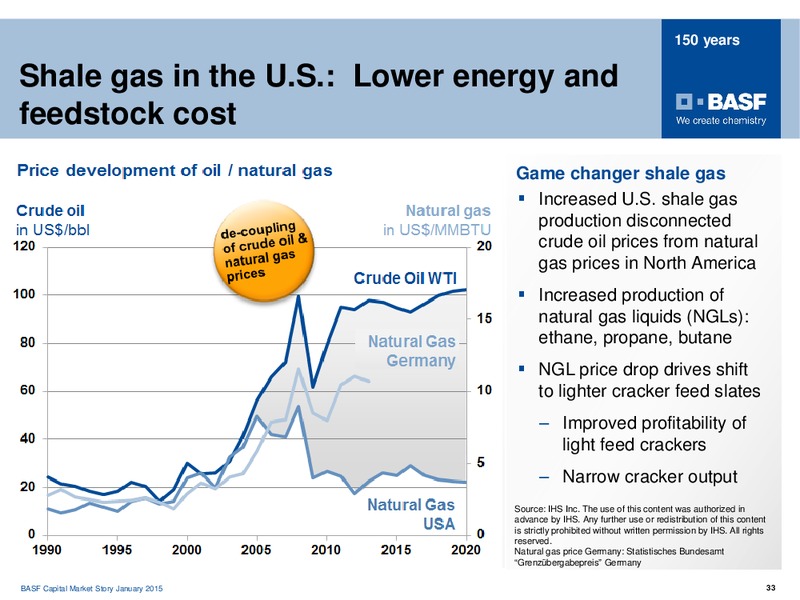
150 years Shale gas in the U.S.: Lower energy and feedstock cost Game changer shale gas Increased U.S. shale gas production disconnected crude oil prices from natural gas prices in North America Increased production of natural…
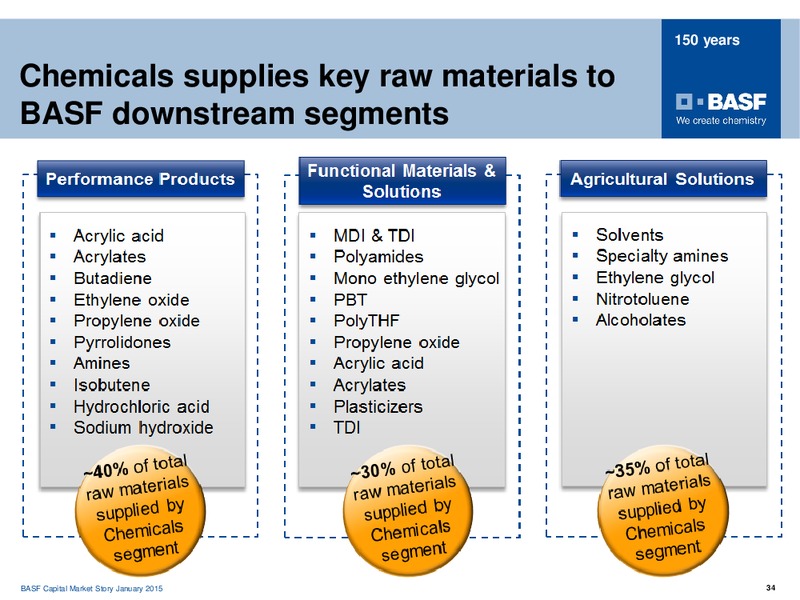
150 years Chemicals supplies key raw materials to BASF downstream segments BASF Capital Market Story January 2015 34
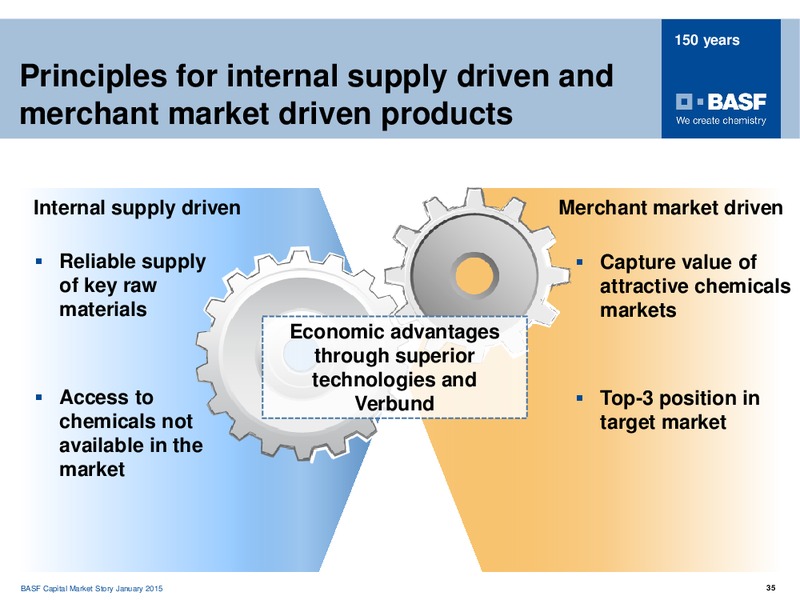
150 years Principles for internal supply driven and merchant market driven products Internal supply driven Merchant market driven Reliable supply Capture value of of key raw attractive chemicals materials markets Economic…
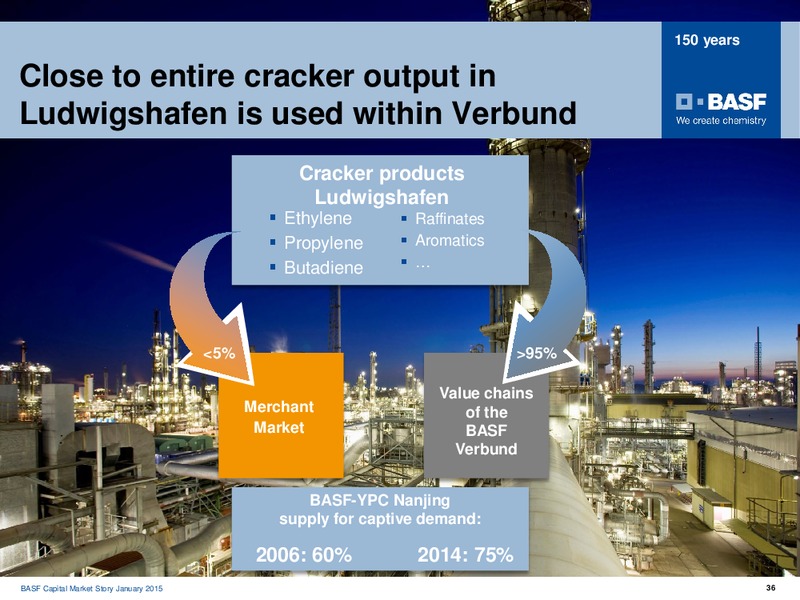
150 years Close to entire cracker output in Ludwigshafen is used within Verbund Cracker products Ludwigshafen Ethylene Raffinates Propylene Aromatics…
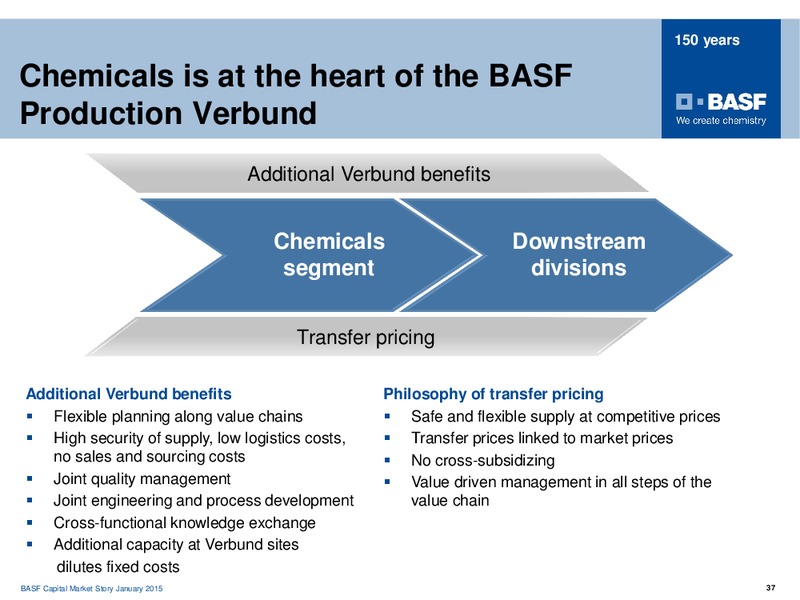
150 years Chemicals is at the heart of the BASF Production Verbund Additional Verbund benefits Chemicals Downstream segment divisions Transfer pricing Additional Verbund benefits Philosophy of transfer pricing Flexible…
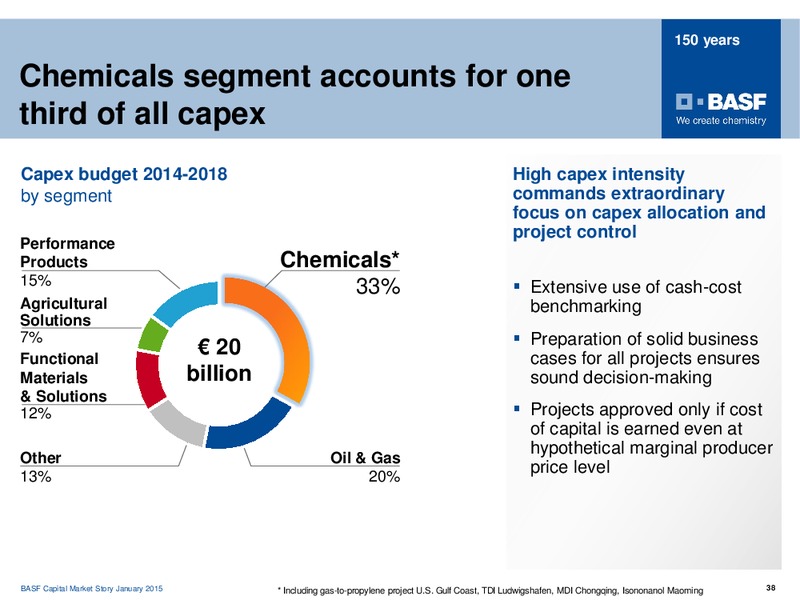
150 years Chemicals segment accounts for one third of all capex Capex budget 2014-2018 High capex intensity by segment commands extraordinary focus on capex allocation and project control Performance Products Chemicals* 15% Extensive…
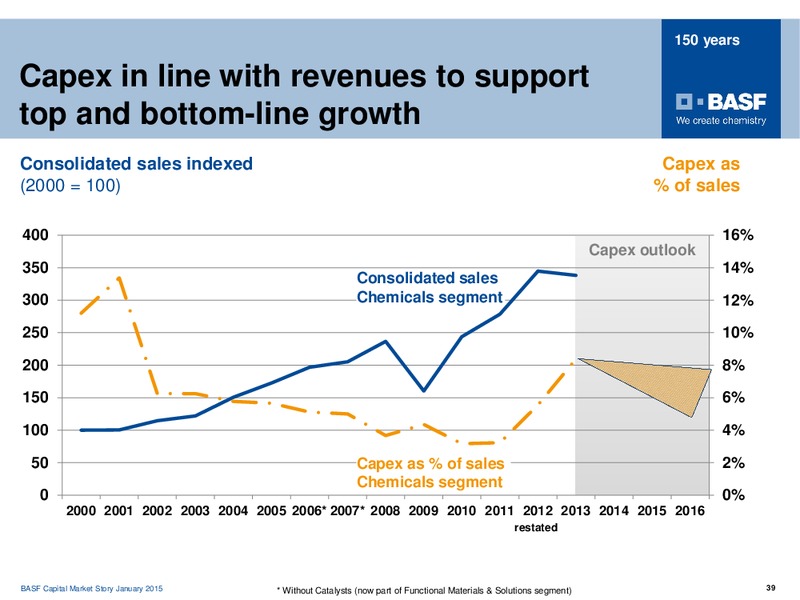
150 years Capex in line with revenues to support top and bottom-line growth Consolidated sales indexed Capex as (2000 = 100) % of sales 400 16% Capex outlook 350 14% Consolidated sales 300 Chemicals segment 12% 250 10% 200 8% 150…
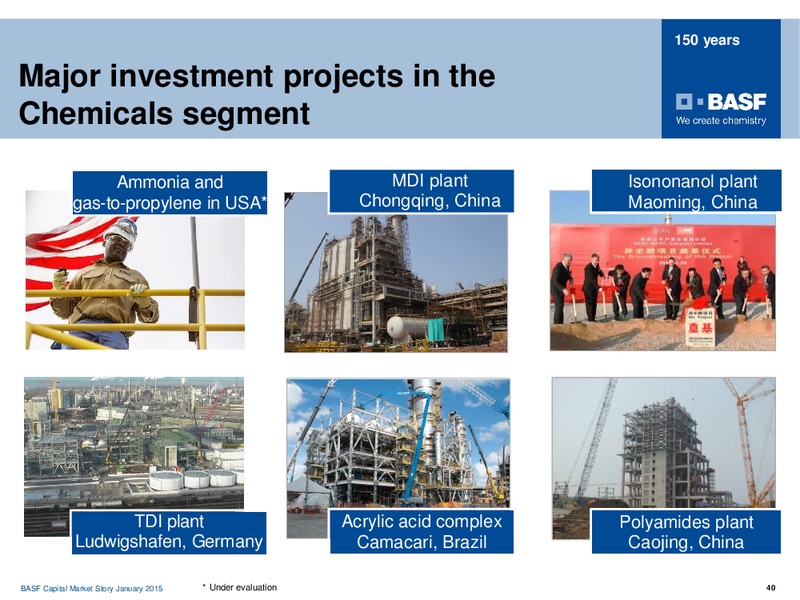
150 years Major investment projects in the Chemicals segment Ammonia and MDI plant Isononanol plant gas-to-propylene in USA* Chongqing, China Maoming, China TDI plant Acrylic acid complex Polyamides plant Ludwigshafen, Germany…
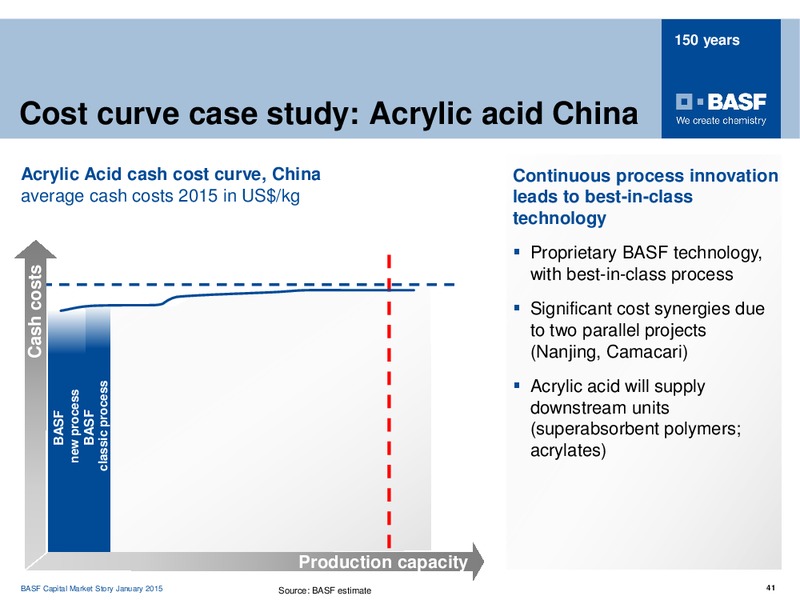
150 years Cost curve case study: Acrylic acid China Acrylic Acid cash cost curve, China Continuous process innovation average cash costs 2015 in US/kg leads to best-in-class technology Proprietary BASF technology, Cash costs…
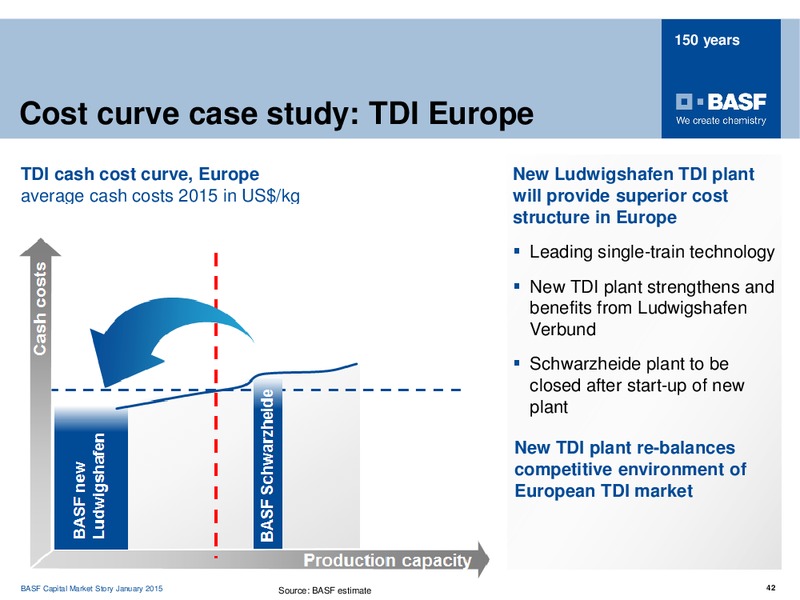
150 years Cost curve case study: TDI Europe TDI cash cost curve, Europe New Ludwigshafen TDI plant average cash costs 2015 in US/kg will provide superior cost structure in Europe Leading single-train technology New TDI plant…
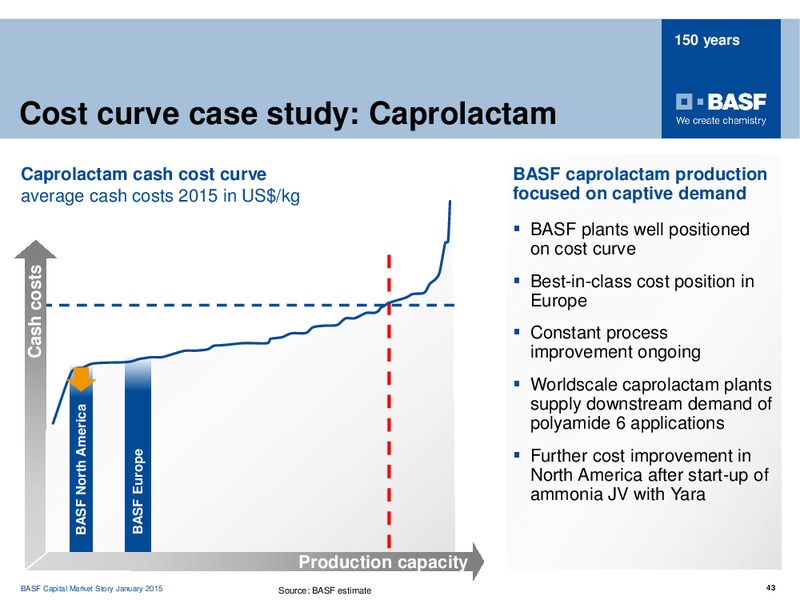
150 years Cost curve case study: Caprolactam Caprolactam cash cost curve BASF caprolactam production average cash costs 2015 in US/kg focused on captive demand BASF plants well positioned on cost curve Cash costs…
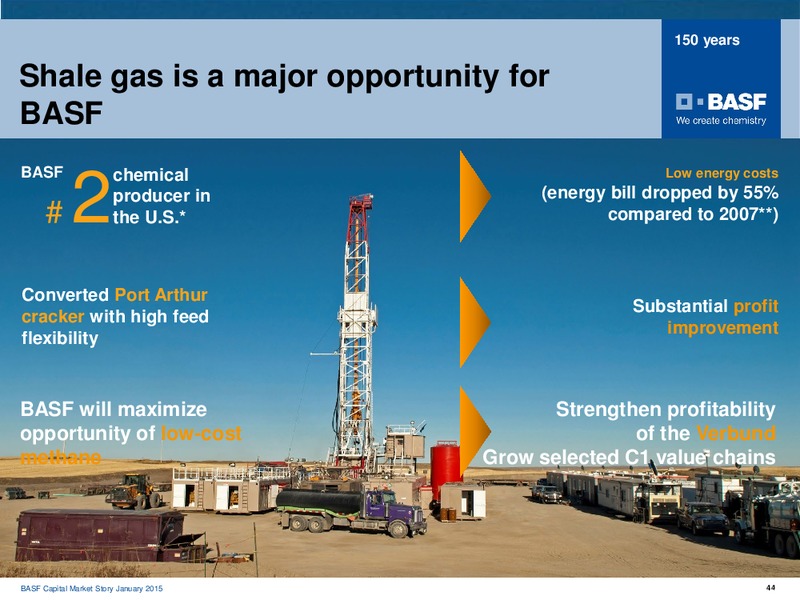
150 years Shale gas is a major opportunity for BASF BASF chemical Low energy costs 2 producer in the U.S.* (energy bill dropped by 55% compared to 2007**) Converted Port Arthur Substantial profit cracker with high feed…
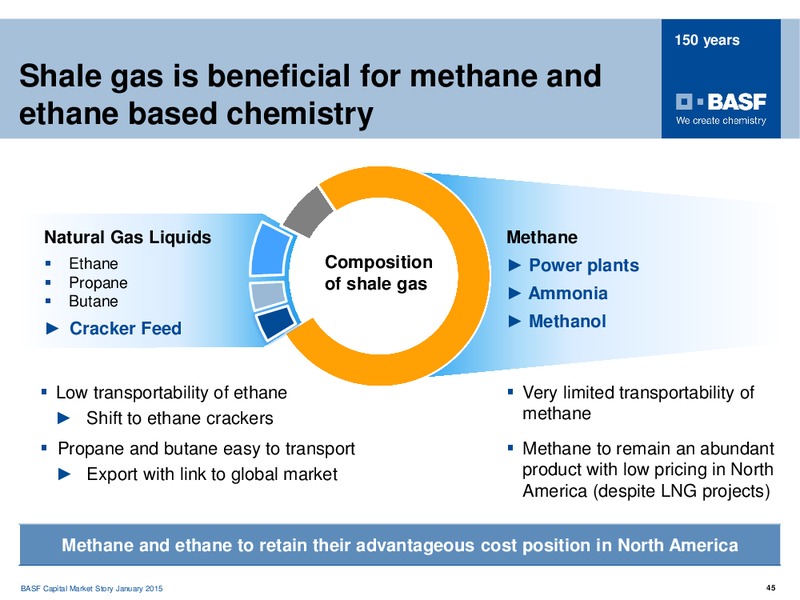
150 years Shale gas is beneficial for methane and ethane based chemistry Natural Gas Liquids Methane Ethane Composition Power plants Propane of shale gas Butane Ammonia Cracker Feed Methanol Low transportability of ethane Very…
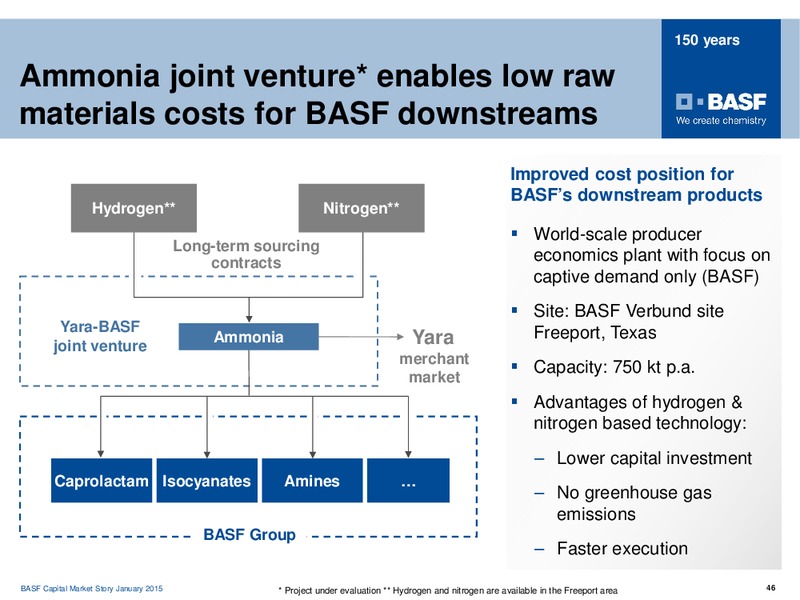
150 years Ammonia joint venture* enables low raw materials costs for BASF downstreams Improved cost position for BASFs downstream products Hydrogen** Nitrogen** World-scale producer Long-term sourcing contracts economics plant…
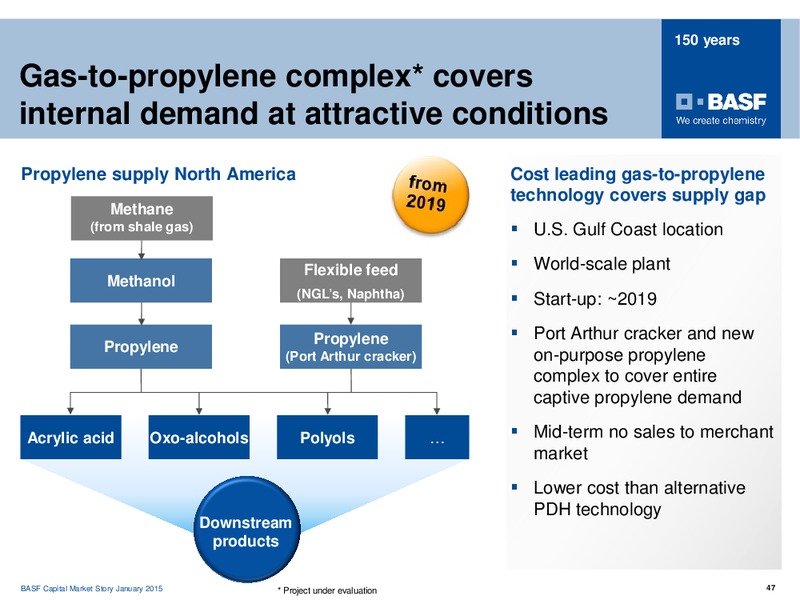
150 years Gas-to-propylene complex* covers internal demand at attractive conditions Propylene supply North America Cost leading gas-to-propylene technology covers supply gap Methane (from shale gas) U.S. Gulf Coast location…
Appendix II: Oil & Gas BASF Capital Market Story January 2015 48
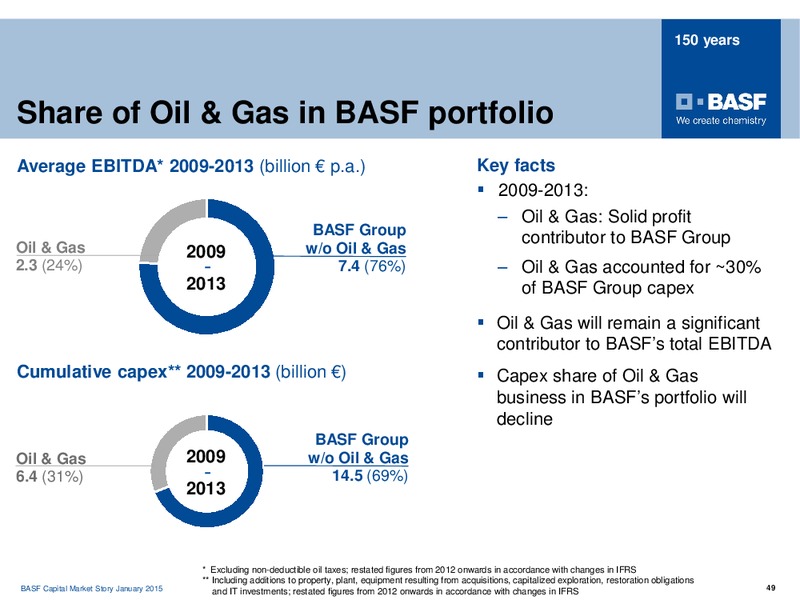
150 years Share of Oil & Gas in BASF portfolio Average EBITDA* 2009-2013 (billion p.a.) Key facts 2009-2013: Oil & Gas: Solid profit BASF Group contributor to BASF Group Oil & Gas 2009 w/o Oil & Gas 2.3 (24%) - 7.4 (76%) Oil &…
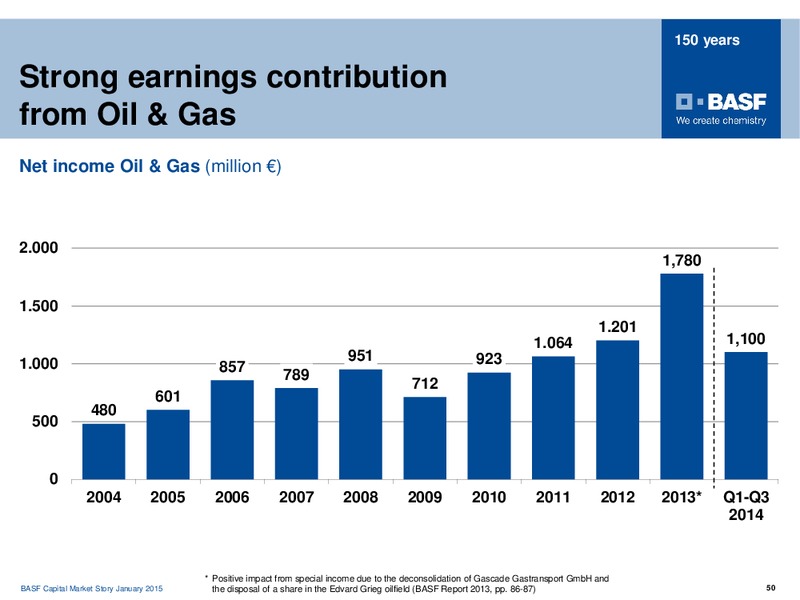
150 years Strong earnings contribution from Oil & Gas Net income Oil & Gas (million ) 2.000 1,780 1.500 1.201 1.064 1,100 1.000 951 923 857 789 712 601 480 500 0 2004 2005 2006 2007 2008 2009 2010 2011 2012 2013* Q1-Q3…
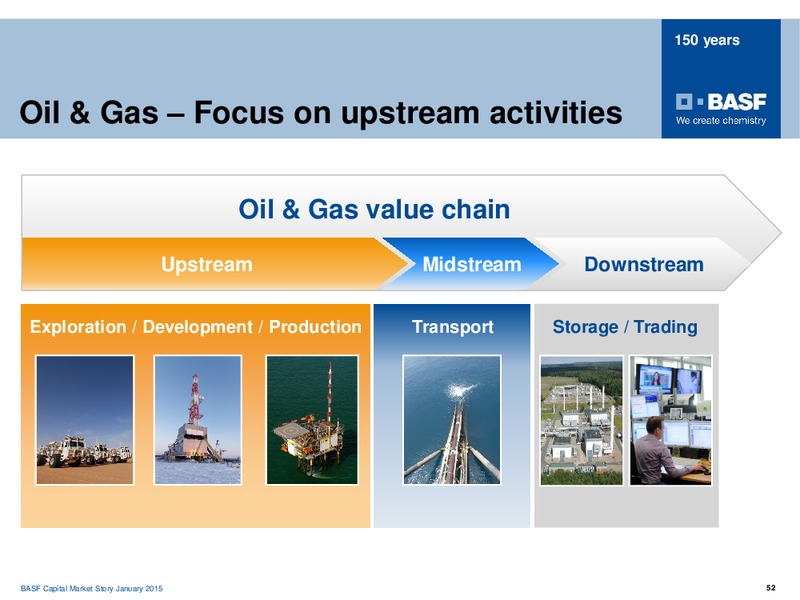
150 years Oil & Gas Focus on upstream activities Oil & Gas value chain Upstream Upstream Midstream Downstream Exploration / Development / Production Transport Storage / Trading BASF Capital Market Story January 2015 52
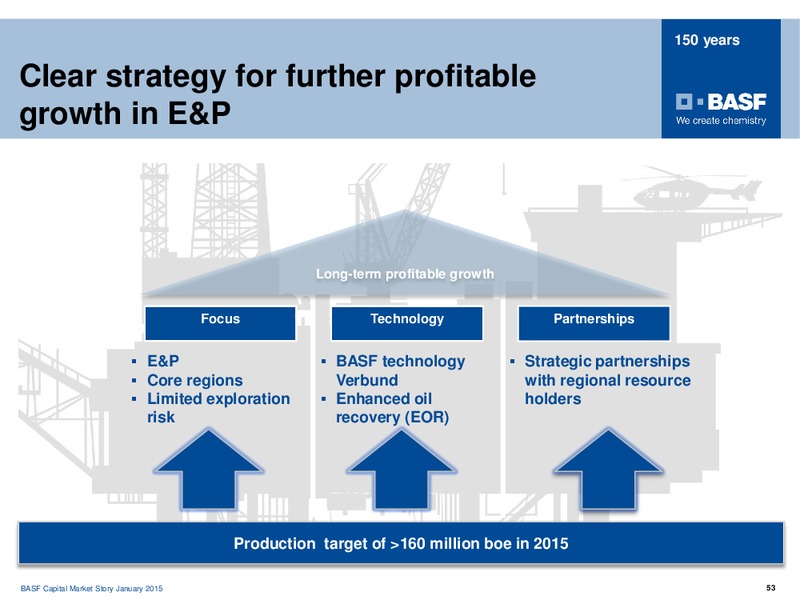
150 years Clear strategy for further profitable growth in E&P Long-term profitable growth Focus Technology Partnerships E&P BASF technology Strategic partnerships Core regions Verbund with regional resource Limited…
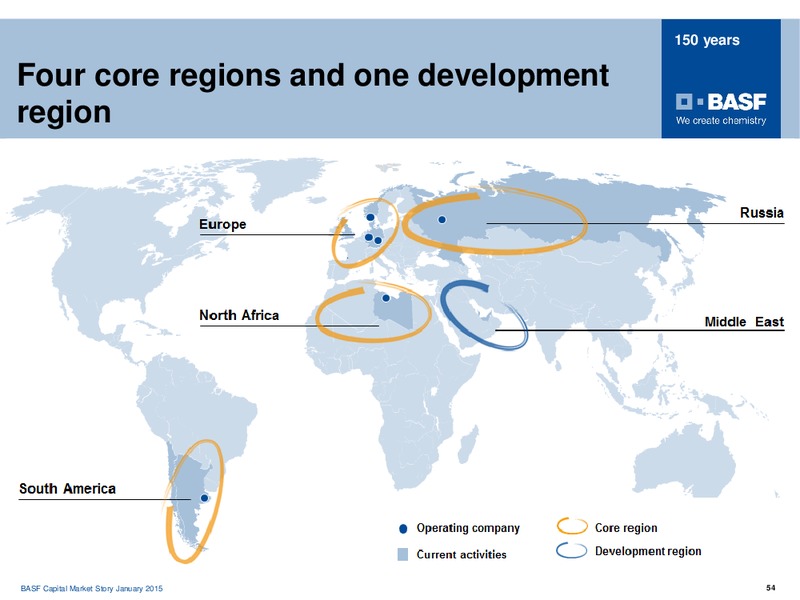
150 years Four core regions and one development region BASF Capital Market Story January 2015 54
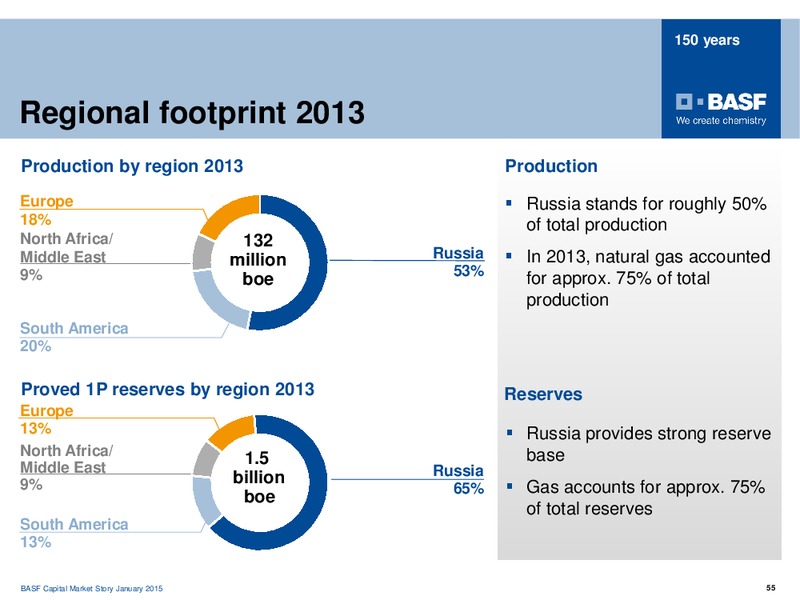
150 years Regional footprint 2013 Production by region 2013 Production Europe Russia stands for roughly 50% 18% of total production North Africa/ 132 Middle East million Russia In 2013, natural gas accounted 9% 53% boe for approx.…
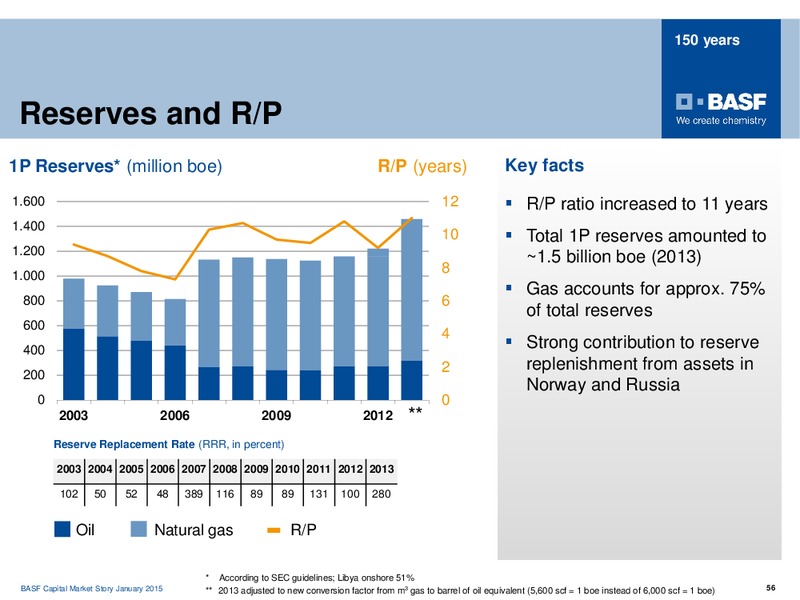
150 years Reserves and R/P 1P Reserves* (million boe) R/P (years) Key facts 1.600 12 R/P ratio increased to 11 years 1.400 10 Total 1P reserves amounted to 1.200 1.5 billion boe (2013) 8 1.000 Gas accounts for approx. 75% 800…
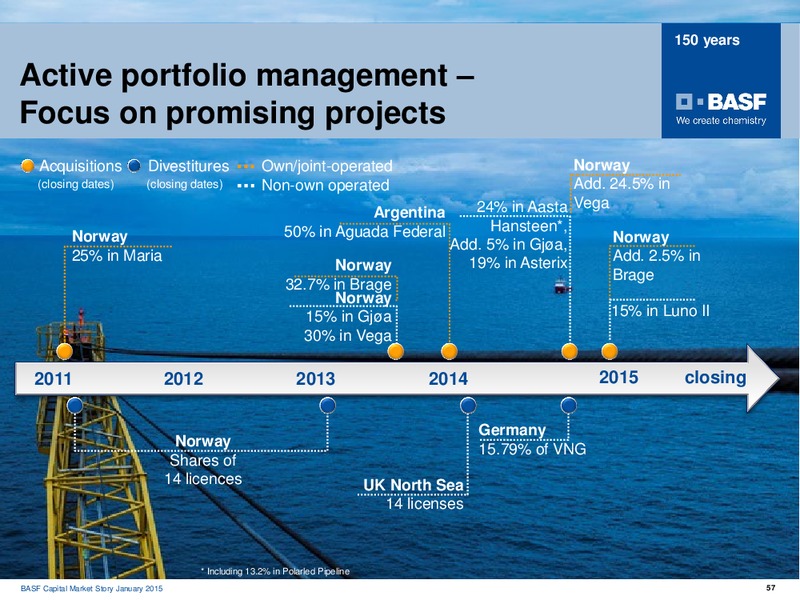
150 years Active portfolio management Focus on promising projects Acquisitions Divestitures Own/joint-operated Norway (closing dates) (closing dates) Non-own operated Add. 24.5% in Argentina 24% in Aasta Vega 50% in Aguada Federal…
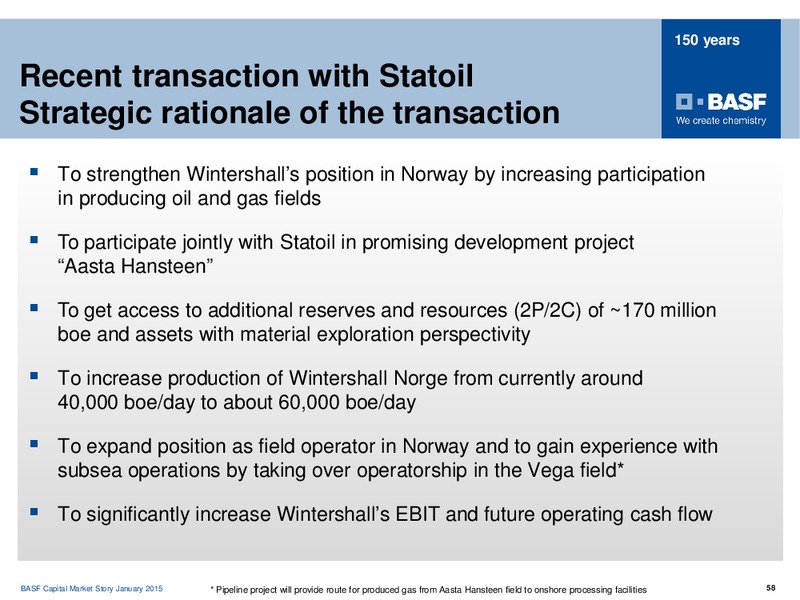
150 years Recent transaction with Statoil Strategic rationale of the transaction To strengthen Wintershalls position in Norway by increasing participation in producing oil and gas fields To participate jointly with Statoil in…
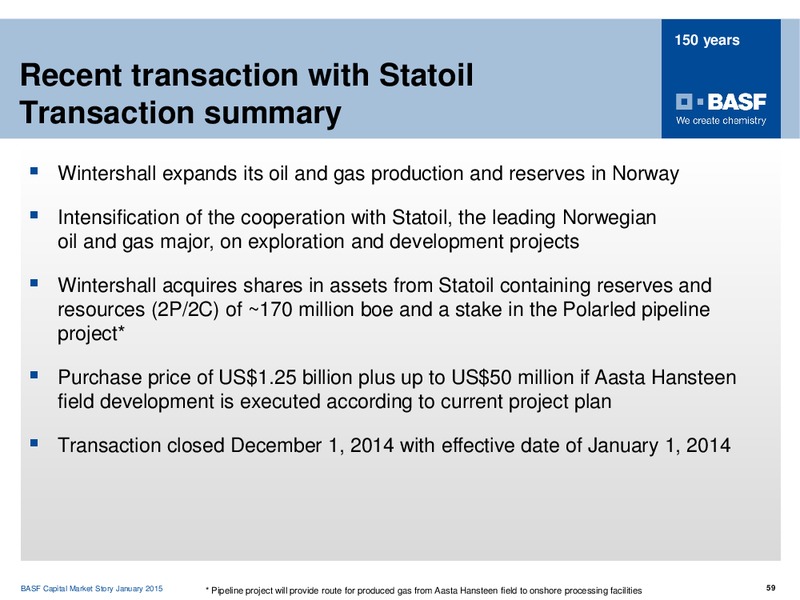
150 years Recent transaction with Statoil Transaction summary Wintershall expands its oil and gas production and reserves in Norway Intensification of the cooperation with Statoil, the leading Norwegian oil and gas major, on…
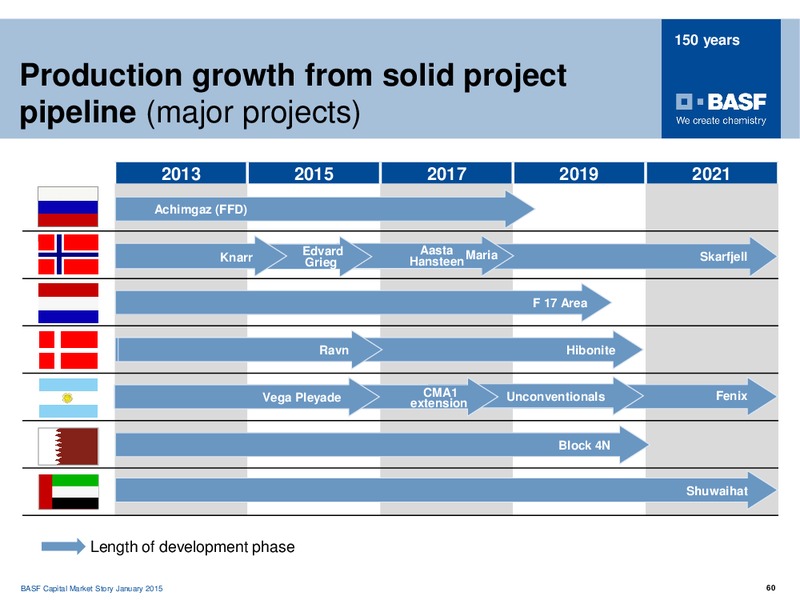
150 years Production growth from solid project pipeline (major projects) 2013 2015 2017 2019 2021 Achimgaz (FFD) Norway Edvard Aasta Maria Knarr Grieg Hansteen Skarfjell F 17 Area Ravn Hibonite Vega Pleyade CMA1…
150 years 150 years BASF Capital Market Story January 2015 61
 Loading...