Empowering customers. Shaping markets. Capital Market Story December 2014
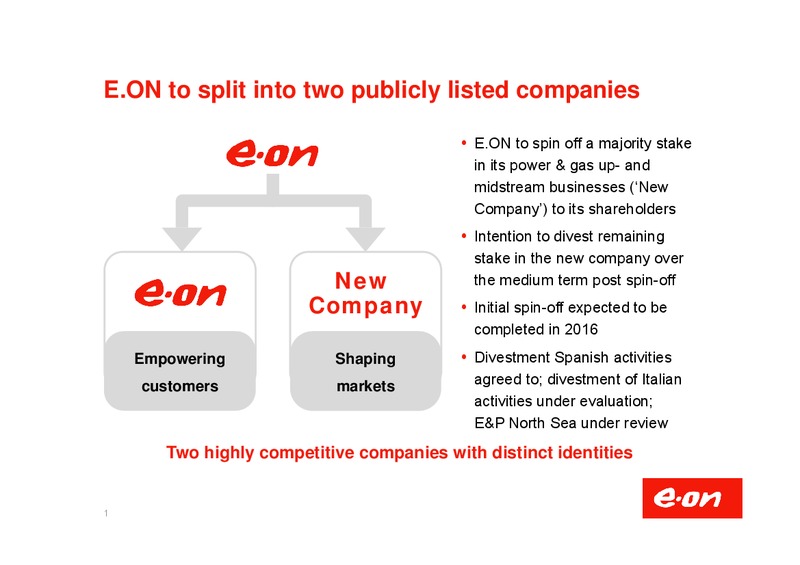
E.ON to split into two publicly listed companies E.ON to spin off a majority stake in its power & gas up- and midstream businesses (New Company) to its shareholders Intention to divest remaining stake in the new company over New…
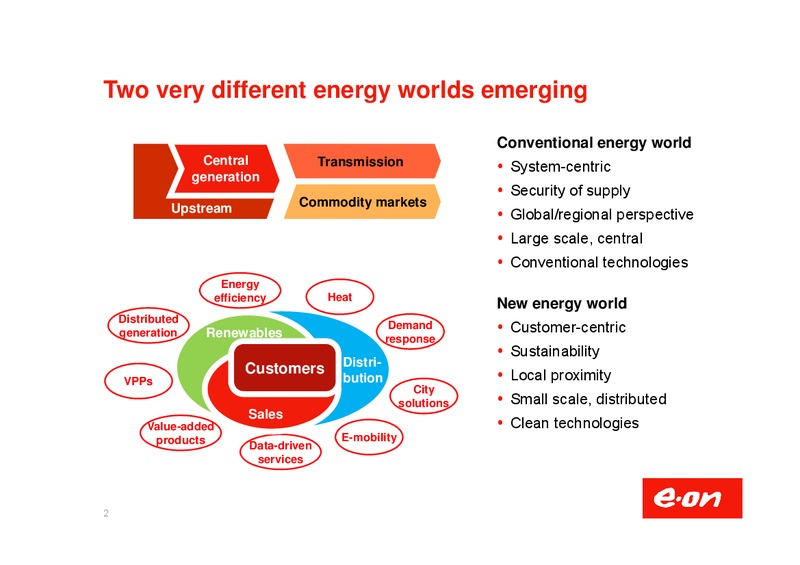
Two very different energy worlds emerging Conventional energy world Central Transmission System-centric generation Security of supply Upstream Commodity markets Global/regional perspective Large scale, central Conventional…
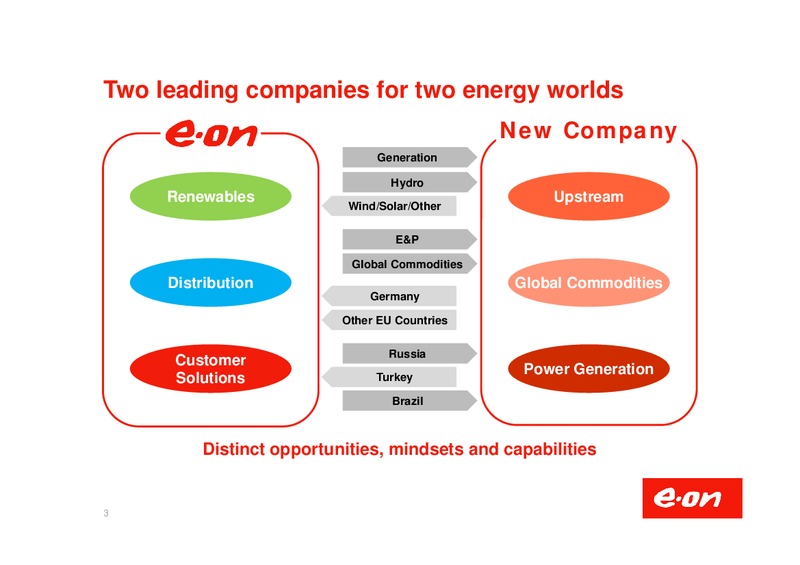
Two leading companies for two energy worlds New Company Generation Hydro Renewables Upstream Wind/Solar/Other E&P Global Commodities Distribution Global Commodities Germany Other EU Countries Russia Customer Power…
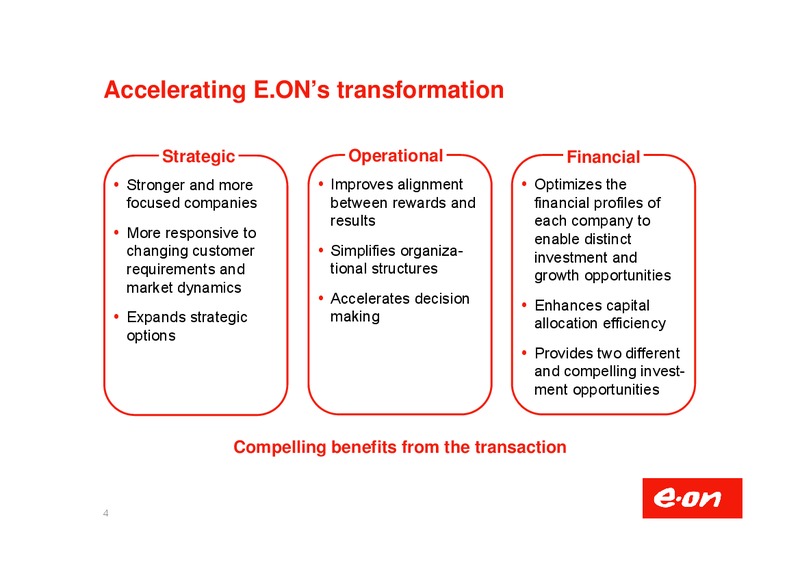
Accelerating E.ONs transformation Strategic Operational Financial Stronger and more Improves alignment Optimizes the focused companies between rewards and financial profiles of results each company to More responsive to enable…
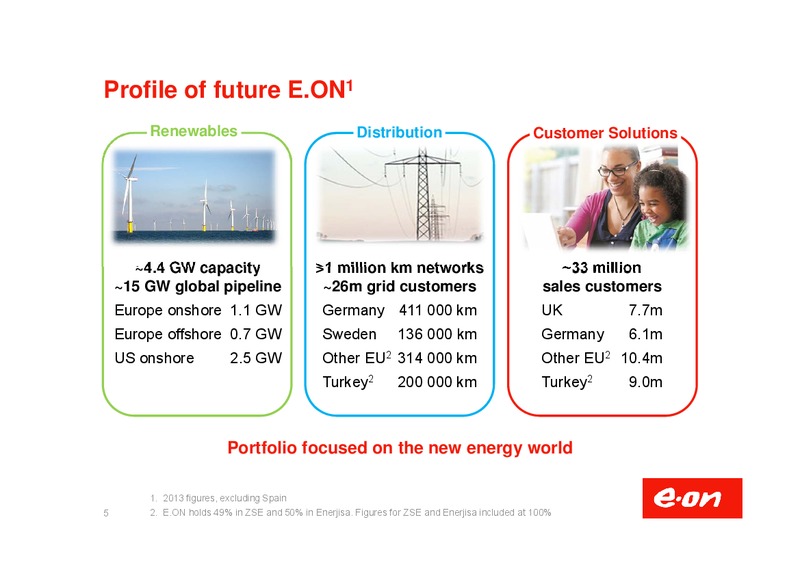
Profile of future E.ON1 Renewables Distribution Customer Solutions 4.4 GW capacity 1 million km networks 33 million 15 GW global pipeline 26m grid customers sales customers Europe onshore 1.1 GW Germany 411 000 km UK 7.7m Europe…
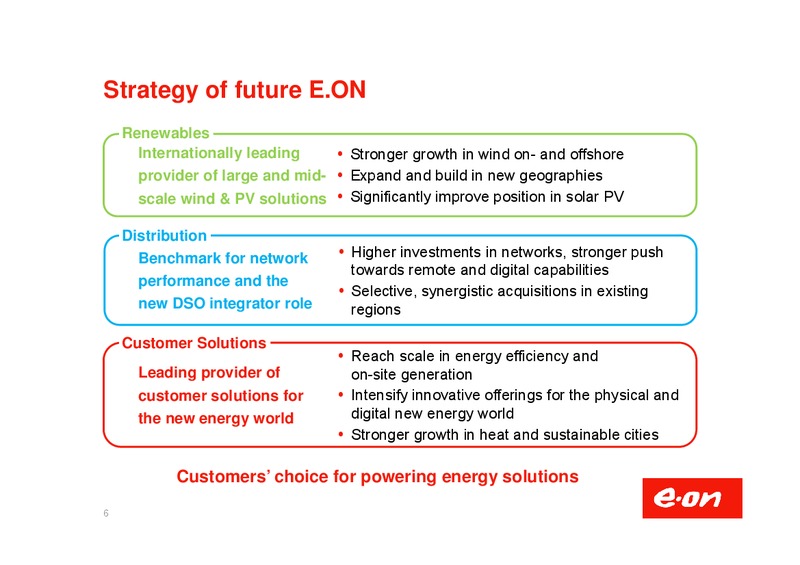
Strategy of future E.ON Renewables Internationally leading Stronger growth in wind on- and offshore provider of large and mid- Expand and build in new geographies scale wind & PV solutions Significantly improve position in solar PV…
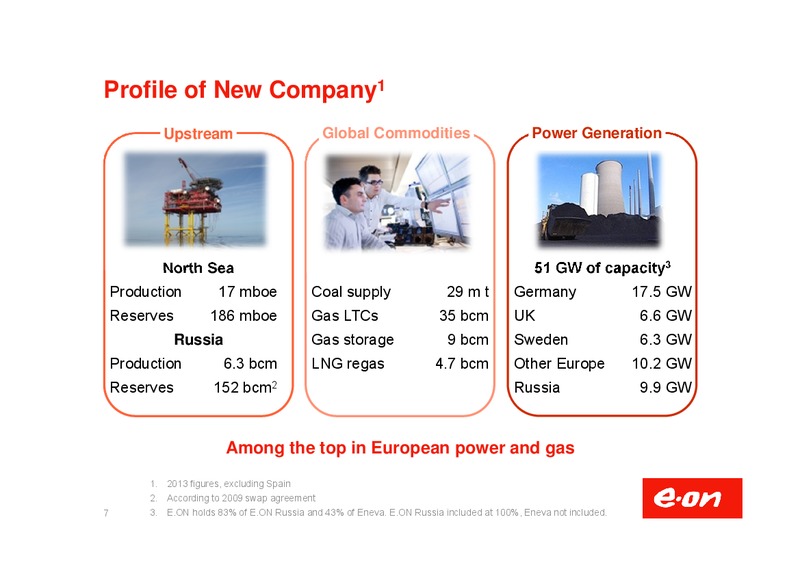
Profile of New Company1 Upstream Global Commodities Power Generation North Sea 51 GW of capacity3 Production 17 mboe Coal supply 29 m t Germany 17.5 GW Reserves 186 mboe Gas LTCs 35 bcm UK 6.6 GW Russia Gas storage 9 bcm Sweden…
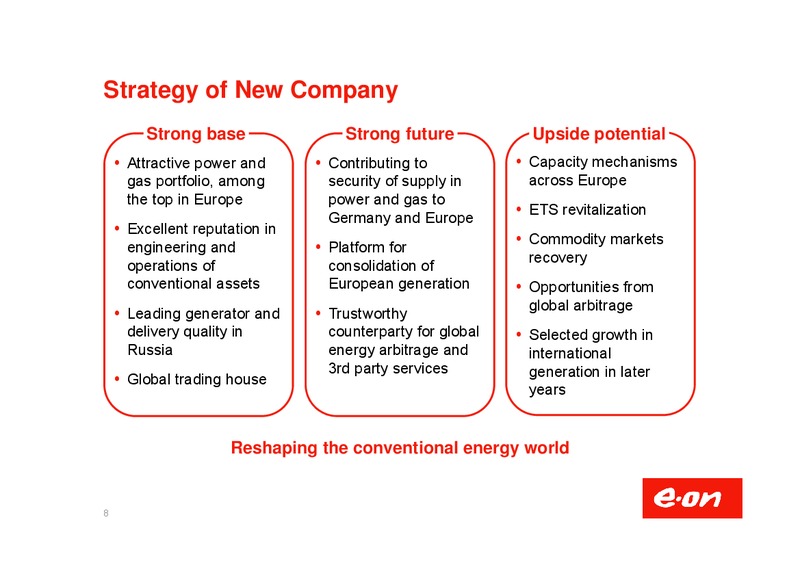
Strategy of New Company Strong base Strong future Upside potential Attractive power and Contributing to Capacity mechanisms gas portfolio, among security of supply in across Europe the top in Europe power and gas to ETS…
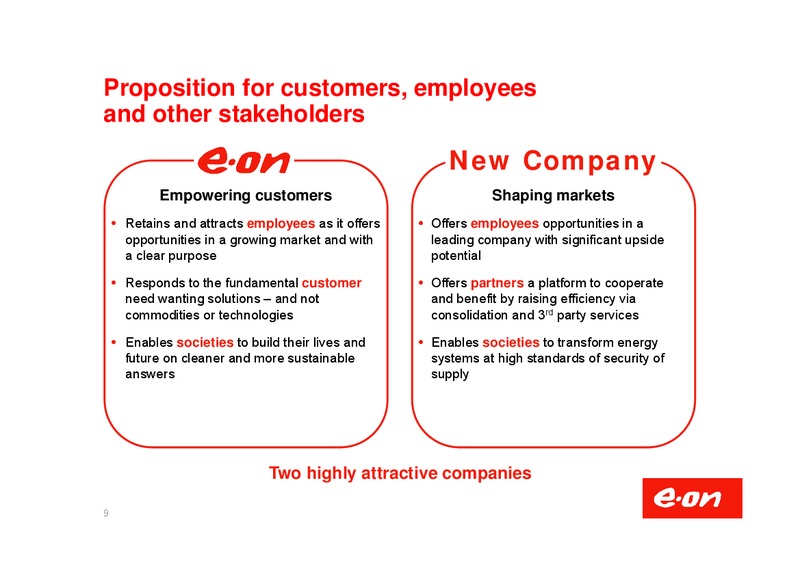
Proposition for customers, employees and other stakeholders New Company Empowering customers Shaping markets Retains and attracts employees as it offers Offers employees opportunities in a opportunities in a growing market and with…
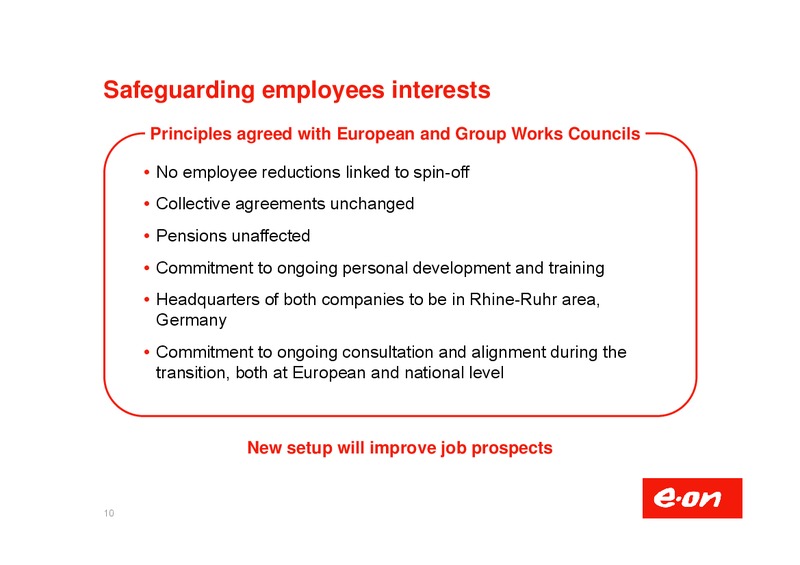
Safeguarding employees interests Principles agreed with European and Group Works Councils No employee reductions linked to spin-off Collective agreements unchanged Pensions unaffected Commitment to ongoing personal development and…
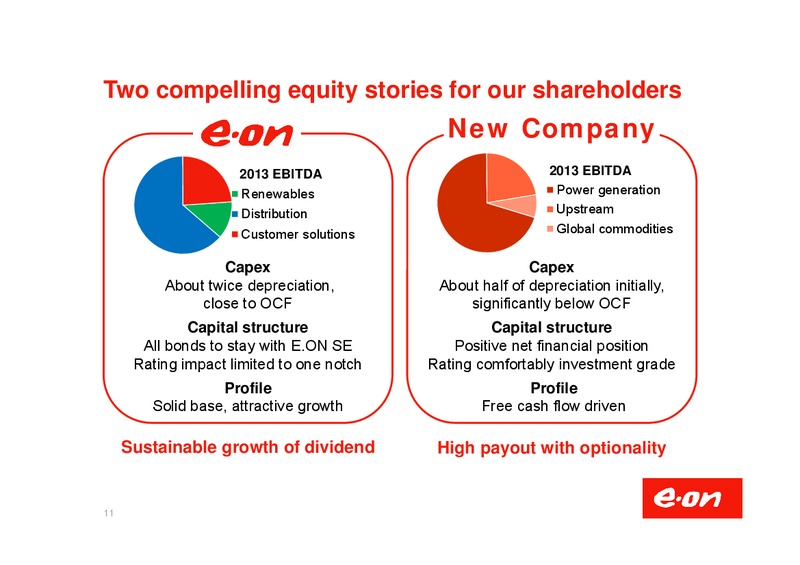
Two compelling equity stories for our shareholders New Company 2013 EBITDA 2013 EBITDA Renewables Power generation Distribution Upstream Customer solutions Global commodities Capex Capex About twice depreciation, About half of…
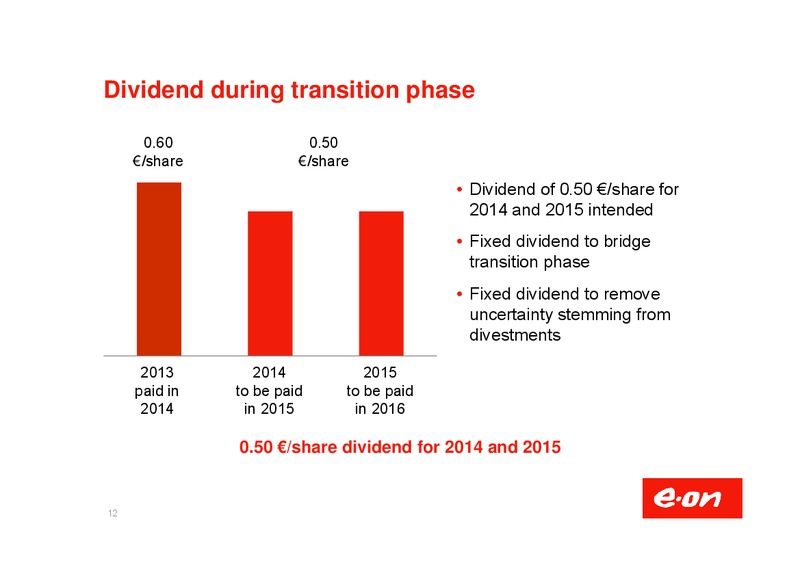
Dividend during transition phase 0.60 0.50 /share /share Dividend of 0.50 /share for 2014 and 2015 intended Fixed dividend to bridge transition phase Fixed dividend to remove uncertainty stemming from divestments 2013 2014…
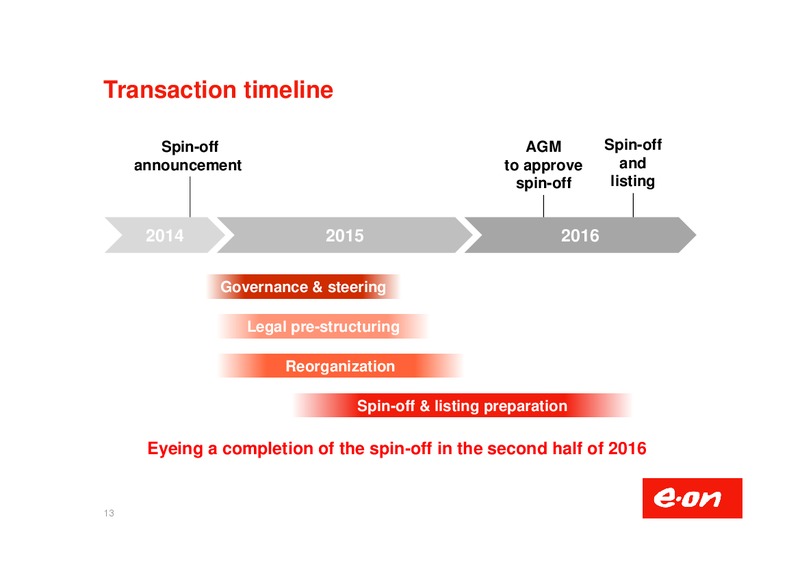
Transaction timeline Spin-off AGM Spin-off announcement to approve and spin-off listing 2014 2015 2016 Governance & steering Legal pre-structuring Reorganization Spin-off & listing preparation Eyeing a completion of the…
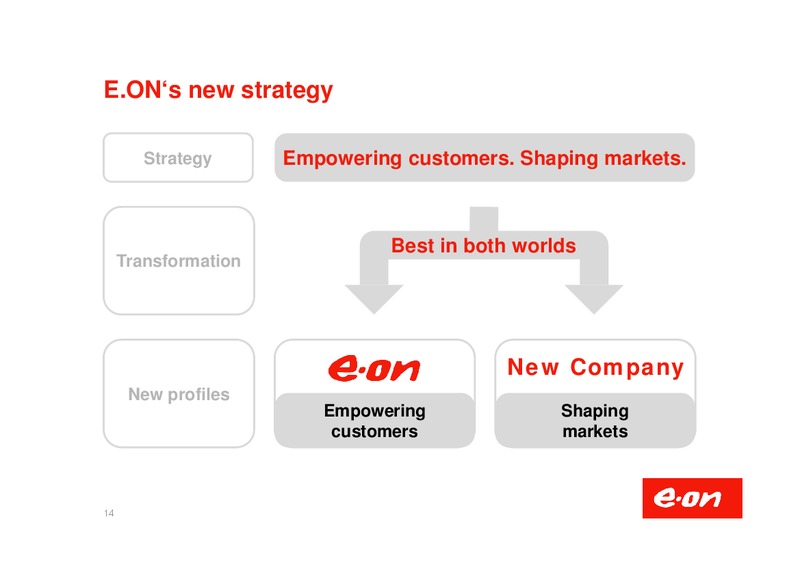
E.ONs new strategy Strategy Empowering customers. Shaping markets. Best in both worlds Transformation New Company New profiles Empowering Shaping customers markets 14
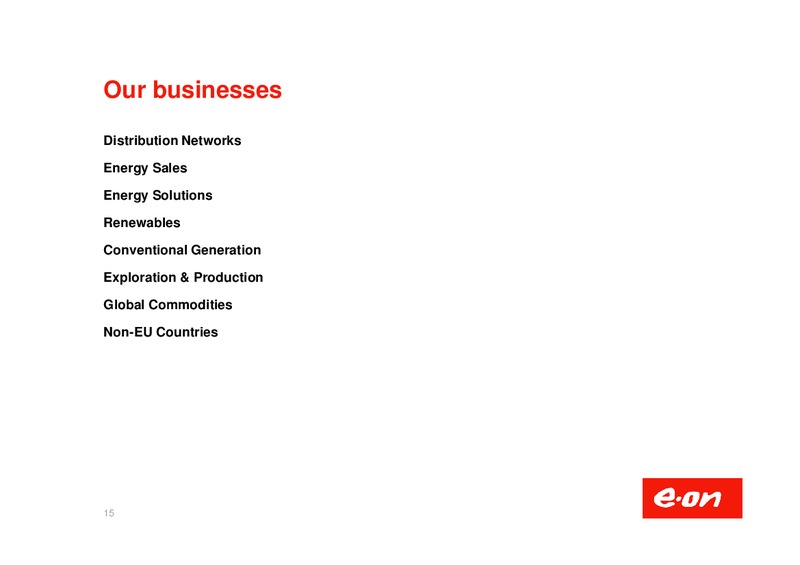
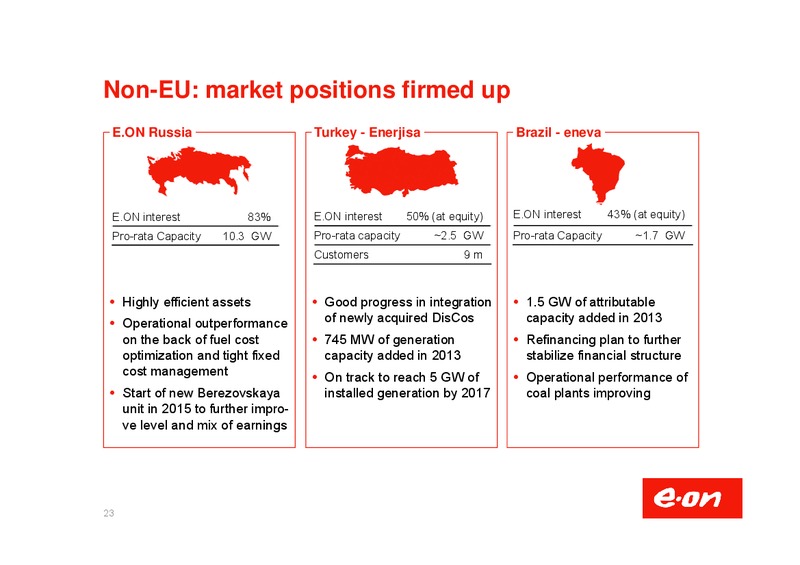
Our businesses Distribution Networks Energy Sales Energy Solutions Renewables Conventional Generation Exploration & Production Global Commodities Non-EU Countries 15
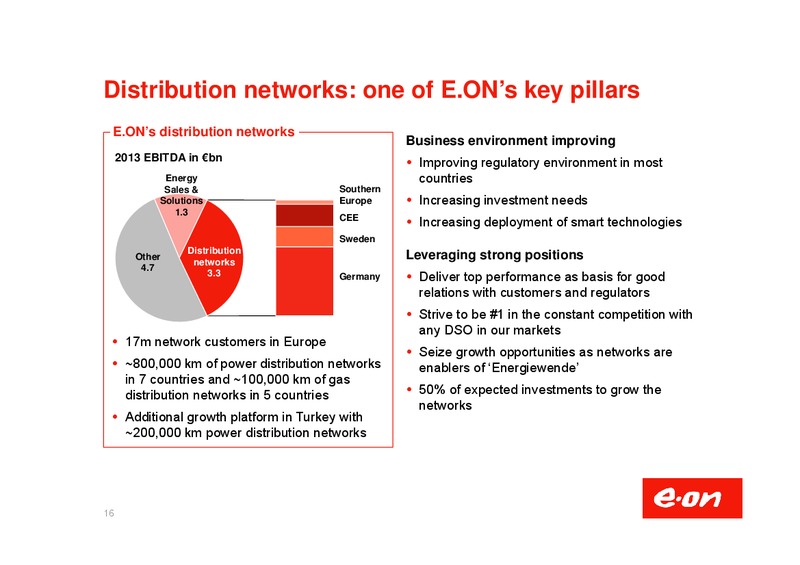
Distribution networks: one of E.ONs key pillars E.ONs distribution networks Business environment improving 2013 EBITDA in bn Improving regulatory environment in most Energy countries Sales & Southern Solutions Europe Increasing…
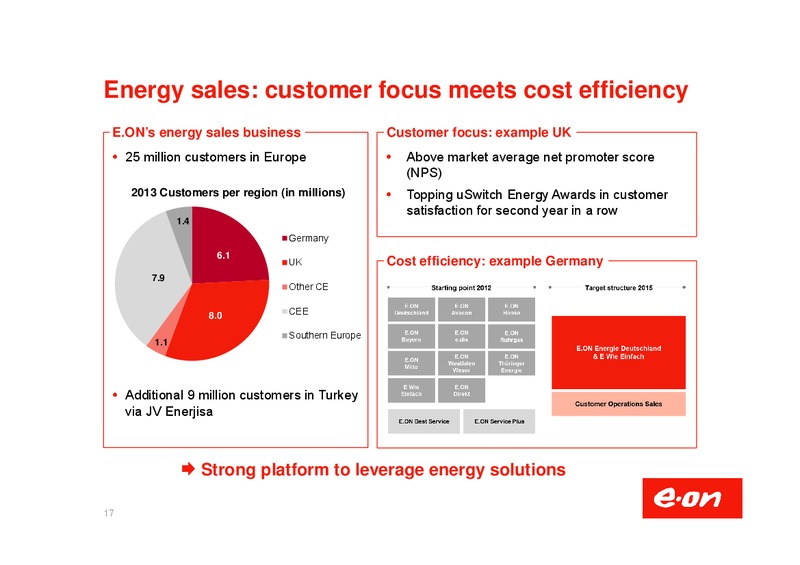
Energy sales: customer focus meets cost efficiency E.ONs energy sales business Customer focus: example UK 25 million customers in Europe Above market average net promoter score (NPS) 2013 Customers per region (in millions) Topping…
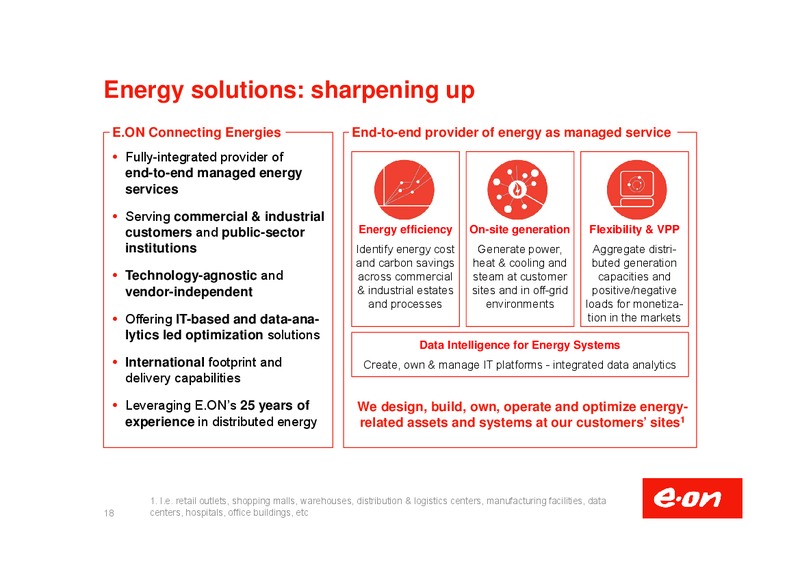
Energy solutions: sharpening up E.ON Connecting Energies End-to-end provider of energy as managed service Fully-integrated provider of end-to-end managed energy services Serving commercial & industrial customers and public-sector…
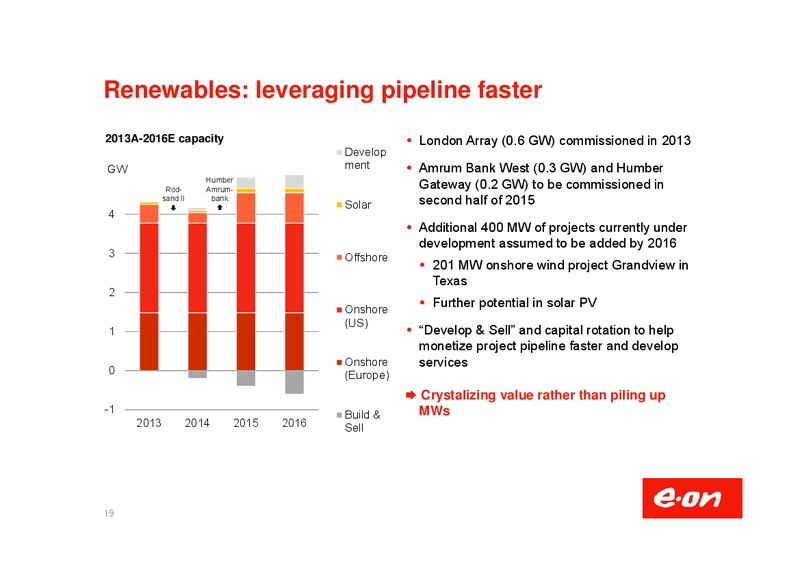
Renewables: leveraging pipeline faster 2013A-2016E capacity London Array (0.6 GW) commissioned in 2013 Develop GW ment Amrum Bank West (0.3 GW) and Humber Humber Rd- Amrum- Gateway (0.2 GW) to be commissioned in sand II bank Solar…
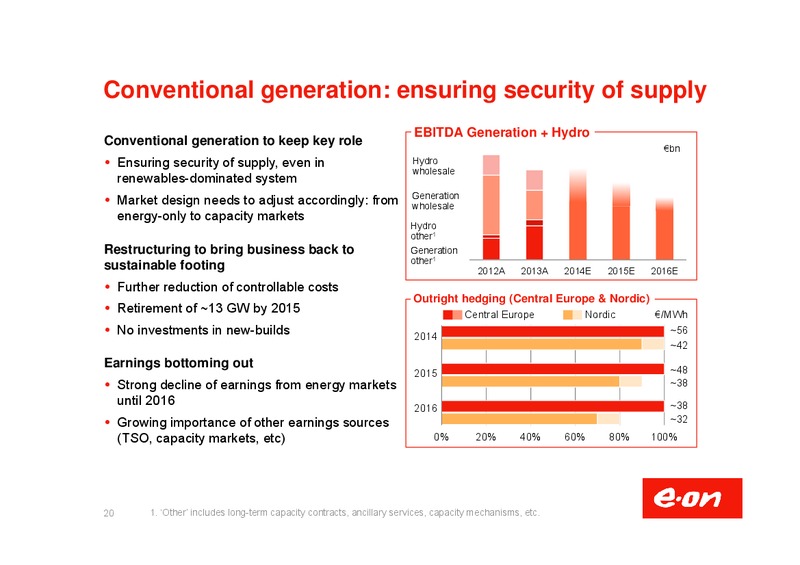
Conventional generation: ensuring security of supply EBITDA Generation + Hydro Conventional generation to keep key role bn Ensuring security of supply, even in Hydro wholesale renewables-dominated system Generation Market design…
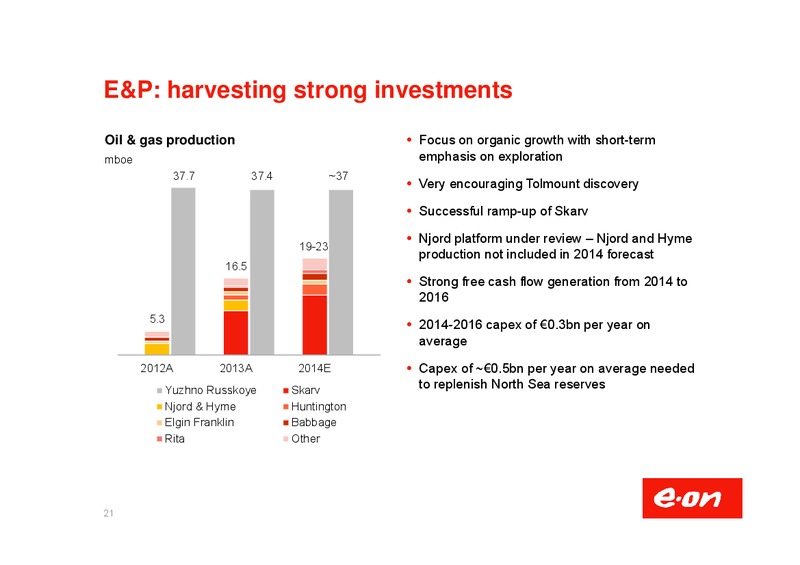
E&P: harvesting strong investments Oil & gas production Focus on organic growth with short-term mboe emphasis on exploration 37.7 37.4 37 Very encouraging Tolmount discovery Successful ramp-up of Skarv Njord platform under review…
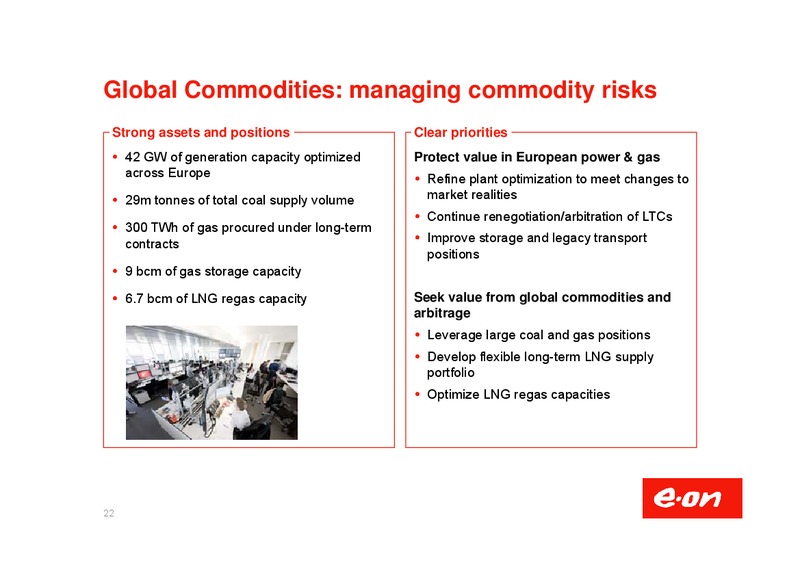
Global Commodities: managing commodity risks Strong assets and positions Clear priorities 42 GW of generation capacity optimized Protect value in European power & gas across Europe Refine plant optimization to meet changes to 29m…
Backup Outlook Financials Economic net debt Dividend Operations IR contacts Reporting calendar & Important links 24
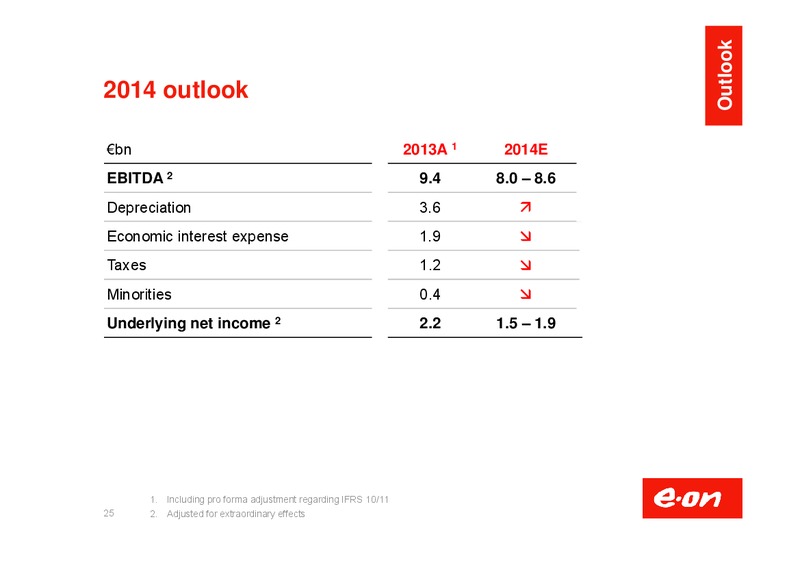
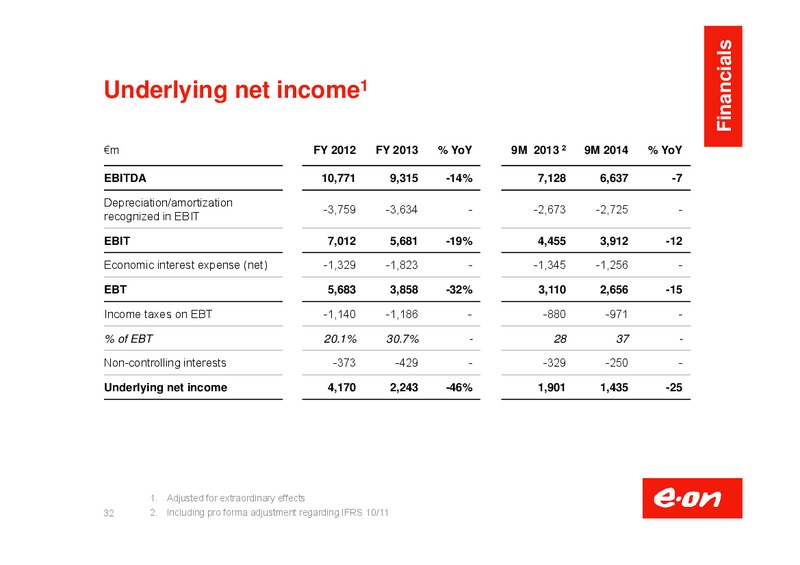
Outlook 2014 outlook bn 2013A 1 2014E EBITDA 2 9.4 8.0 8.6 Depreciation 3.6 Economic interest expense 1.9 Taxes 1.2 Minorities 0.4 Underlying net income 2 2.2 1.5 1.9 1. Including pro forma adjustment regarding IFRS 10/11 25 2.…
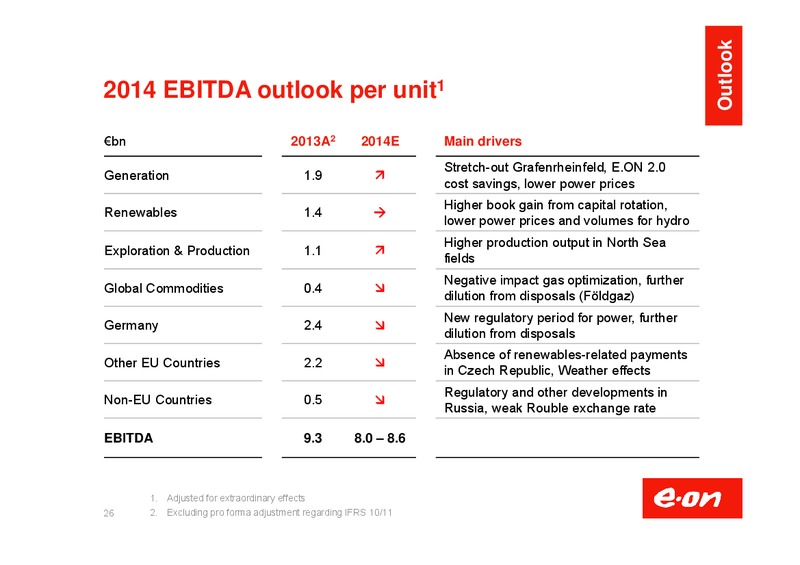
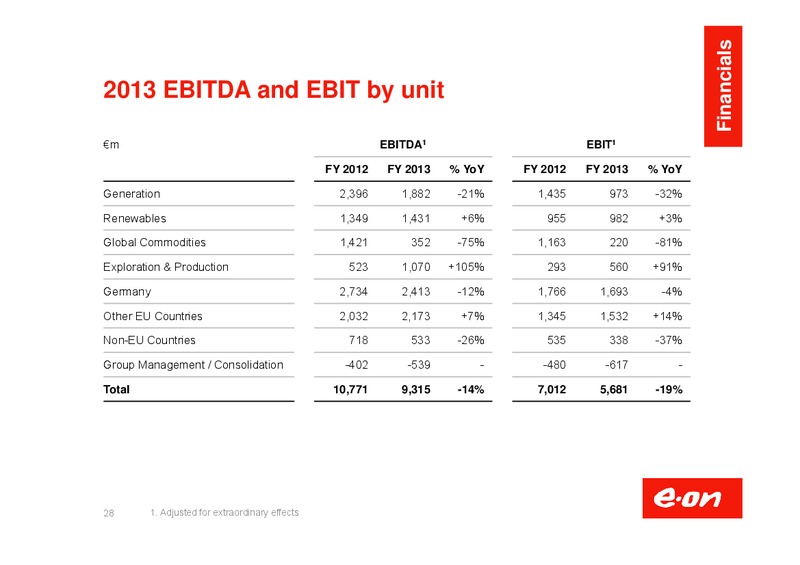
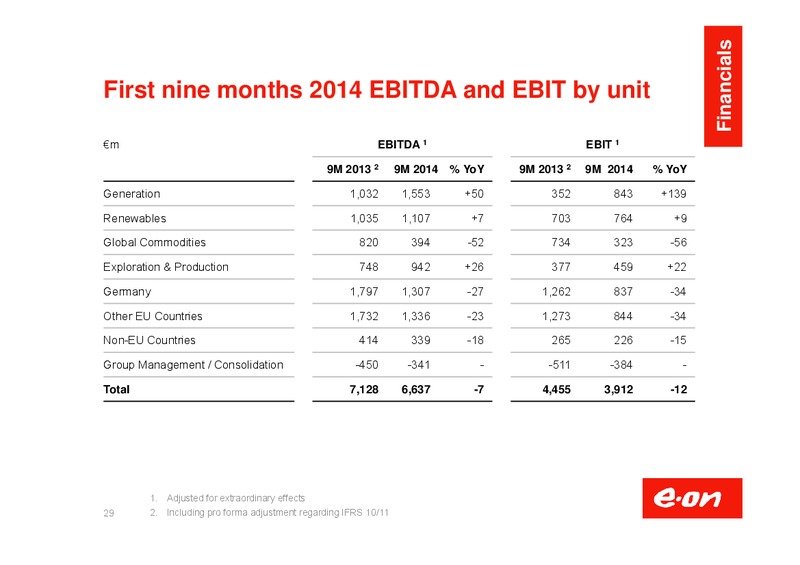
Outlook 2014 EBITDA outlook per unit1 bn 2013A2 2014E Main drivers Stretch-out Grafenrheinfeld, E.ON 2.0 Generation 1.9 cost savings, lower power prices Higher book gain from capital rotation, Renewables 1.4 lower power prices and…
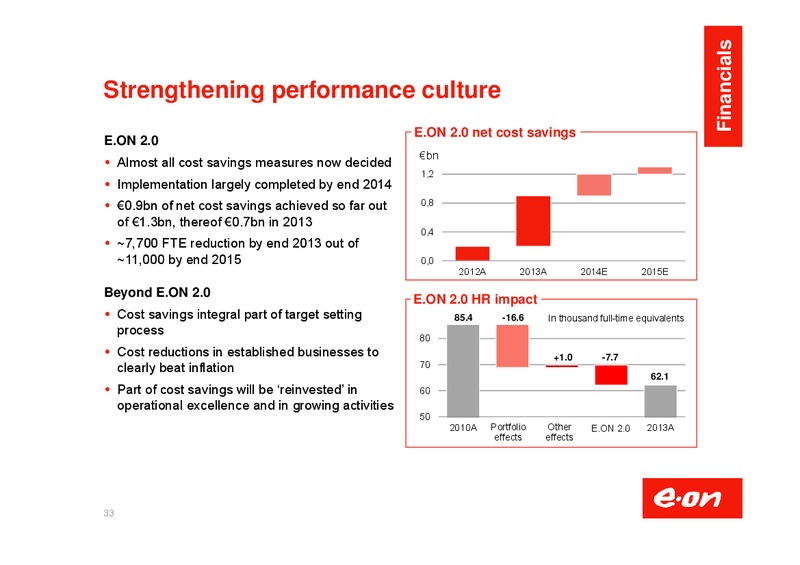
Financials Strengthening performance culture E.ON 2.0 net cost savings E.ON 2.0 bn Almost all cost savings measures now decided 1,2 Implementation largely completed by end 2014 0.9bn of net cost savings achieved so far out 0,8 of…
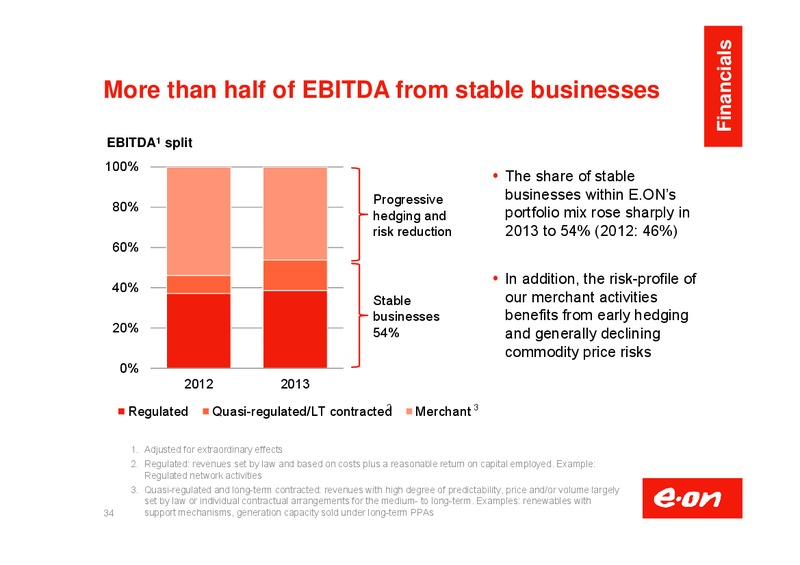
Financials More than half of EBITDA from stable businesses EBITDA1 split 100% The share of stable Progressive businesses within E.ONs 80% portfolio mix rose sharply in hedging and risk reduction 2013 to 54% (2012: 46%) 60% In…
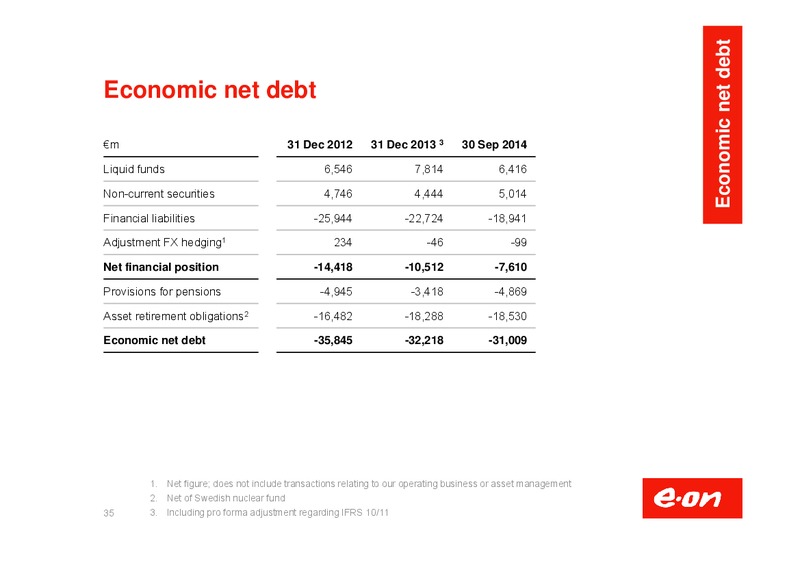
Economic net debt Economic net debt m 31 Dec 2012 31 Dec 2013 3 30 Sep 2014 Liquid funds 6,546 7,814 6,416 Non-current securities 4,746 4,444 5,014 Financial liabilities -25,944 -22,724 -18,941 Adjustment FX hedging1 234 -46 -99…
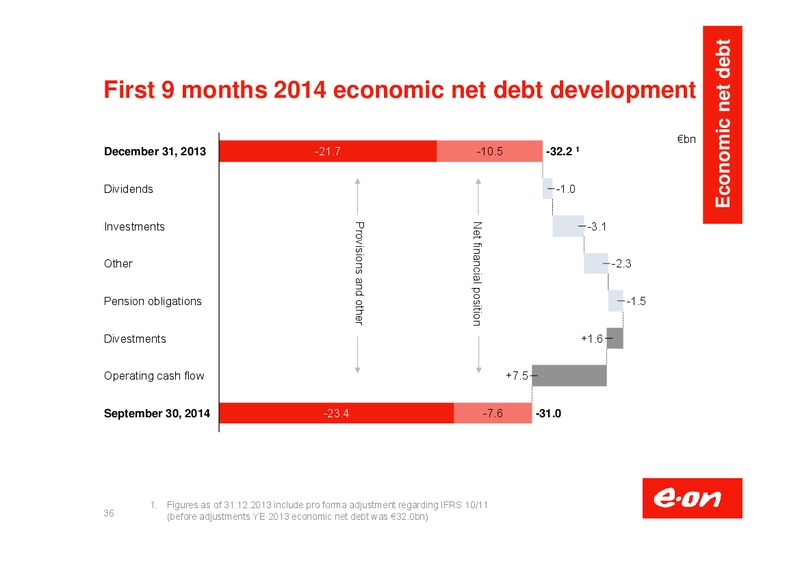
Economic net debt First 9 months 2014 economic net debt development bn December 31, 2013 -21.7 -10.5 -32.2 1 Dividends -1.0 Investments -3.1 Net financial position Provisions and other Other -2.3 Pension obligations -1.5…
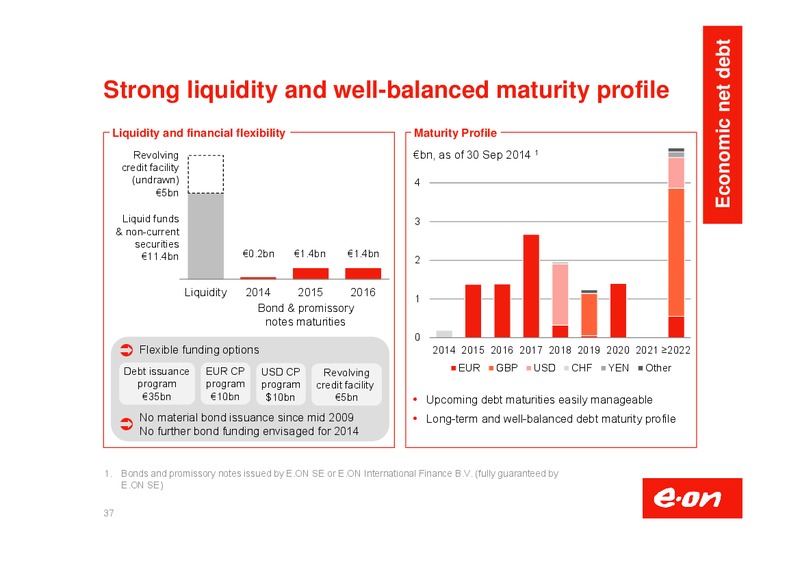
Economic net debt Strong liquidity and well-balanced maturity profile Liquidity and financial flexibility Maturity Profile Revolving bn, as of 30 Sep 2014 1 credit facility (undrawn) 4 5bn Liquid funds 3 & non-current…
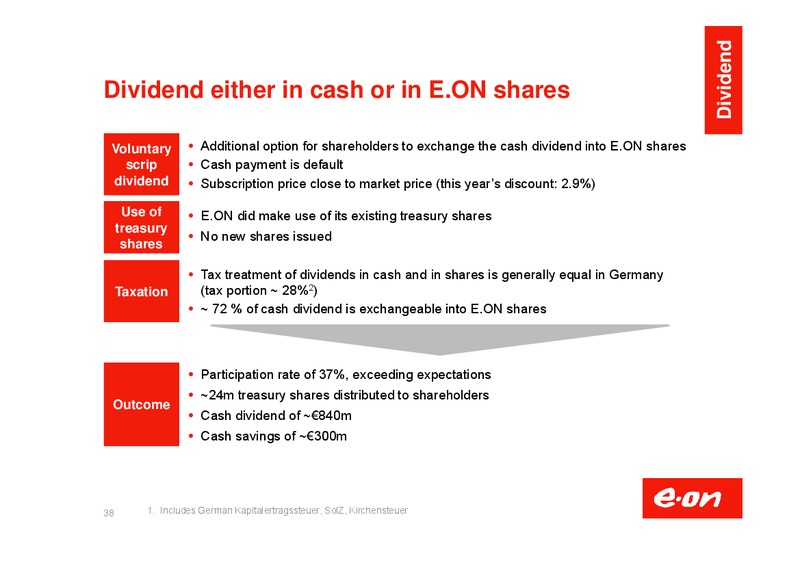
Dividend Dividend either in cash or in E.ON shares Voluntary Additional option for shareholders to exchange the cash dividend into E.ON shares scrip Cash payment is default dividend Subscription price close to market price (this…
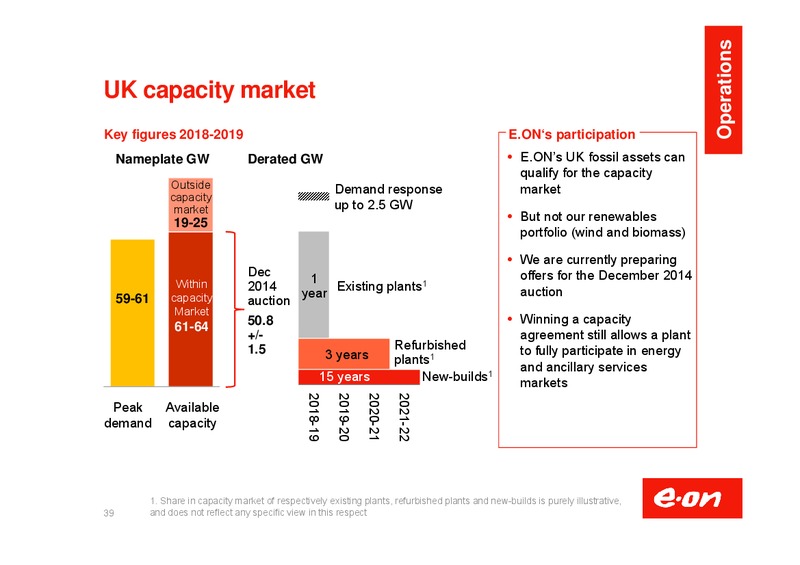
Operations UK capacity market Key figures 2018-2019 E.ONs participation Nameplate GW Derated GW E.ONs UK fossil assets can qualify for the capacity Outside Demand response market capacity market up to 2.5 GW But not our renewables…
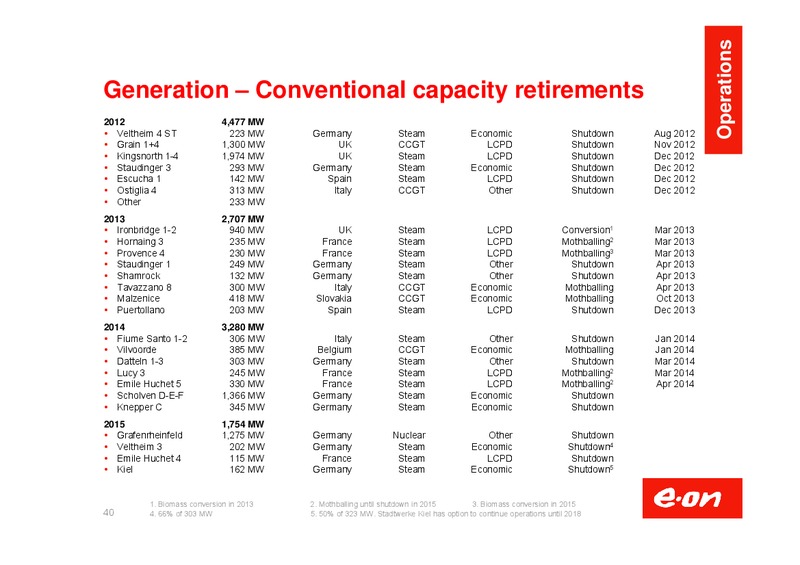
Operations Generation Conventional capacity retirements 2012 4,477 MW Veltheim 4 ST 223 MW Germany Steam Economic Shutdown Aug 2012 Grain 1+4 1,300 MW UK CCGT LCPD Shutdown Nov 2012 Kingsnorth 1-4 1,974 MW UK Steam LCPD Shutdown Dec…
E.ON Investor Relations Contact Dr. Marc Spieker Head of IR T+49 2 11-45 79-3 45 marc.spiekereon.com Peter Blankenhorn Regions / Sales T +49 2 11-45 79-4 81 SRI, Retail peter.blankenhorneon.com Franois Poullet Generation T +49 2…
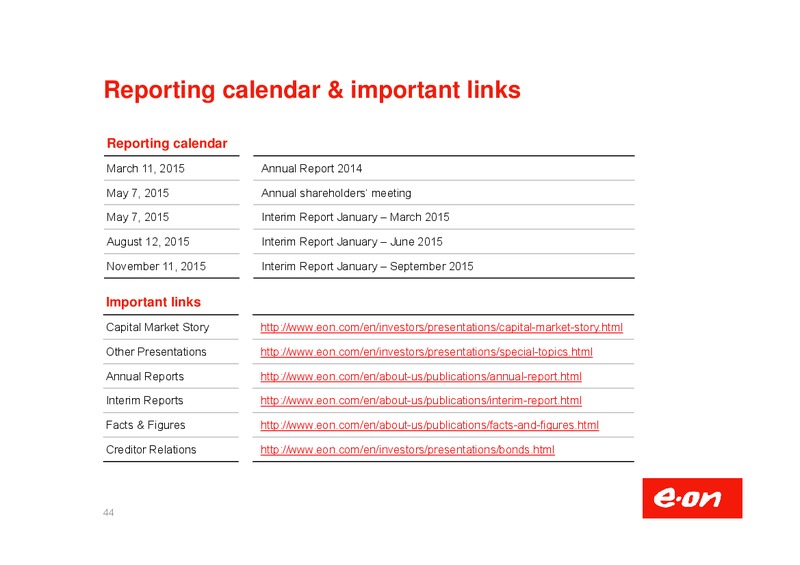
Reporting calendar & important links Reporting calendar March 11, 2015 Annual Report 2014 May 7, 2015 Annual shareholders meeting May 7, 2015 Interim Report January March 2015 August 12, 2015 Interim Report January June 2015 November…
 Loading...