Fourth Quarter 2013 Results ING posts 4Q13 underlying net profit of EUR 405 mln Ralph Hamers CEO Amsterdam 12 February 2014 www.ing.com
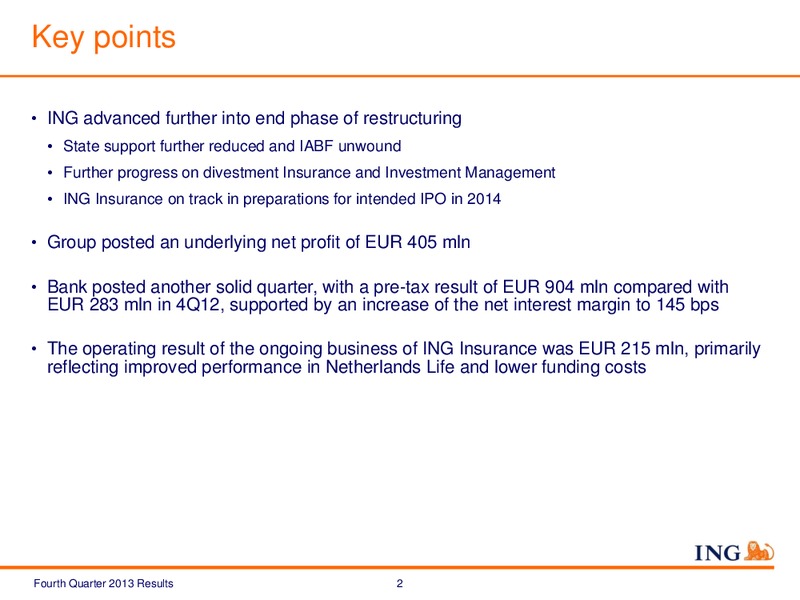
Key points ING advanced further into end phase of restructuring State support further reduced and IABF unwound Further progress on divestment Insurance and Investment Management ING Insurance on track in preparations for intended IPO…
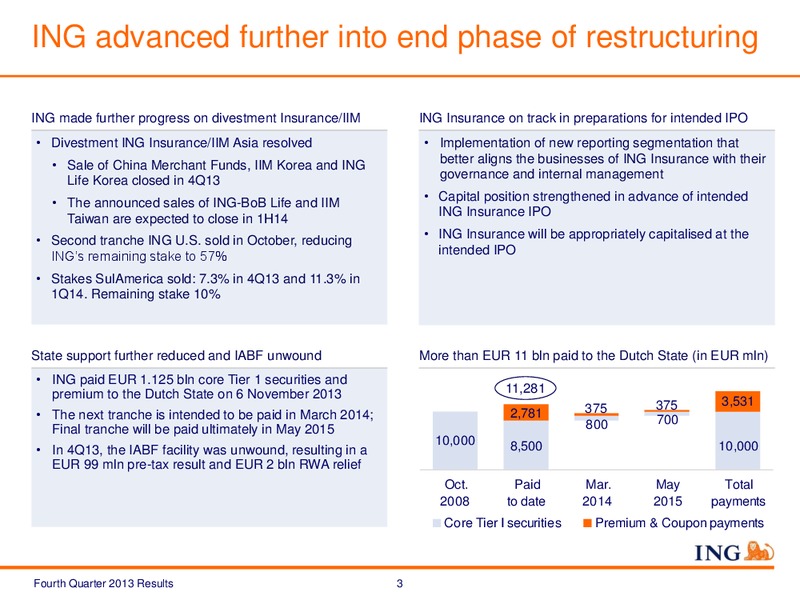
ING advanced further into end phase of restructuring ING made further progress on divestment Insurance/IIM ING Insurance on track in preparations for intended IPO Divestment ING Insurance/IIM Asia resolved Implementation of new…
Capital position strengthened in advance of intended ING Insurance IPO ING Insurance gross debt and cash capital (in EUR bln) Solvency I ratio NN Life, based on DNB Swap curve (in %) 234% 4.9 23% 221% 3.9 3.9 15% 183% 1.4 0.5…
ING Insurance will be appropriately capitalised at the intended IPO The capital position of ING Insurance is assessed on solvency, leverage and holding company buffer Currently all operating entities are adequately capitalized Holding…
Double leverage covered by (market) value ING US, SulAmerica and ING Insurance Group double leverage comfortably covered by (market) value ING U.S., SulAmerica and ING Insurance (in EUR bln) 4.8 -0.8 1.0 5.0 -3.7 -0.1 -0.3 3Q13…
ING reached agreement to make Defined Benefit Pension Fund financially independent Pension agreement will have strong benefits for ING* Financial impact in 1Q14* ING Group will be released from all financial P/L impact (after tax) (in…
2013 results Fourth Quarter 2013 Results 8
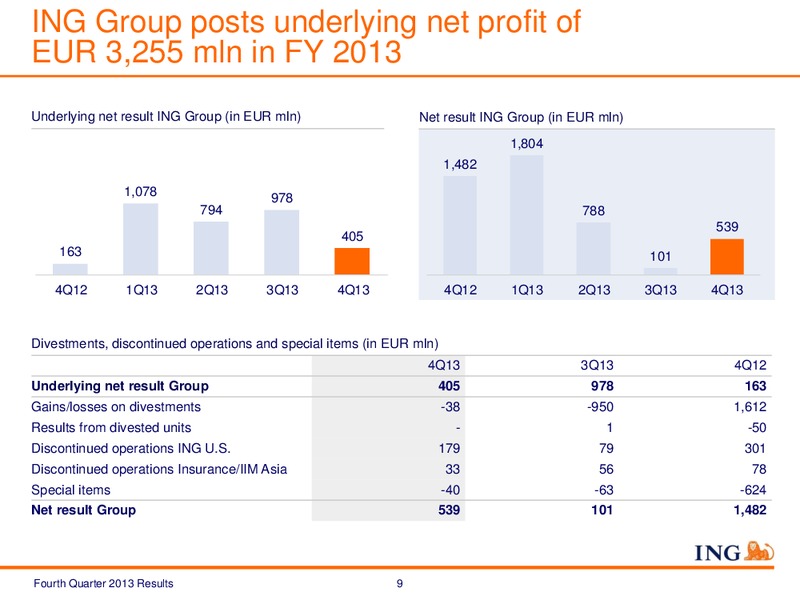
ING Group posts underlying net profit of EUR 3,255 mln in FY 2013 Underlying net result ING Group (in EUR mln) Net result ING Group (in EUR mln) 1,804 1,482 1,078 978 794 788 539 405 163 101 4Q12 1Q13 2Q13 3Q13 4Q13 4Q12 1Q13…
ING Bank posted another solid quarter Bank results (in EUR mln) Addition to Underlying result Gross result + loan loss provisions = before tax 1,730 1,762 1,655 1,464 1,169 1,147 1,103 904 871 283 -589 -561 -616 -552 -560…
Net interest margin increased further to 145 bps Underlying interest margin by quarter (in bps) Financial Markets contribution to NIM can be volatile 3,006 2,936 2,946 Financial markets impact on NIM Q-on-Q (in bps) 2,867 2,916 2…
Net lending increased in both Retail and Commercial Banking Lending Assets ING Bank (EUR bln)* Retail Banking: EUR +1.6 bln Commercial Banking: EUR +0.4 bln 1.5 1.5 -1.2 0.8 -0.7 -3.6 493.8 -1.8 1.1 0.8 -2.8 489.4 30/09/13…
Operating expenses remain flat Underlying operating expenses (in EUR mln) Expenses flat over the years (in EUR mln) 0.5% 175 149 8,745 8,638 8,694 8,700 2,165 2,133 2,090 2,120 2,202 2011 2012 2013 2015 4Q12 1Q13 2Q13 3Q13…
Restructuring programmes on track to reach cost savings of EUR 880 mln by 2015 Restructuring programmes (in EUR mln) Remaining Total cost Total FTE Cost savings cost savings savings reduction Announced achieved by 2015 by 2015 by 2015…
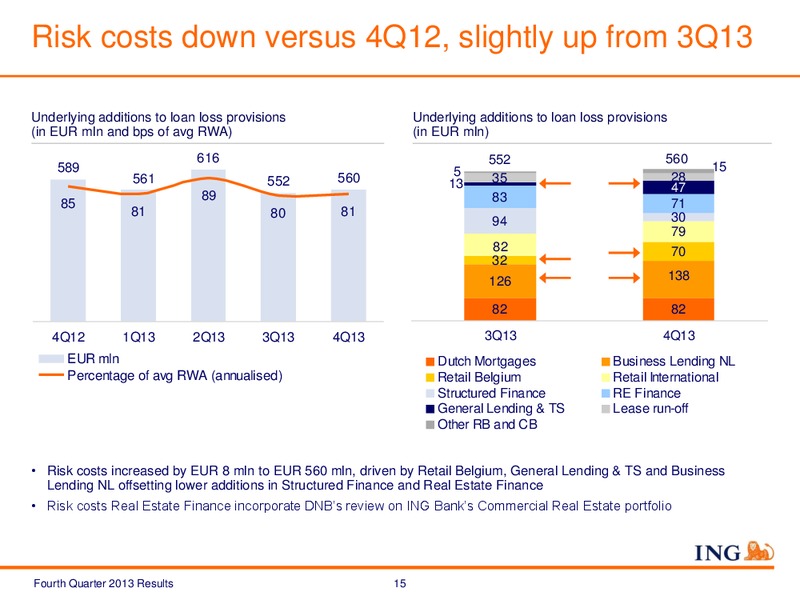
Risk costs down versus 4Q12, slightly up from 3Q13 Underlying additions to loan loss provisions Underlying additions to loan loss provisions (in EUR mln and bps of avg RWA) (in EUR mln) 616 552 560 589 5 15 561 552 560 13 35 28 47…
NPL ratio increased slightly to 2.8% Non-performing loans (in EUR and %) NPL ratio (in %) 4Q13 3Q13 2.8 2.7 2.8 2.6 Retail Banking 2.5 - Dutch Mortgages 1.9 1.8 - Business Lending NL 7.5 7.0 - Retail Belgium 3.2 3.2 - Retail…
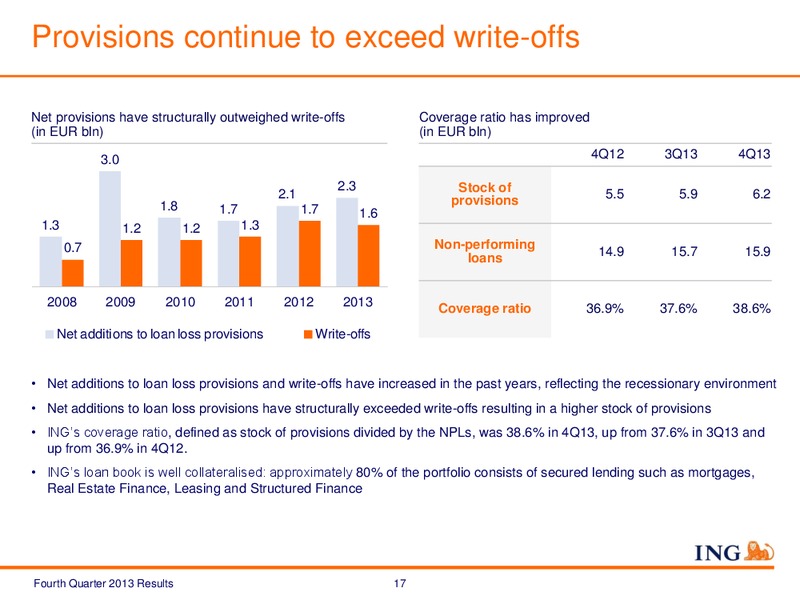
Provisions continue to exceed write-offs Net provisions have structurally outweighed write-offs Coverage ratio has improved (in EUR bln) (in EUR bln) 3.0 4Q12 3Q13 4Q13 2.3 Stock of 2.1 5.5 5.9 6.2 1.8 provisions 1.7 1.7 1.6 1.3…
Risk costs Retail Banking Netherlands remain elevated Risk costs Dutch mortgages and Business Lending NL Non-performing loans Dutch mortgages and Business (in EUR mln) Lending NL (in EUR bln) 82 82 2.6 33 82 81 2.4 2.5 2.1 2.3 148…
Risk costs Real Estate Finance further down Risk costs (in EUR mln) Real Estate Finance portfolio by country of residence (31 Dec 2013)* (in EUR bln) 111 112 11% Netherlands 103 5% Spain 83 71 5% Italy 5% EUR France 25 bln 59%…
Capital position remains strong despite higher RWAs ING Bank core Tier 1 ratio (in %) -0.4% -0.5% 0.2% -0.9% 10.8% 11.9% 12.4% 11.7% 9.6% 10.0% fully loaded 4Q11 4Q12 3Q13 Dividend to RWA Net profit 4Q13 Impact Pro-forma…
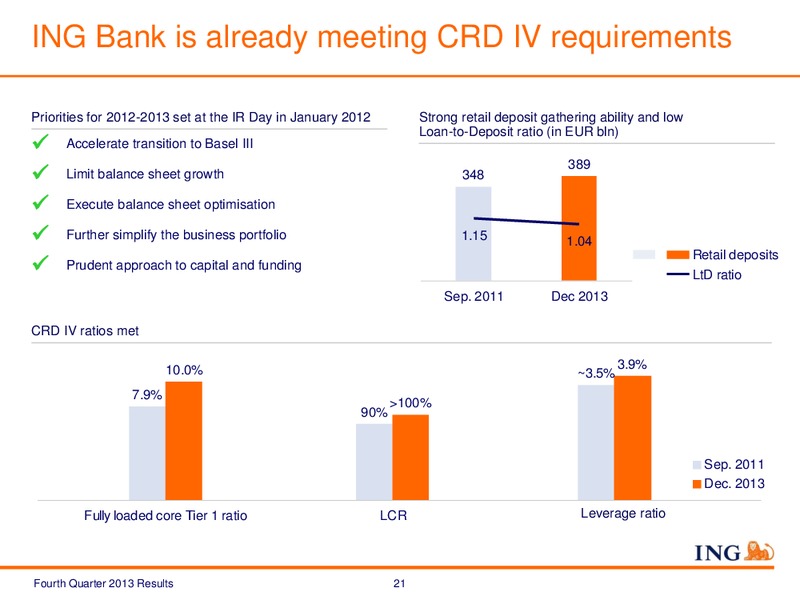
ING Bank is already meeting CRD IV requirements Priorities for 2012-2013 set at the IR Day in January 2012 Strong retail deposit gathering ability and low Loan-to-Deposit ratio (in EUR bln) Accelerate transition to Basel III 389…
ING Insurance Fourth Quarter 2013 Results 22
ING Insurance results ongoing business up from 4Q12 Operating result ongoing business Result before tax Sales (in EUR mln) (in EUR mln) (APE, in EUR mln) 164 1,224 90 90 269 448 109 130 231 215 131 190 171 -28 140 -428 159 -685…
Netherlands Life results up on higher investment income and lower expenses Netherlands Life - Operating result Netherlands Non-Life Operating result Insurance Europe - Operating result (in EUR mln) (in EUR mln) (in EUR mln) 199 186…
Administrative expenses were down from 4Q12 Administrative expenses ongoing business (in EUR mln) Administrative expenses for the ongoing businesses were EUR 462 million in 4Q13, down 0.6% from a year ago, -0.6% despite higher pension…
ING Insurance will continue to focus on improving capital generation and earnings Leading position in Dutch life insurance* Continued focus on cost reductions 3 in Dutch non-life insurance* Gradual shift to higher return assets…
Wrap up Fourth Quarter 2013 Results 27
Wrap up ING advanced further into end phase of restructuring State support further reduced and IABF unwound Further progress on divestment Insurance and Investment Management ING Insurance on track in preparations for intended IPO in…
Appendix Fourth Quarter 2013 Results 29
Pro-forma ING Group capital structure at 31 December 2013 Pro-forma - ING Group 31 December 2013 ING Bank 32 Equity 44 ING Insurance 14 Minority Interest U.S. 4 ING U.S. 10 CT1 securities 2 HybridsB 5 Core Debt 5 HybridsI 2 Hybrids…
Pro-forma CRD IV core Tier 1 ratio fully-loaded 10.0% Impact CRD IV 4Q2013 (pro-forma) (EUR bln) CRD IV core Tier 1 ratio Core Tier CT1 CRD IV started on 1 January 2014, 1 capital RWAs ratio including the first tranche of the…
Short-term funding reduced while growing long-term funding and deposits ING continued to grow its deposit base, Strong primarily driven by Retail Banking units customer 419 436 457 475 ING will continuously focus on increasing 389…
Early signs of stabilisation Dutch economy and housing market Dutch Purchasings Managers Index (PMI) rose to 57.0 in Dutch unemployment rate (%) has remained stable at December. Above 50 indicates positive growth around 7% in the past 6…
 Loading...