Superior Energy Services 2014 Barclays CEO Energy-Power Conference September 3, 2014
Company Overview
Rationale for Superior Diversified family of products Serving the drilling, completion, production and decommissioning needs of the oil and gas industry in the U.S. with a growing presence in select international markets Globally…
4
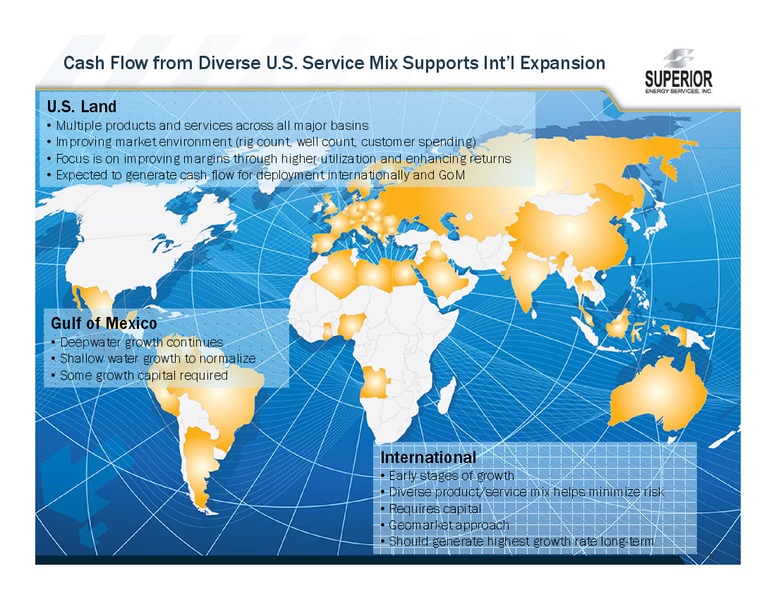
Cash Flow from Diverse U.S. Service Mix Supports Intl Expansion U.S. Land Multiple products and services across all major basins Improving market environment (rig count, well count, customer spending) Focus is on improving margins…
Balanced Contribution from Diversified Product Mix Trailing 12 months ended June 30, 2014 Revenue Income from Operations (as Adjusted)1 4,341 million 469 million Onshore Completion Onshore and Technical Completion Technical…
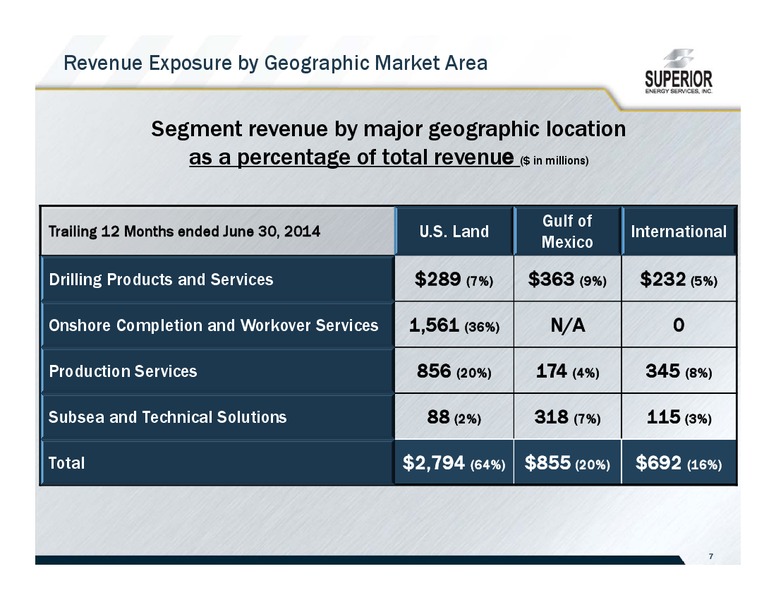
Revenue Exposure by Geographic Market Area Segment revenue by major geographic location as a percentage of total revenue ( in millions) Gulf of Trailing 12 Months ended June 30, 2014 U.S. Land International Mexico Drilling…
Strategic Overview
Strategic Framework for Value Creation Compete in 150 billion of total market globally with diverse product line Testing portfolio for optimization opportunities to ensure a balance between returns and growth Be in good…
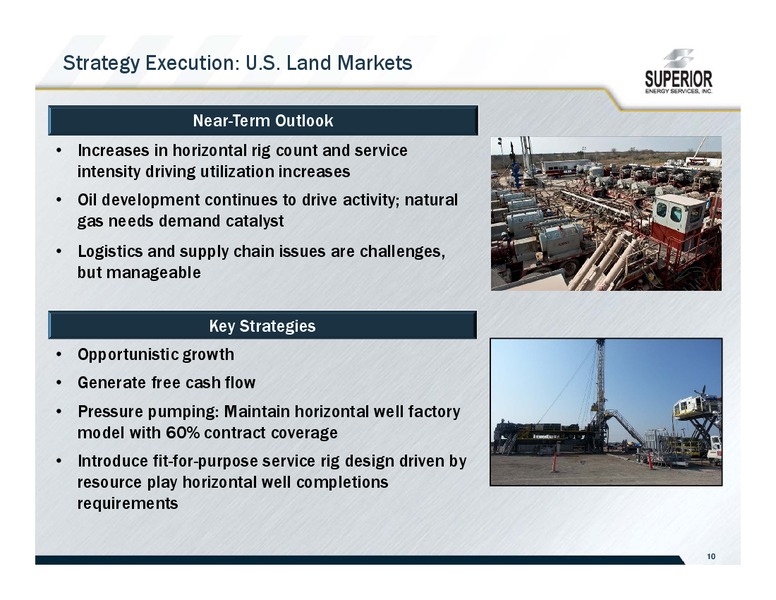
Strategy Execution: U.S. Land Markets Near-Term Outlook Increases in horizontal rig count and service intensity driving utilization increases Oil development continues to drive activity; natural gas needs demand catalyst Logistics…
Strategy Execution: Gulf of Mexico Near-Term Outlook Monthly Deep Water New Well Permits(1) Activity exceeding pre-Macondo levels but at lower 25 pace than 2013 20 3-year pre-spill 15 average: 7/mo. Deep water rig availability…
Strategy Execution: International A focused, disciplined approach to international expansion Market Considerations Capabilities Alignment Competitive Landscape STRETCH Geopolitical Considerations Financial Return Forecast HOT…
Legacy Markets Legacy Markets: United Kingdom, Norway, Continental Europe, Mexico, Trinidad, Ecuador, Peru Represents approximately 35% of international revenue 13
Core Markets Core Markets: Argentina, Brazil, Colombia, Australia, Indonesia, Malaysia, Saudi Arabia, Kuwait, India Represents approximately 40% of international revenue 14
Hot Spot Markets Hot Spot Markets: Ghana, Angola, Nigeria, Thailand, Gabon Represents approximately 10% of international revenue 15
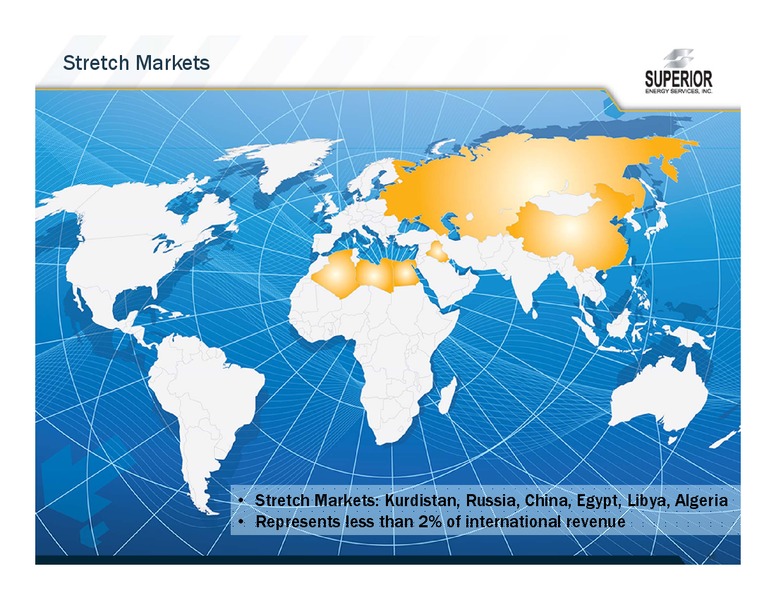
Stretch Markets Stretch Markets: Kurdistan, Russia, China, Egypt, Libya, Algeria Represents less than 2% of international revenue 16
Capital Allocation Capital Expenditures 2014 Capital Expenditures by Segment Technical Drilling 2014: 600 million to 650 million Solutions Products 18% and Growth capex for GOM and international; Services primarily maintenance for…
Income from Operations Reconciliation Trailing 12 months ended June 30, 2014 Onshore Drilling Completion Products and and Workover Production Technical Consolidated Services Services Services Solutions Total Income (loss)…
 Loading...