Preferred partner Strategic overview January 2014 2013 Aker Solutions Slide 1 17 February, 2014 Capital Markets Day Preferred partner
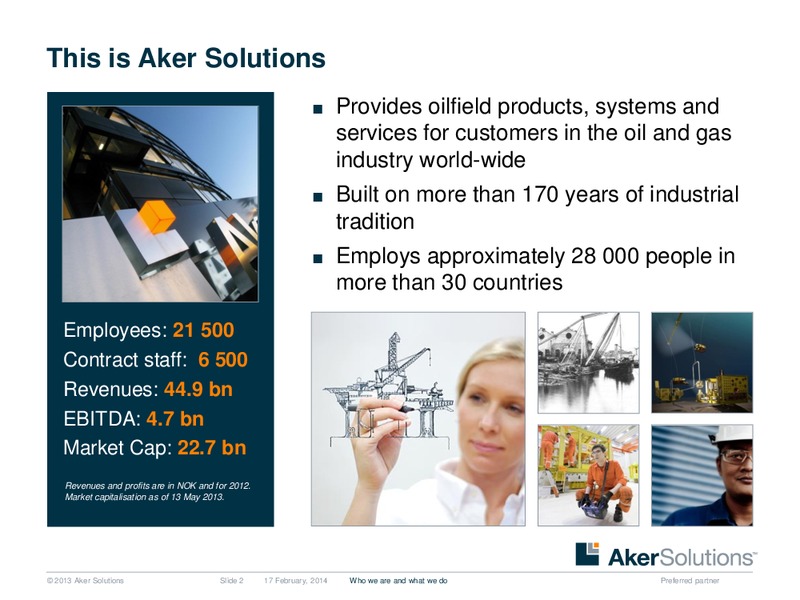
This is Aker Solutions Provides oilfield products, systems and services for customers in the oil and gas industry world-wide Built on more than 170 years of industrial tradition Employs approximately 28 000 people in more than 30…
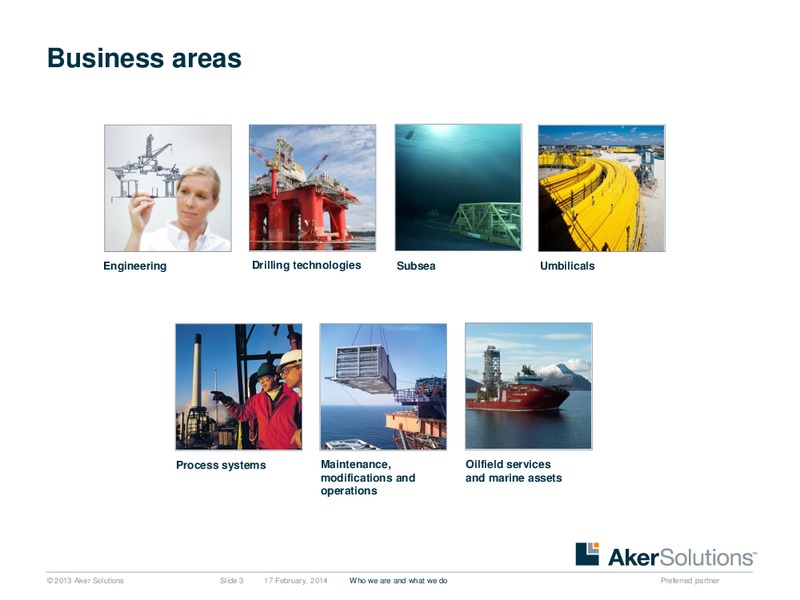
Business areas Engineering Drilling technologies Subsea Umbilicals Process systems Maintenance, Oilfield services modifications and and marine assets operations 2013 Aker Solutions Slide 3 17 February, 2014 Who we are and…
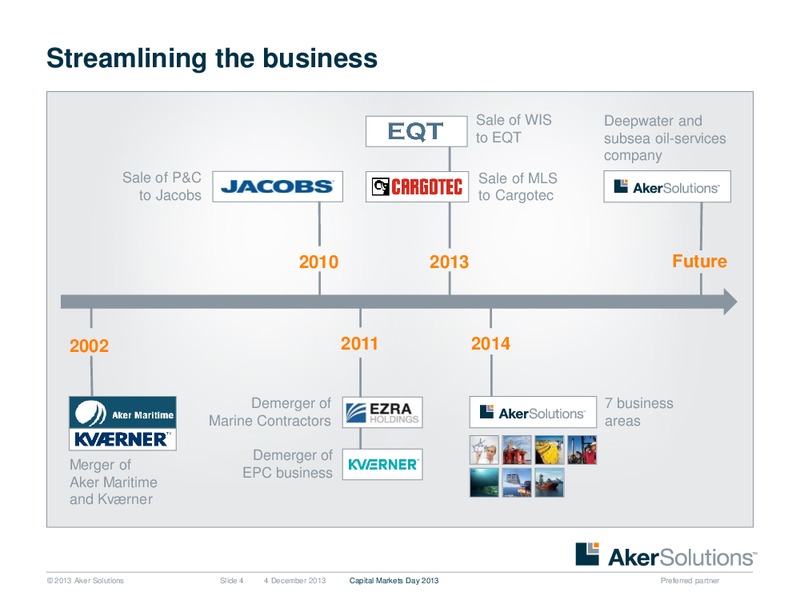
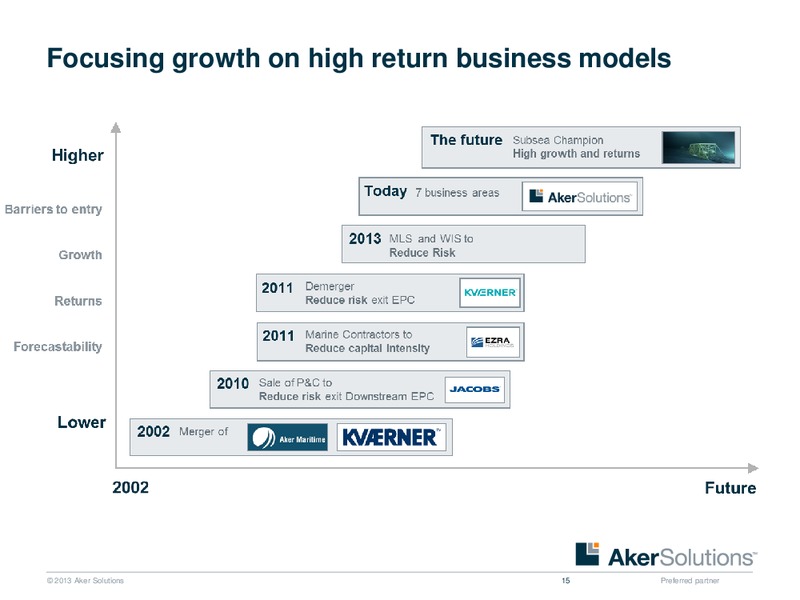
Streamlining the business Sale of WIS Deepwater and to EQT subsea oil-services company Sale of P&C Sale of MLS to Jacobs to Cargotec 2010 2013 Future 2002 2011 2014 Demerger of 7 business Marine Contractors areas…
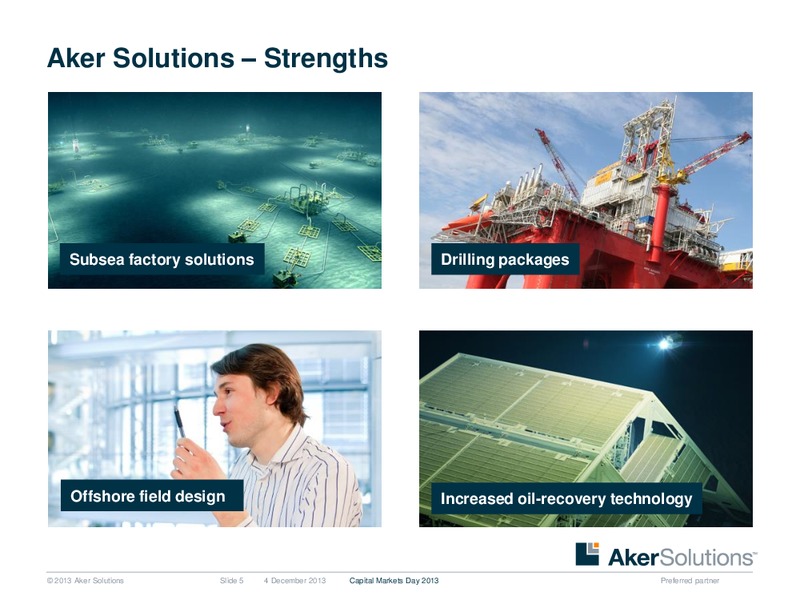
Aker Solutions Strengths Subsea factory solutions Drilling packages Offshore field design Increased oil-recovery technology 2013 Aker Solutions Slide 5 4 December 2013 Capital Markets Day 2013 Preferred partner
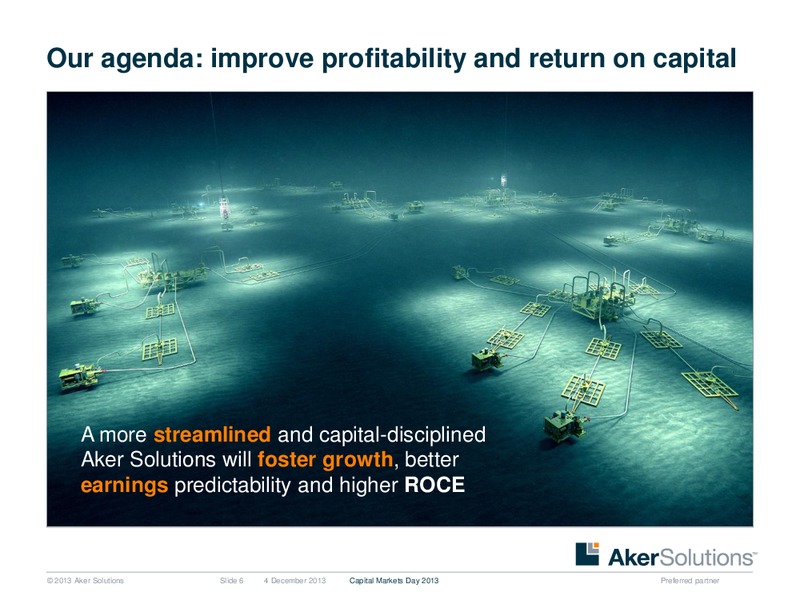
Our agenda: improve profitability and return on capital A more streamlined and capital-disciplined Aker Solutions will foster growth, better earnings predictability and higher ROCE 2013 Aker Solutions Slide 6 4 December 2013…
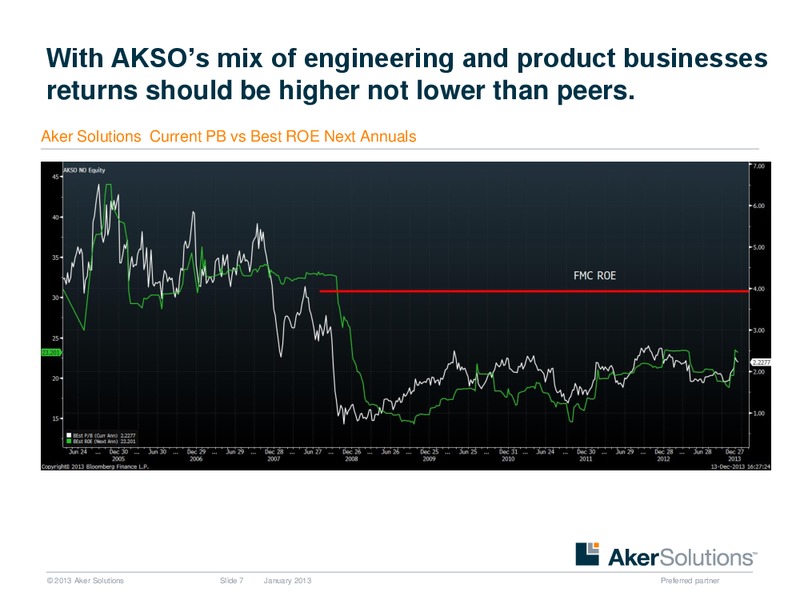
With AKSOs mix of engineering and product businesses returns should be higher not lower than peers. Aker Solutions Current PB vs Best ROE Next Annuals 2013 Aker Solutions Slide 7 January 2013 Preferred partner
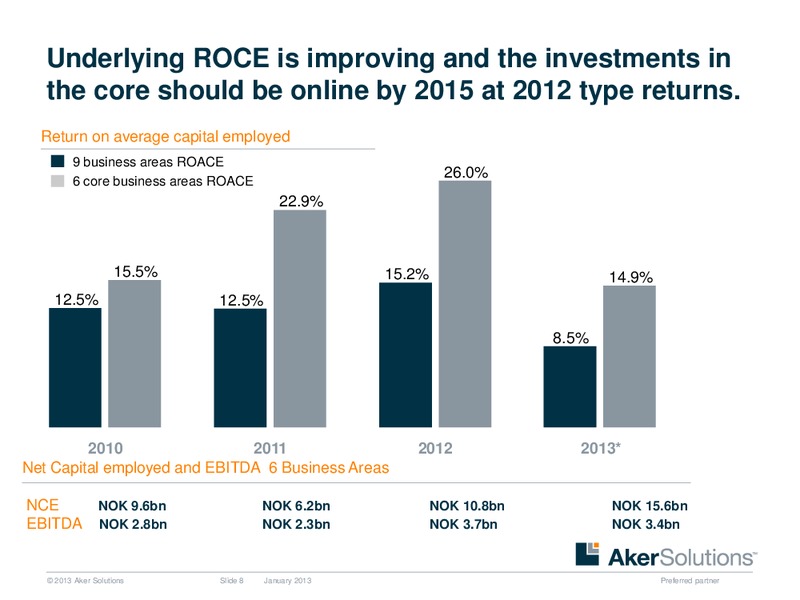
Underlying ROCE is improving and the investments in the core should be online by 2015 at 2012 type returns. Return on average capital employed 9 business areas ROACE 26.0% 6 core business areas ROACE 22.9% 15.5% 15.2% 14.9%…
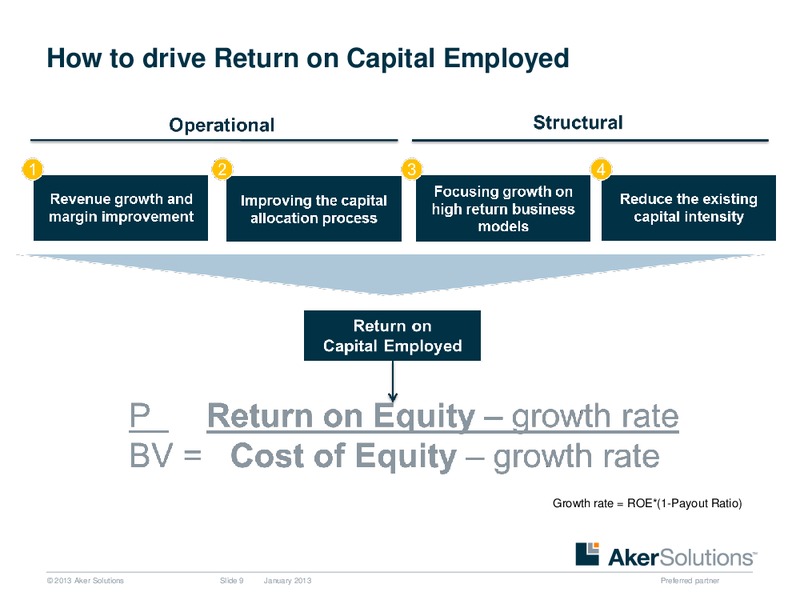
How to drive Return on Capital Employed Growth rate = ROE*(1-Payout Ratio) 2013 Aker Solutions Slide 9 January 2013 Preferred partner
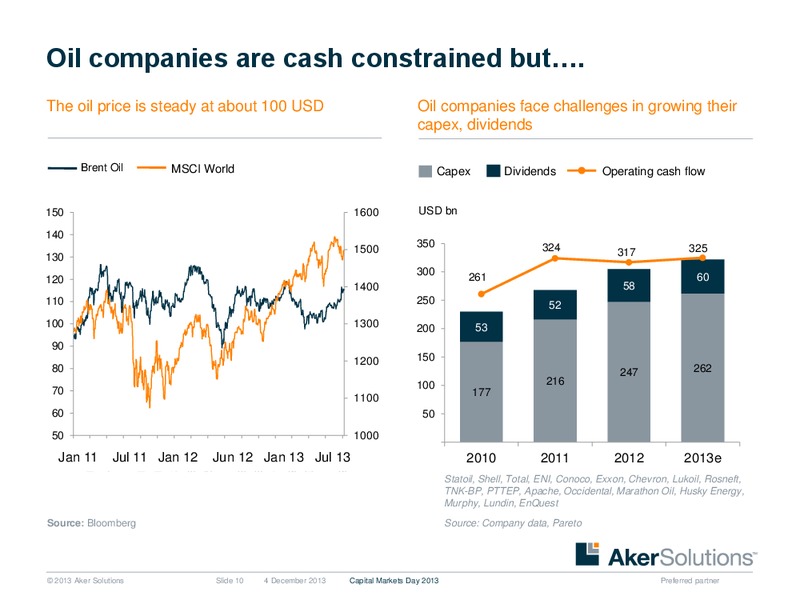
Oil companies are cash constrained but. The oil price is steady at about 100 USD Oil companies face challenges in growing their capex, dividends Brent Oil MSCI World Capex Dividends Operating cash flow 150 1600 USD bn 140 350 324…
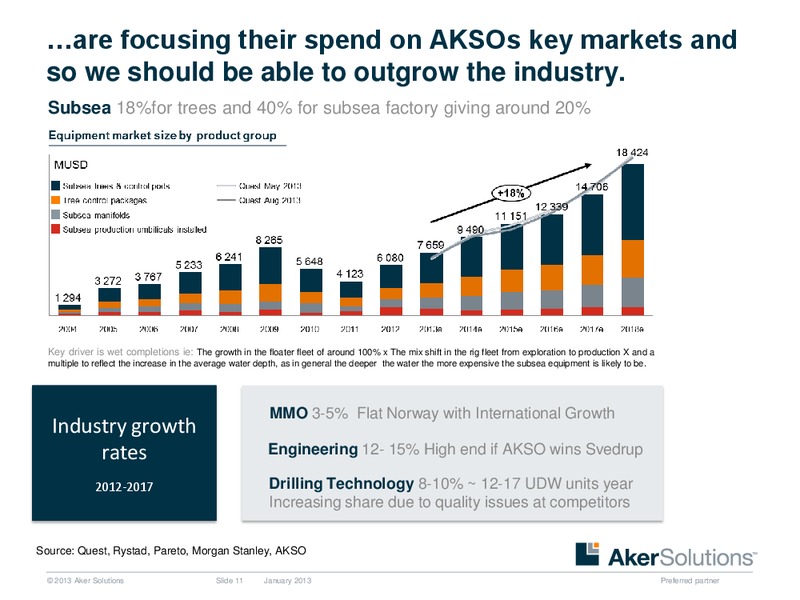
are focusing their spend on AKSOs key markets and so we should be able to outgrow the industry. Subsea 18%for trees and 40% for subsea factory giving around 20% Key driver is wet completions ie: The growth in the floater fleet of…
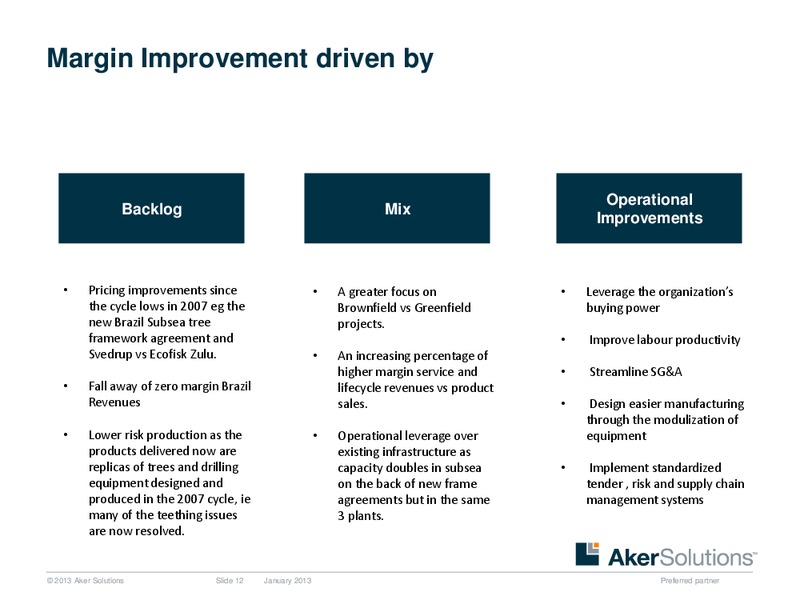
Margin Improvement driven by Operational Backlog Mix Improvements Pricing improvements since A greater focus on Leverage the organizations the cycle lows in 2007 eg the Brownfield vs Greenfield buying power new Brazil Subsea…
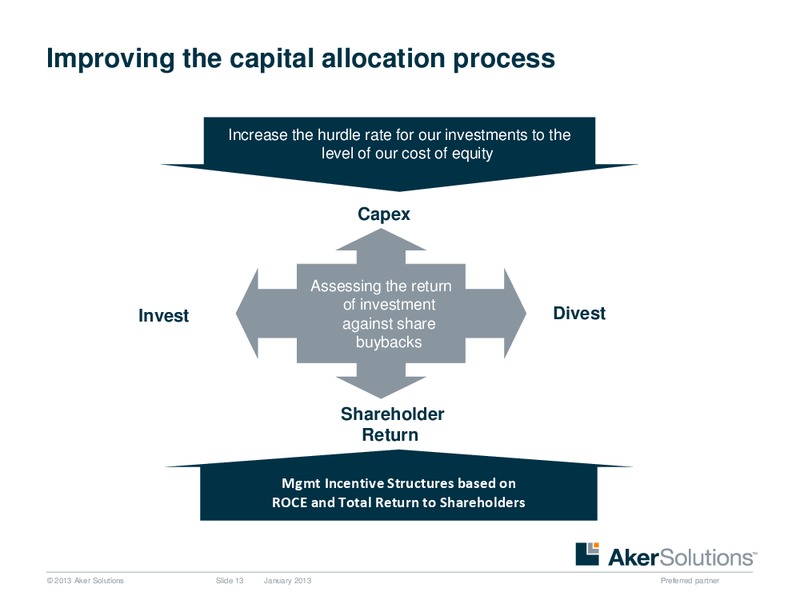
Improving the capital allocation process Increase the hurdle rate for our investments to the level of our cost of equity Capex Assessing the return of investment Invest Divest against share buybacks Shareholder Return…
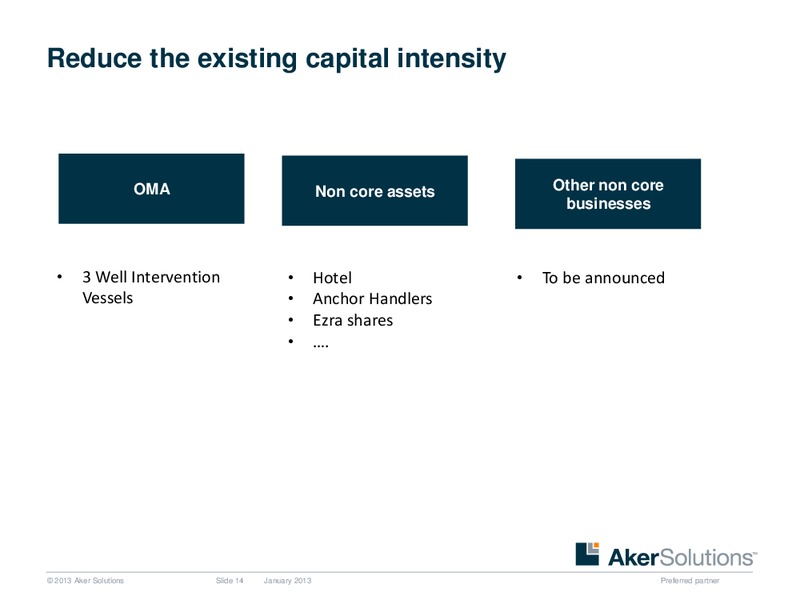
Reduce the existing capital intensity OMA Non core assets Other non core businesses 3 Well Intervention Hotel To be announced Vessels Anchor Handlers Ezra shares . 2013 Aker Solutions Slide 14 January 2013 Preferred…
Focusing growth on high return business models 2013 Aker Solutions 15 Preferred partner
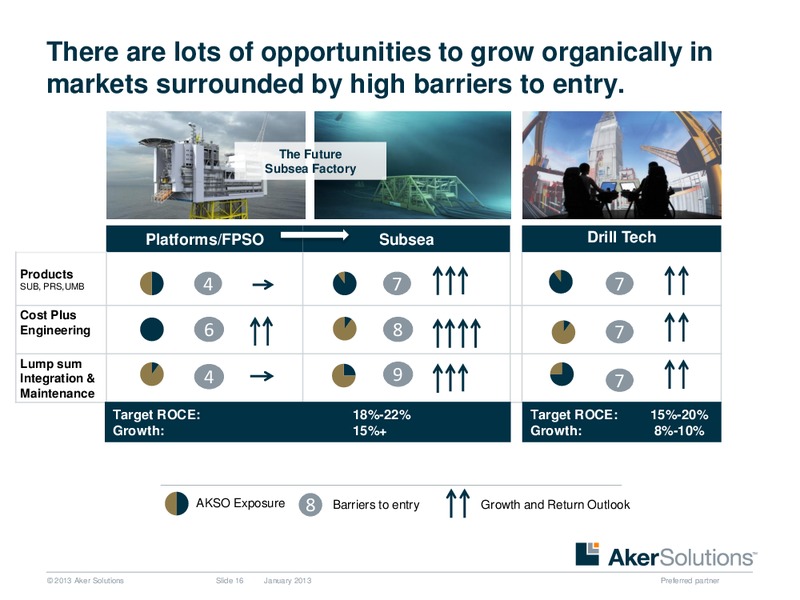
There are lots of opportunities to grow organically in markets surrounded by high barriers to entry. The Future Subsea Factory Platforms/FPSO Subsea Drill Tech Products SUB, PRS,UMB 4 7 7 Cost Plus Engineering 6 8 7 Lump sum…
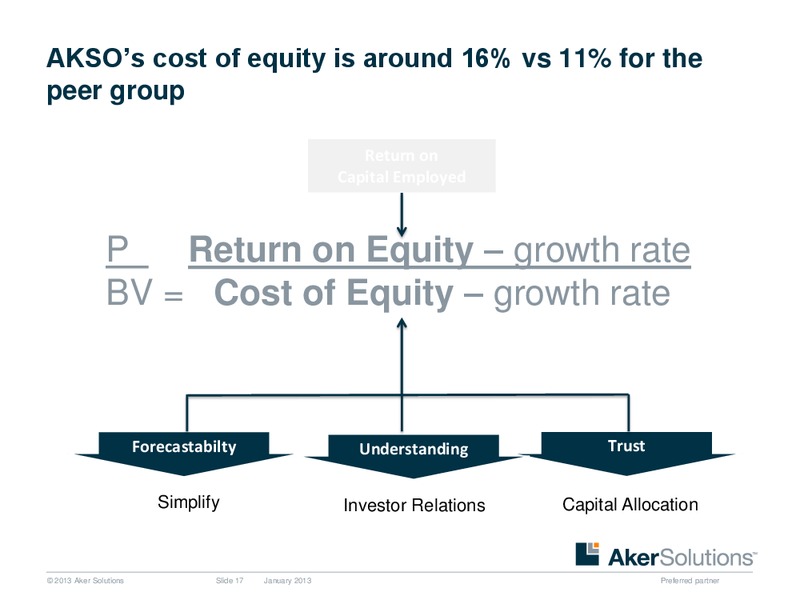
AKSOs cost of equity is around 16% vs 11% for the peer group Return on Capital Employed P Return on Equity growth rate BV = Cost of Equity growth rate Forecastabilty Understanding Trust Simplify Investor Relations Capital…
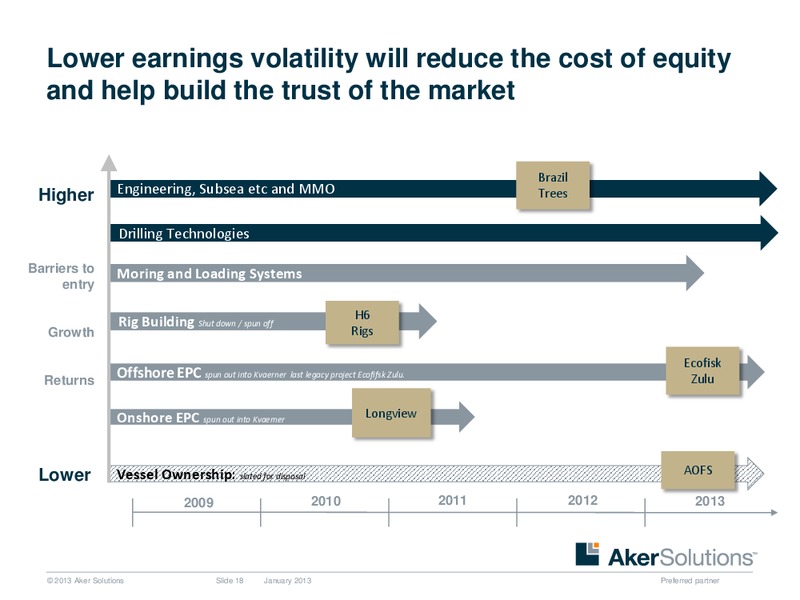
Lower earnings volatility will reduce the cost of equity and help build the trust of the market Brazil Higher Engineering, Subsea etc and MMO Trees Drilling Technologies Barriers to Moring and Loading Systems entry H6 Rig…
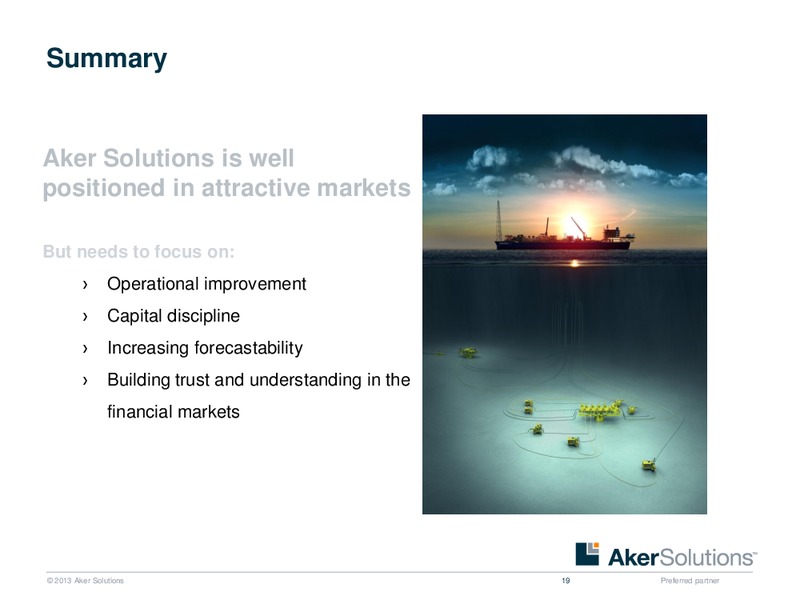
Summary Aker Solutions is well positioned in attractive markets But needs to focus on: Operational improvement Capital discipline Increasing forecastability Building trust and understanding in the financial markets 2013 Aker…
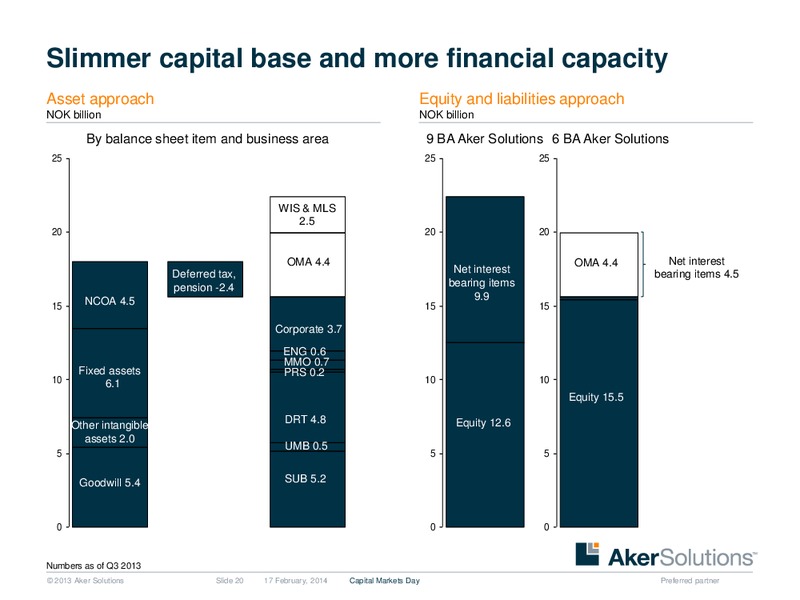
Slimmer capital base and more financial capacity Asset approach Equity and liabilities approach NOK billion NOK billion By balance sheet item and business area 9 BA Aker Solutions 6 BA Aker Solutions 25 25 25 25 25 WIS & MLS 2.5…
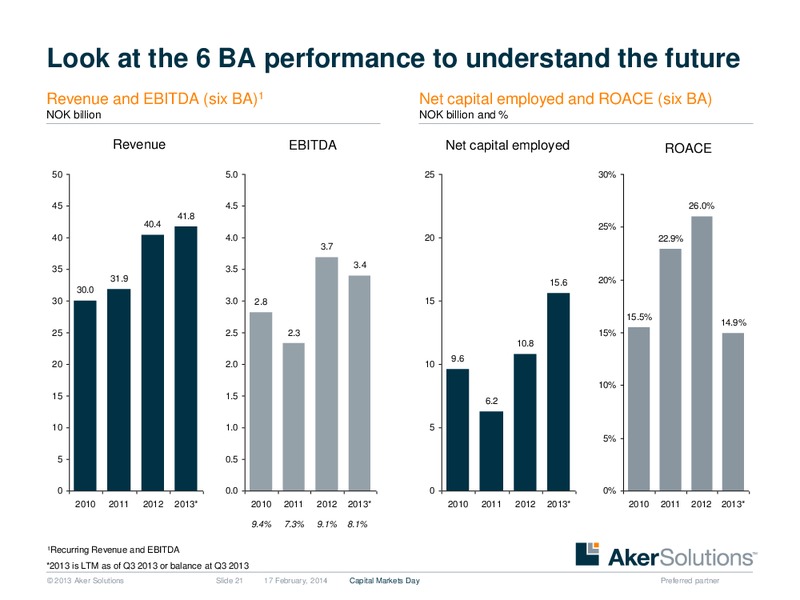
Look at the 6 BA performance to understand the future Revenue and EBITDA (six BA)1 Net capital employed and ROACE (six BA) NOK billion NOK billion and % Revenue EBITDA Net capital employed ROACE 50 5.0 25 30% 45 4.5 26.0% 41.8…
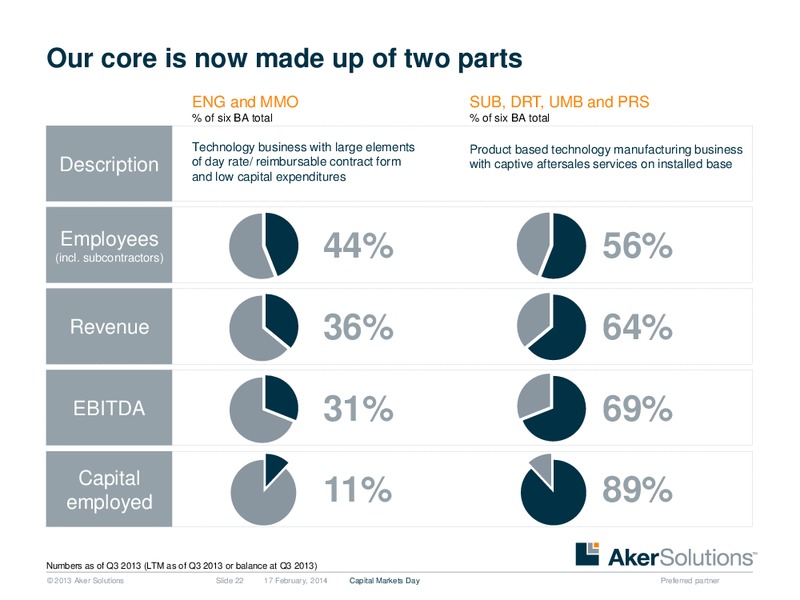
Our core is now made up of two parts ENG and MMO SUB, DRT, UMB and PRS % of six BA total % of six BA total Technology business with large elements Product based technology manufacturing business Description of day rate/ reimbursable…
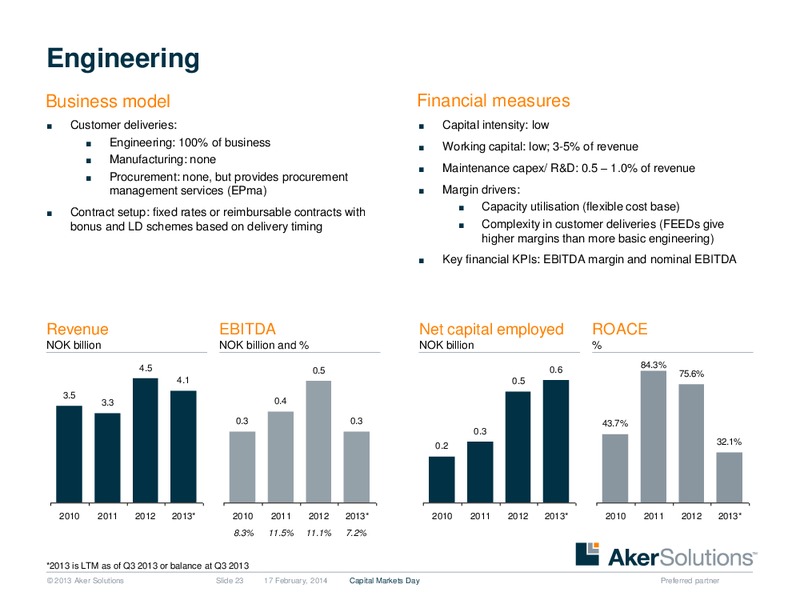
Engineering Business model Financial measures Customer deliveries: Capital intensity: low Engineering: 100% of business Working capital: low; 3-5% of revenue Manufacturing: none Maintenance capex/ R&D: 0.5 1.0% of revenue…
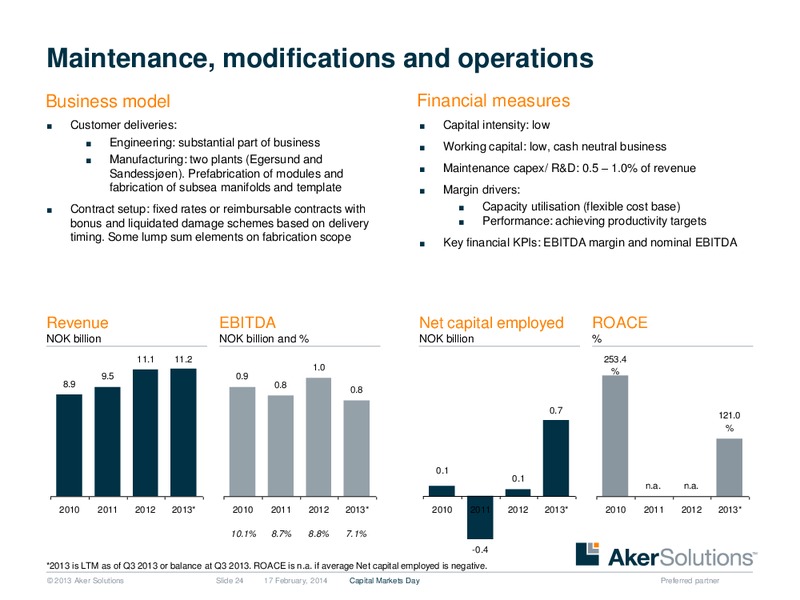
Maintenance, modifications and operations Business model Financial measures Customer deliveries: Capital intensity: low Engineering: substantial part of business Working capital: low, cash neutral business Manufacturing: two plants…
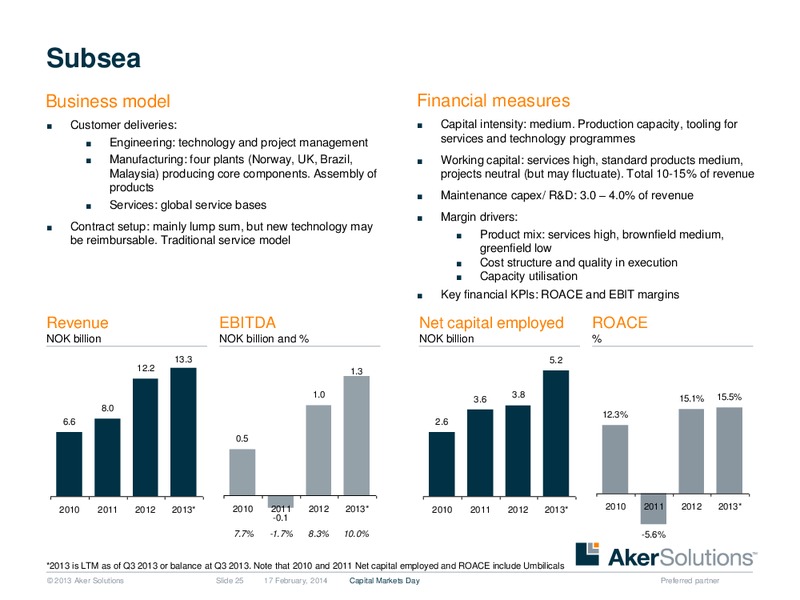
Subsea Business model Financial measures Customer deliveries: Capital intensity: medium. Production capacity, tooling for Engineering: technology and project management services and technology programmes Manufacturing: four plants…
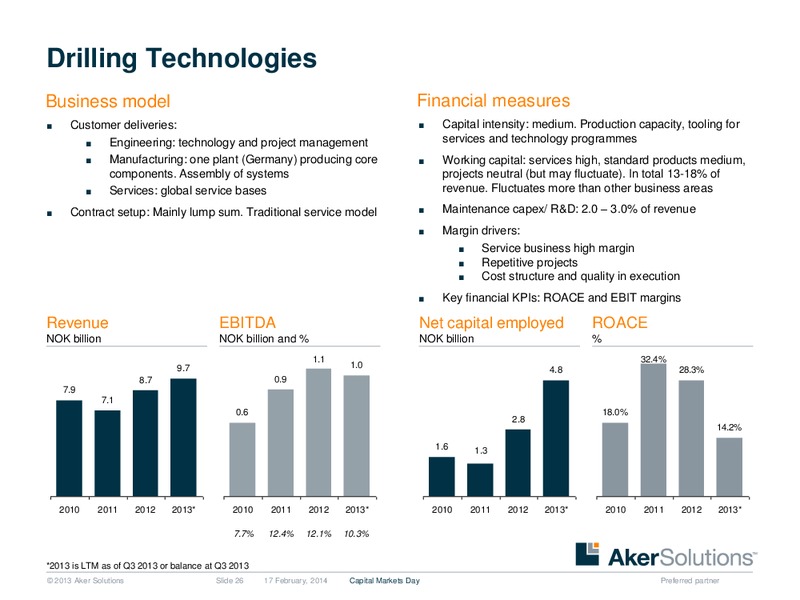
Drilling Technologies Business model Financial measures Customer deliveries: Capital intensity: medium. Production capacity, tooling for Engineering: technology and project management services and technology programmes Manufacturing:…
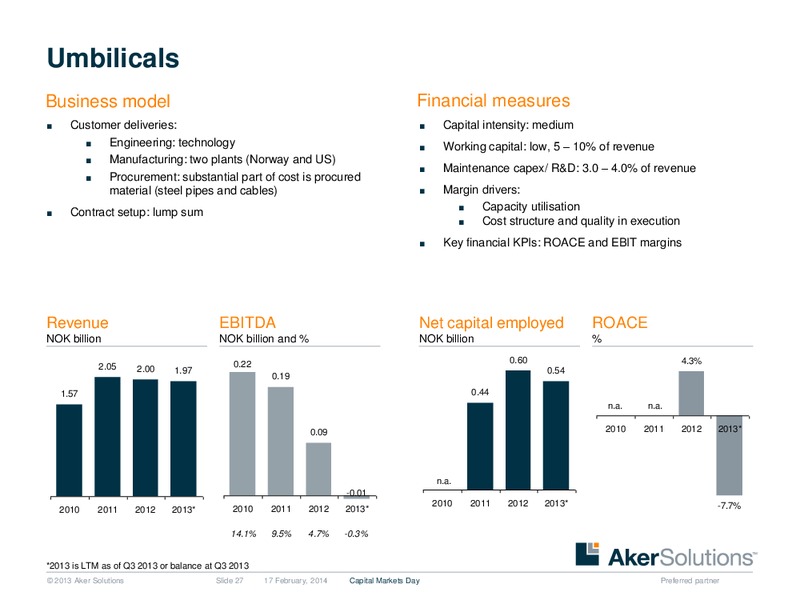
Umbilicals Business model Financial measures Customer deliveries: Capital intensity: medium Engineering: technology Working capital: low, 5 10% of revenue Manufacturing: two plants (Norway and US) Maintenance capex/ R&D: 3.0 4.0% of…
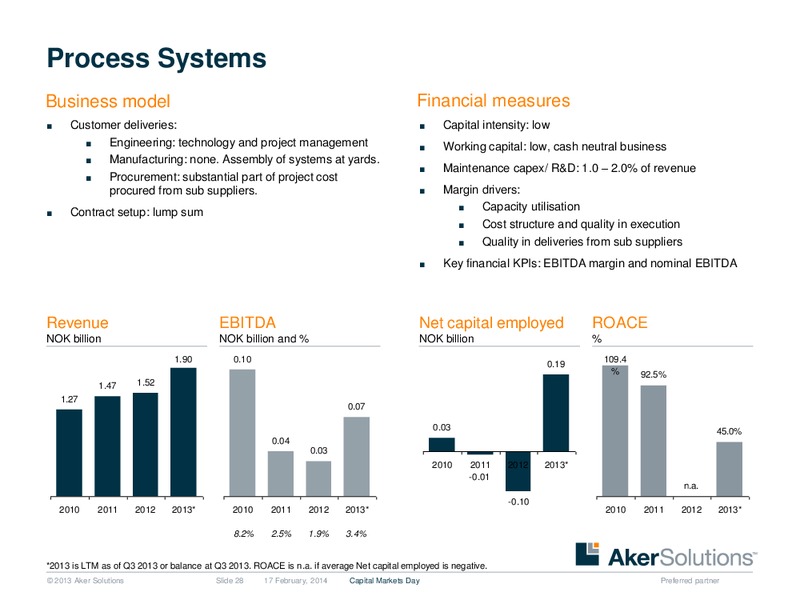
Process Systems Business model Financial measures Customer deliveries: Capital intensity: low Engineering: technology and project management Working capital: low, cash neutral business Manufacturing: none. Assembly of systems at…
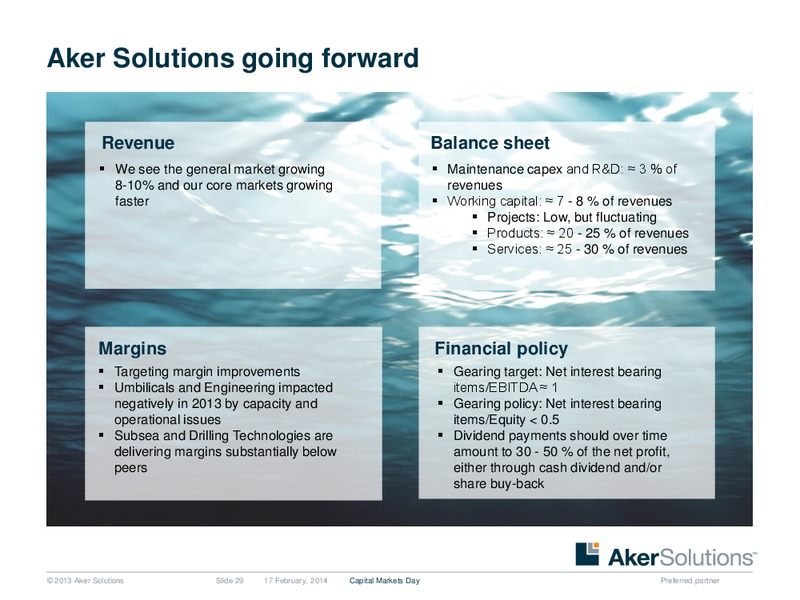
Aker Solutions going forward Revenue Balance sheet We see the general market growing Maintenance capex and R&D: 3 % of 8-10% and our core markets growing revenues faster Working capital: 7 - 8 % of revenues Projects: Low, but…
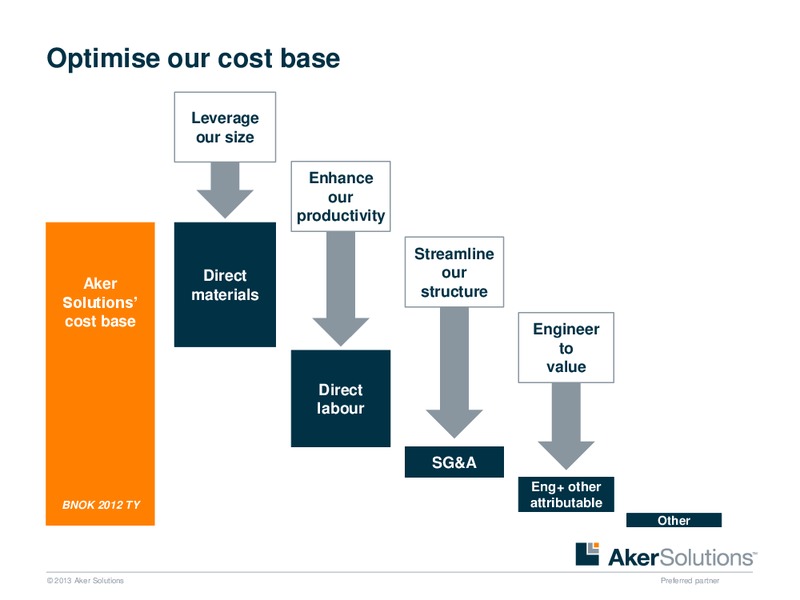
Optimise our cost base Leverage our size Enhance our productivity Streamline Direct our Aker structure materials Solutions cost base Engineer to value Direct labour SG&A Eng+ other BNOK 2012 TY attributable…
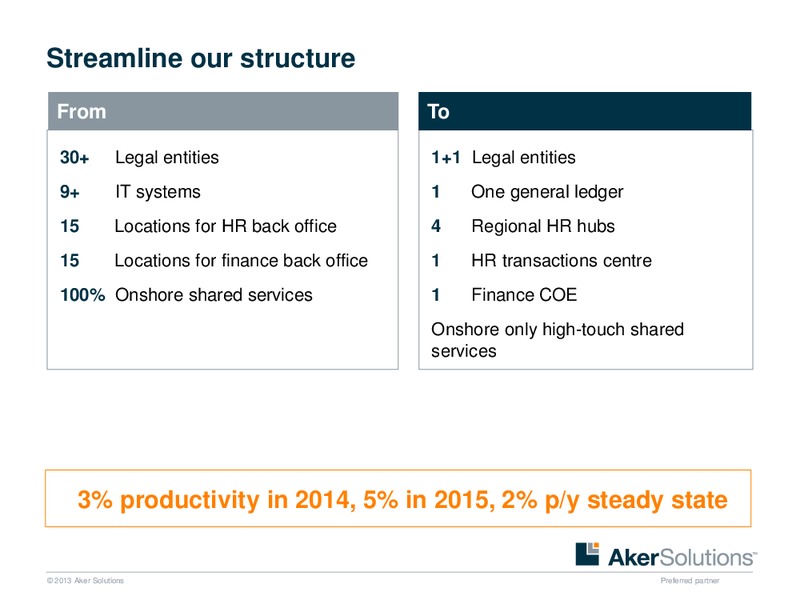
Streamline our structure From To 30+ Legal entities 1+1 Legal entities 9+ IT systems 1 One general ledger 15 Locations for HR back office 4 Regional HR hubs 15 Locations for finance back office 1 HR transactions centre 100% Onshore…
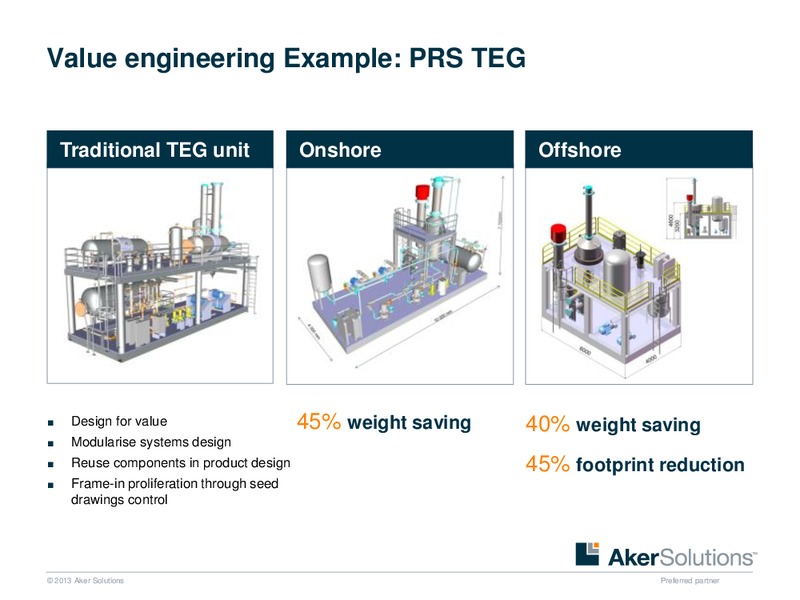
Value engineering Example: PRS TEG Traditional TEG unit Onshore Offshore Design for value 45% weight saving 40% weight saving Modularise systems design Reuse components in product design 45% footprint reduction Frame-in…
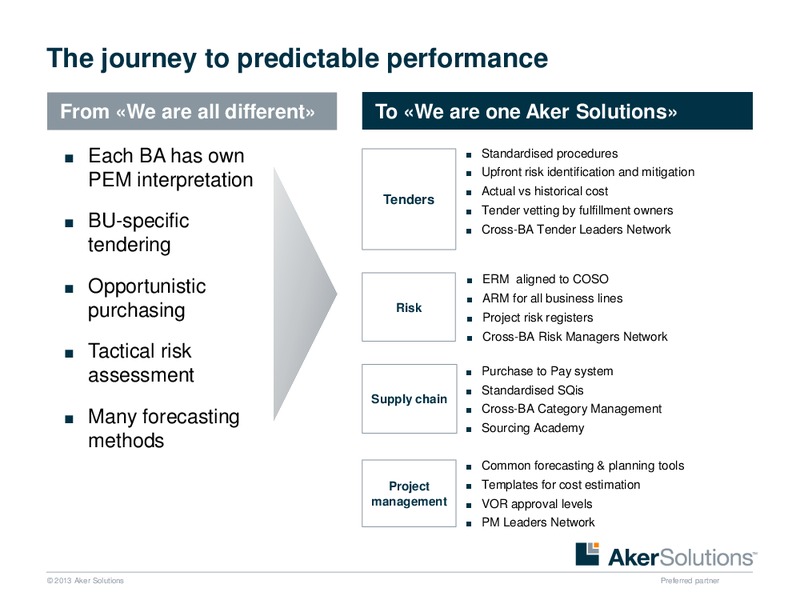
The journey to predictable performance From We are all different To We are one Aker Solutions Each BA has own Standardised procedures Upfront risk identification and mitigation PEM interpretation Actual vs historical cost Tenders…
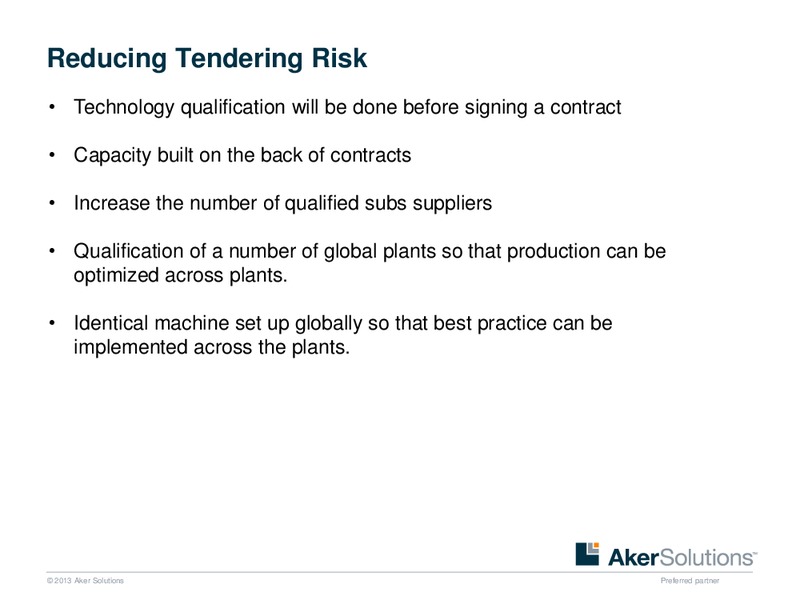
Reducing Tendering Risk Technology qualification will be done before signing a contract Capacity built on the back of contracts Increase the number of qualified subs suppliers Qualification of a number of global plants so that…
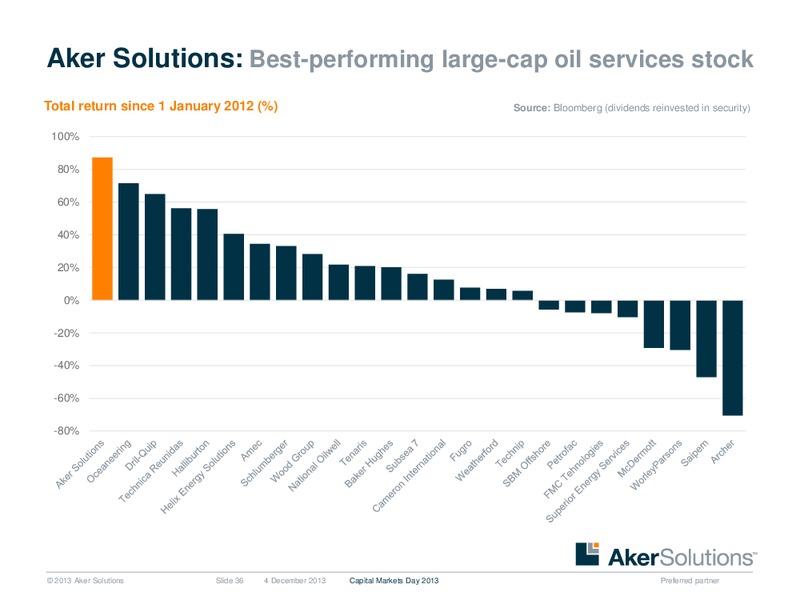
Aker Solutions: Best-performing large-cap oil services stock Total return since 1 January 2012 (%) Source: Bloomberg (dividends reinvested in security) 100% 80% 60% 40% 20% 0% -20% -40% -60% -80% 2013 Aker…
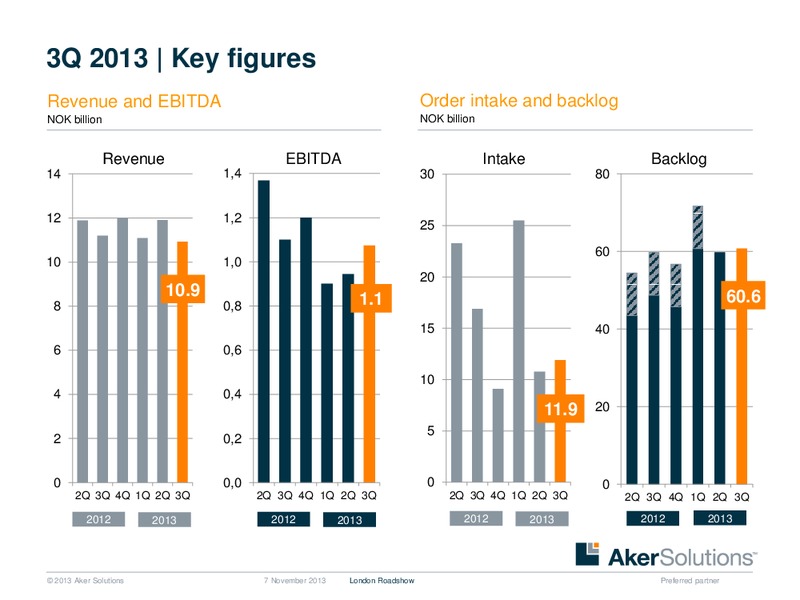
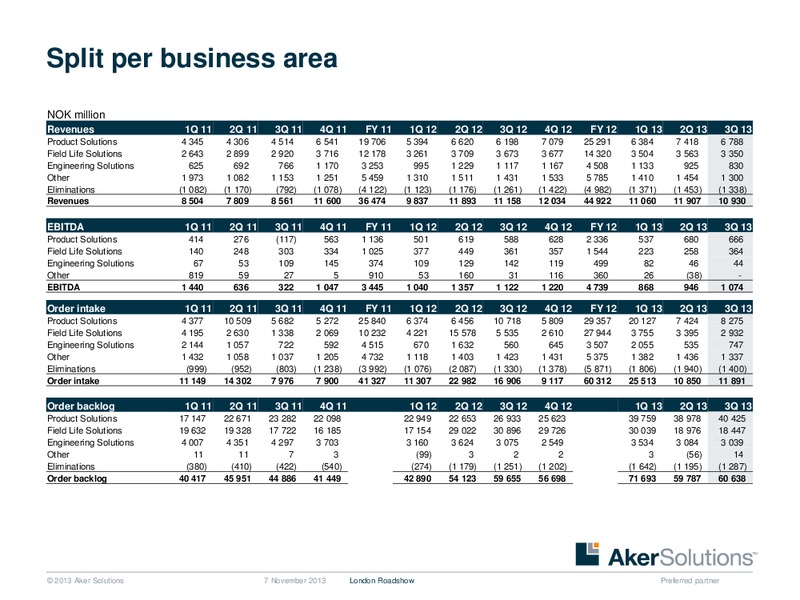
3Q 2013 Key figures Revenue and EBITDA Order intake and backlog NOK billion NOK billion Revenue EBITDA Intake Backlog 14 1,4 30 80 12 1,2 25 60 10 1,0 20 10.9 60.6 8 0,8 1.1 15 40 6 0,6 10 4 0,4 11.9 20 5 2 0,2 0 0,0…
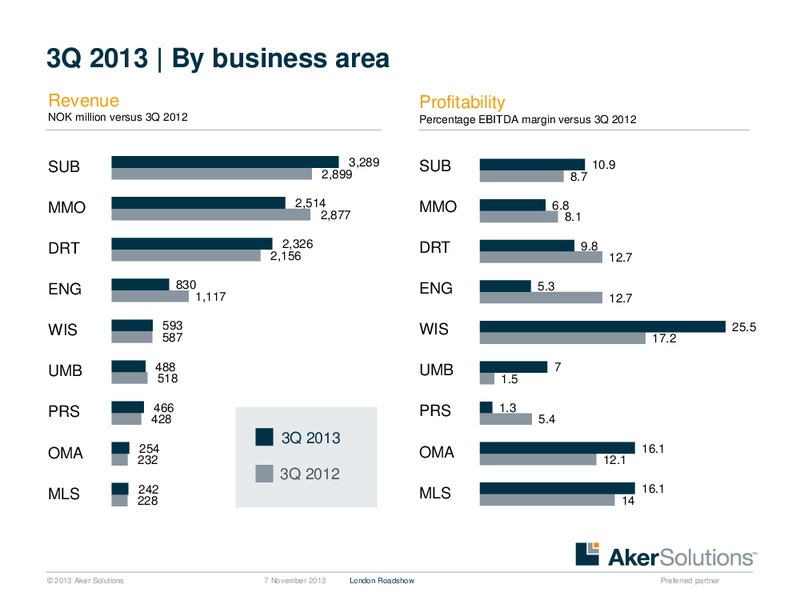
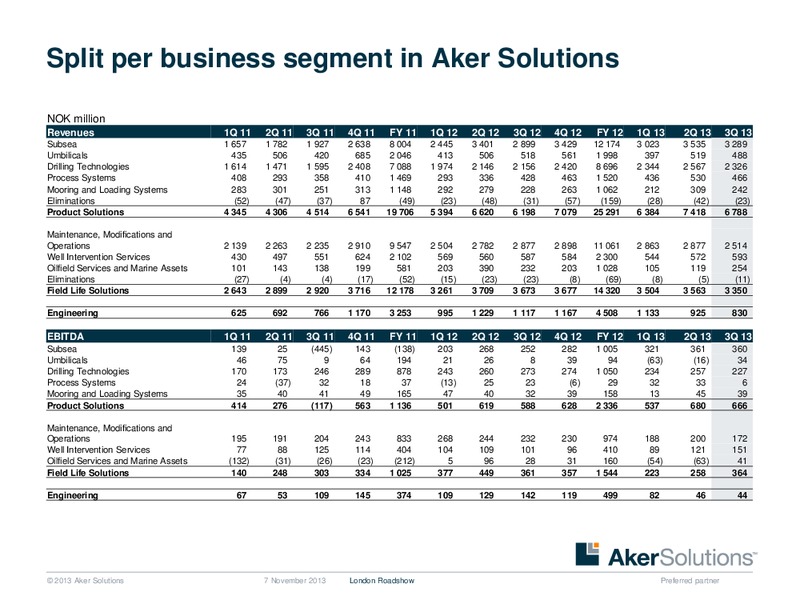
3Q 2013 By business area Revenue Profitability NOK million versus 3Q 2012 Percentage EBITDA margin versus 3Q 2012 SUB 3,289 SUB 10.9 2,899 8.7 MMO 2,514 MMO 6.8 2,877 8.1 DRT 2,326 DRT 9.8 2,156 12.7 ENG 830 ENG 5.3 1,117 12.7…
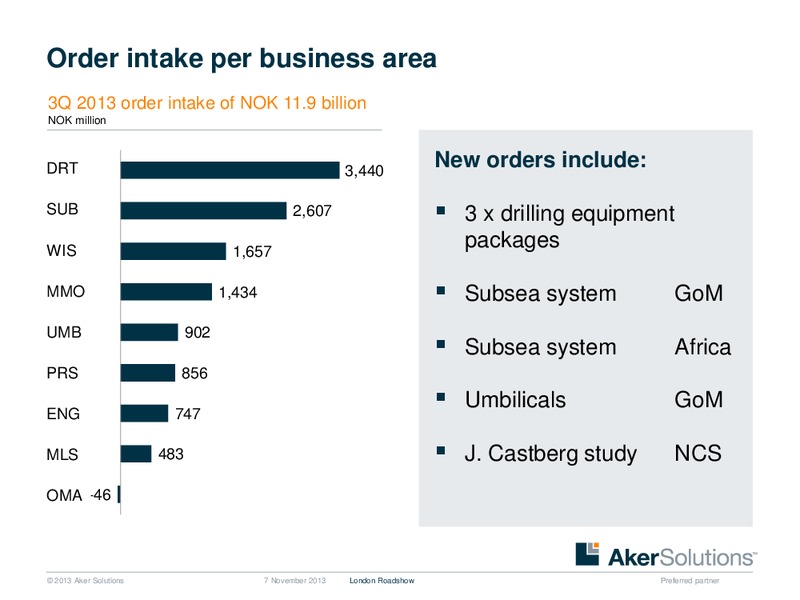
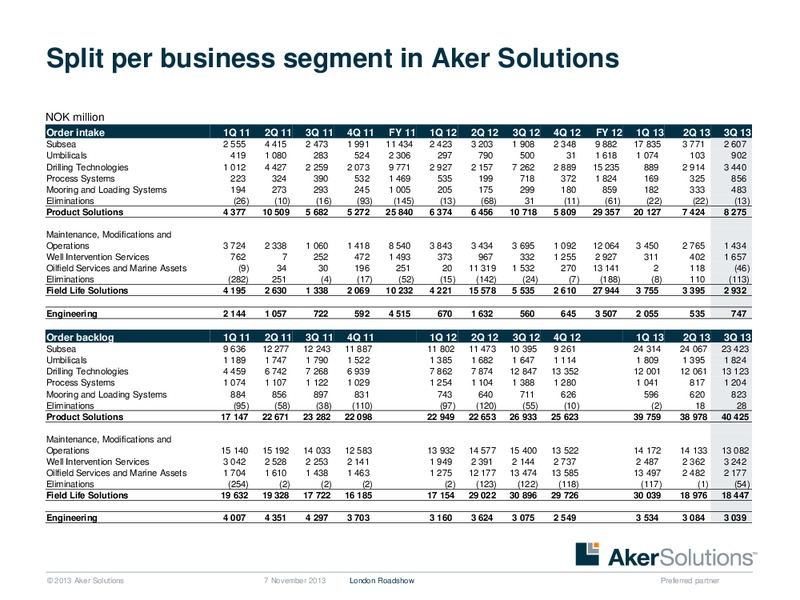
Order intake per business area 3Q 2013 order intake of NOK 11.9 billion NOK million DRT DRT 3,440 New orders include: SUB SUB 2,607 3 x drilling equipment WIS WIS 1,657 packages MMO MMO 1,434 Subsea system GoM UMB UMB 902 Subsea…
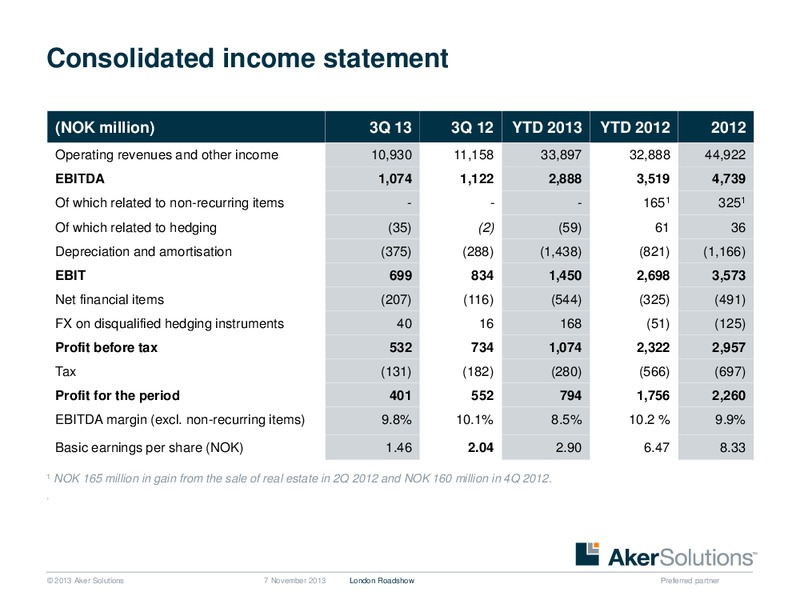
Consolidated income statement (NOK million) 3Q 13 3Q 12 YTD 2013 YTD 2012 2012 Operating revenues and other income 10,930 11,158 33,897 32,888 44,922 EBITDA 1,074 1,122 2,888 3,519 4,739 Of which related to non-recurring items - - -…
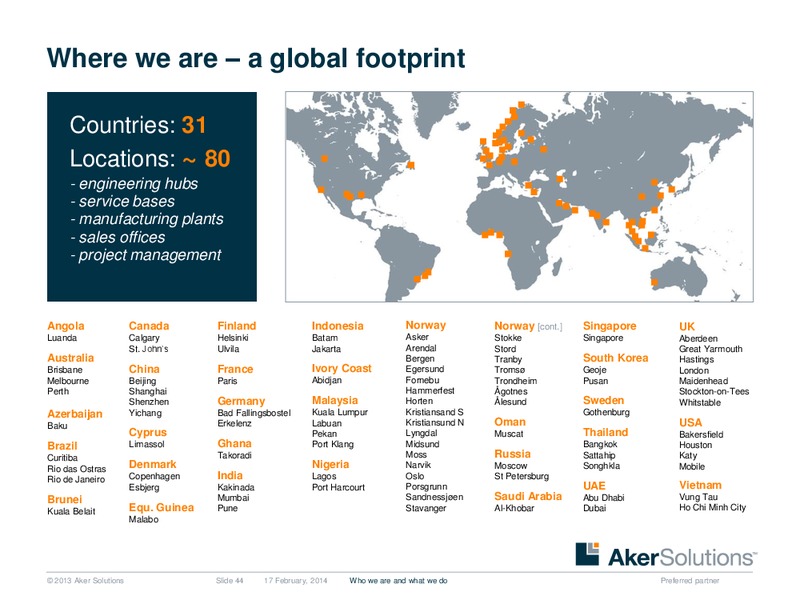
Where we are a global footprint Countries: 31 Locations: 80 - engineering hubs - service bases - manufacturing plants - sales offices - project management Angola Canada Finland Indonesia Norway Norway [cont.] Singapore UK…
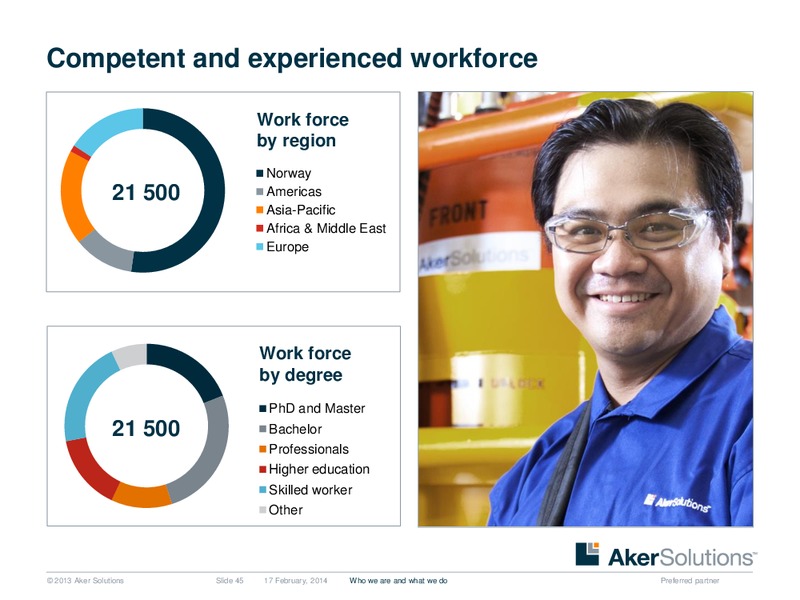
Competent and experienced workforce Work force by region Norway 21 500 Americas Asia-Pacific Africa & Middle East Europe Work force by degree PhD and Master 21 500 Bachelor Professionals Higher education Skilled worker…
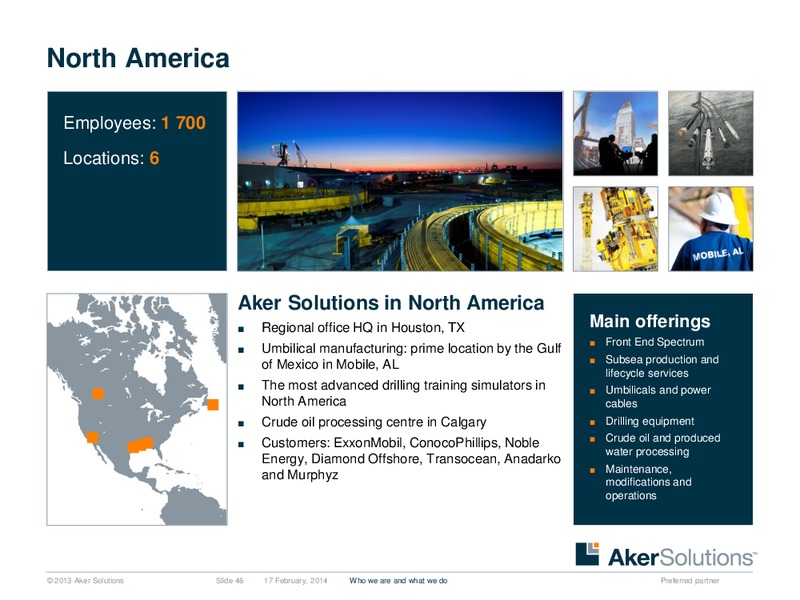
North America Employees: 1 700 Locations: 6 Aker Solutions in North America Regional office HQ in Houston, TX Main offerings Front End Spectrum Umbilical manufacturing: prime location by the Gulf Subsea production and of…
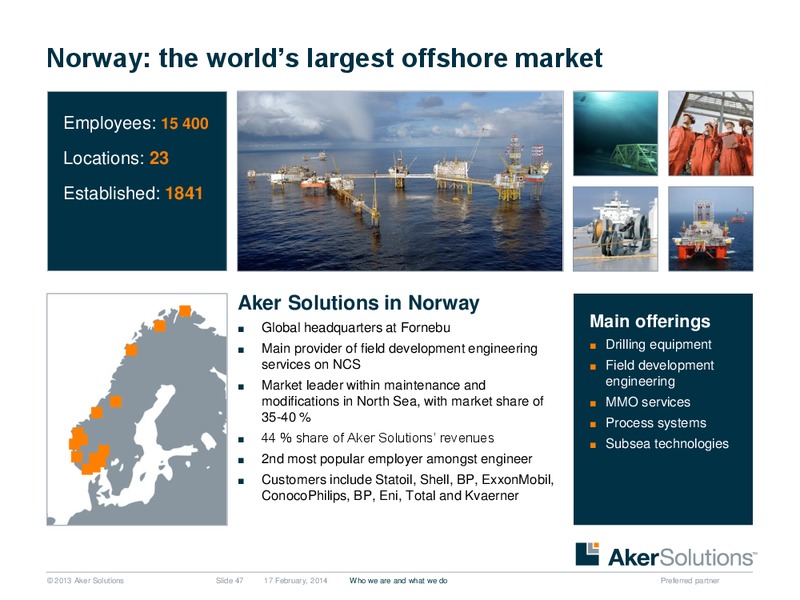
Norway: the worlds largest offshore market Employees: 15 400 Locations: 23 Established: 1841 Aker Solutions in Norway Global headquarters at Fornebu Main offerings Main provider of field development engineering Drilling…
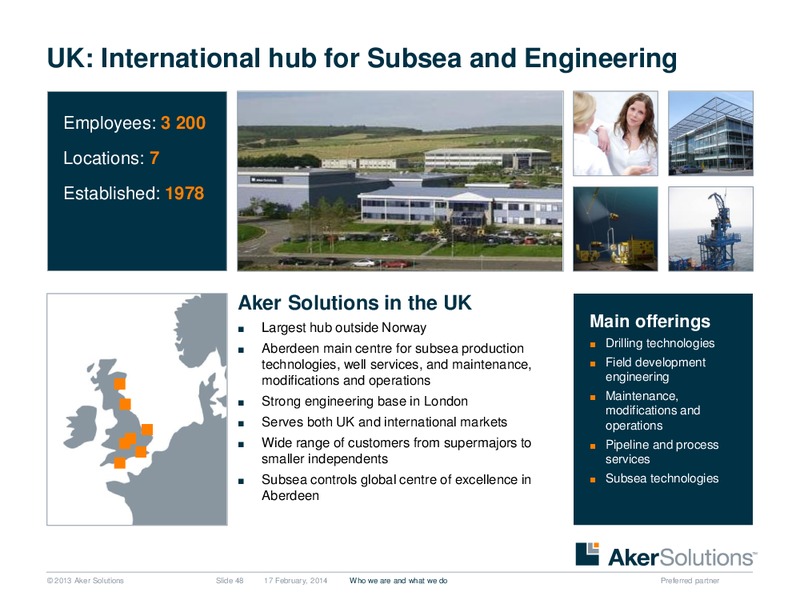
UK: International hub for Subsea and Engineering Employees: 3 200 Locations: 7 Established: 1978 Aker Solutions in the UK Largest hub outside Norway Main offerings Drilling technologies Aberdeen main centre for subsea…
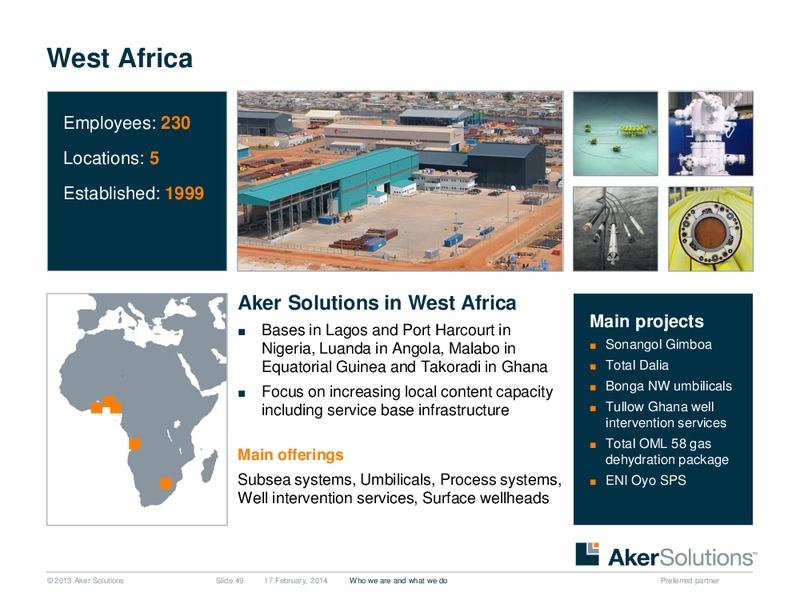
West Africa Employees: 230 Locations: 5 Established: 1999 Aker Solutions in West Africa Bases in Lagos and Port Harcourt in Main projects Nigeria, Luanda in Angola, Malabo in Sonangol Gimboa Equatorial Guinea and Takoradi in…
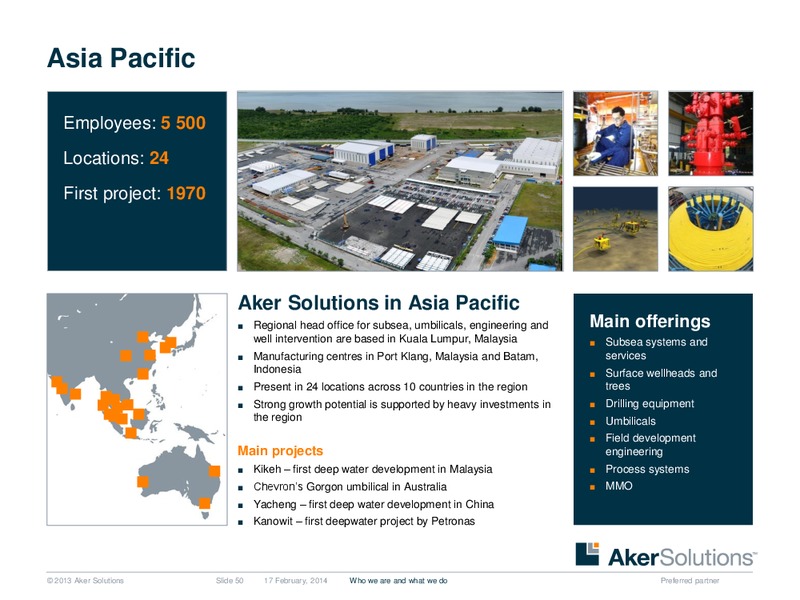
Asia Pacific Employees: 5 500 Locations: 24 First project: 1970 Aker Solutions in Asia Pacific Regional head office for subsea, umbilicals, engineering and Main offerings well intervention are based in Kuala Lumpur, Malaysia…
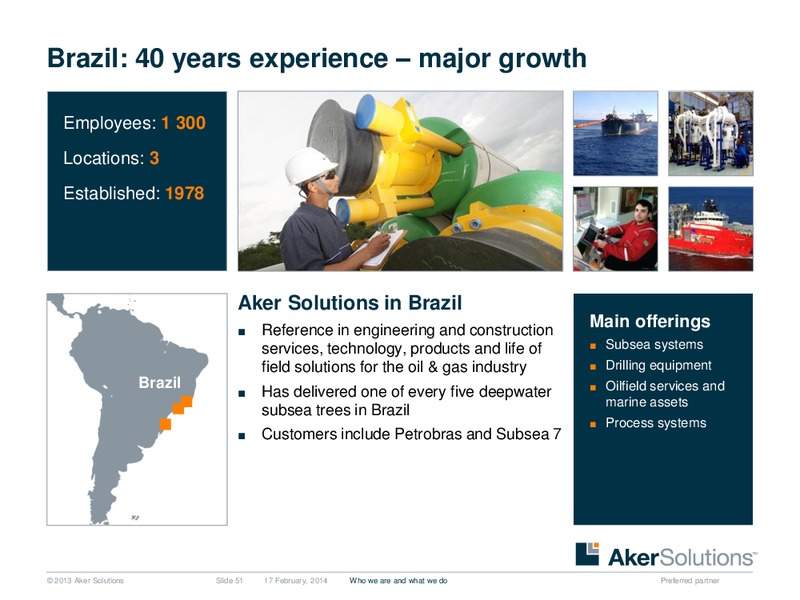
Brazil: 40 years experience major growth Employees: 1 300 Locations: 3 Established: 1978 Aker Solutions in Brazil Reference in engineering and construction Main offerings services, technology, products and life of Subsea…
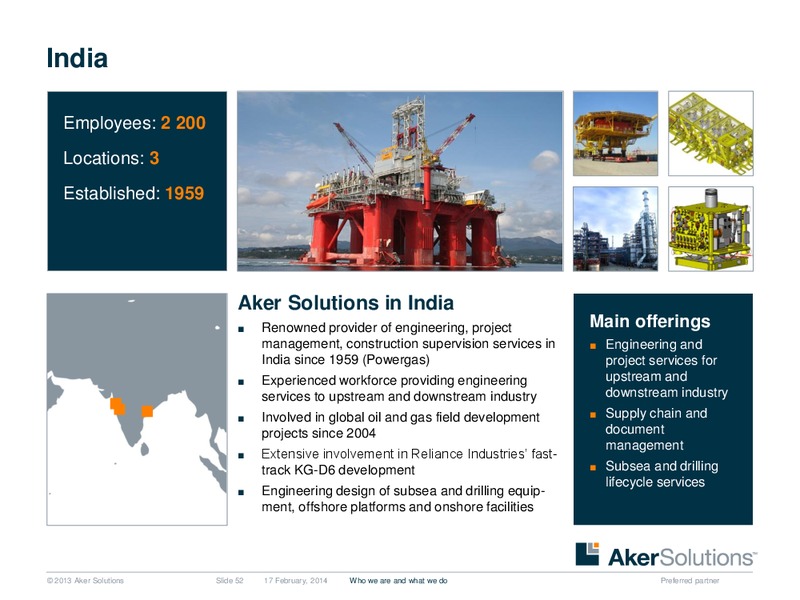
India Employees: 2 200 Locations: 3 Established: 1959 Aker Solutions in India Renowned provider of engineering, project Main offerings management, construction supervision services in Engineering and India since 1959…
 Loading...