Full Year 2014 Results ING Bank posts 2014 underlying net profit of EUR 3,424 million Ralph Hamers CEO ING Group Amsterdam 11 February 2015 www.ing.com
Key points Significant progress on restructuring in 2014 Dutch state fully repaid; NN Group stake reduced to 68%; Voya stake down to 19% Think Forward strategy launched in March 2014 and now embedded throughout the organisation More…
ING has made significant progress on strategic initiatives in 2014 We launched our Think Forward Bank strategy in March 2014 Creating a differentiating customer experience Investment in omnichannel approach in the Netherlands to create…
Our consistent customer focus contributed to strong results in 2014 Underlying net result Banking increased 8.5% from 2013 (in EUR mln) resulting in underlying RoE of 9.9% in 2014 3,424 3,155 10-13% 3,036 9.9% 9.0% 9.0% 2,450…
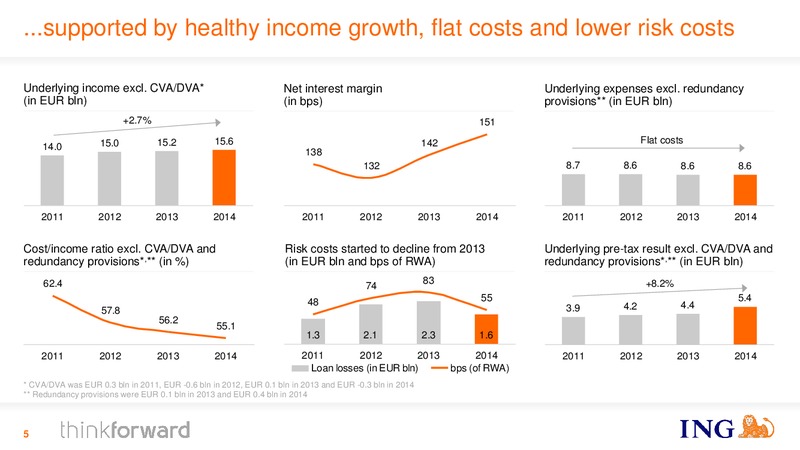
...supported by healthy income growth, flat costs and lower risk costs Underlying income excl. CVA/DVA* Net interest margin Underlying expenses excl. redundancy (in EUR bln) (in bps) provisions** (in EUR bln) +2.7% 151 15.0 15.2 15.6…
Expenses remained flat despite higher regulatory costs, higher pension costs and investments in future growth Efficiency measures absorbed significant upward pressure on the cost base (in EUR bln) 0.5 -0.7 0.2 0.3 -0.2 0.4 9.0 8.7…
Additional IT investments will deliver better service and harmonise systems and processes resulting in additional cost savings In November 2014, we announced to take the next steps in digital Redundancy provisions, investments and…
4Q14 results 8
Solid fourth quarter result Underlying pre-tax result ING Bank Major adjustments Pre-tax result ING Bank, excl. adjustments* (in EUR mln) (in EUR mln) (in EUR mln) 4Q13 1Q14 2Q14 3Q14 4Q14 +20.5% 1,486 1,570 1,278 CVA/DVA -17 -66 -58…
Our core lending franchises grew by 3.8% in 2014, despite de-risking of Russian exposure and higher pre-payment levels of Dutch mortgages Lending Assets ING Bank, 2014 (Client Balances, in EUR bln) Core lending businesses: EUR 18.5 bln…
Net interest result continued its upward trend, supported by higher margins on customer lending Underlying net interest income (excl. Vysya) and net interest margin Financial Markets contribution to change in NIM can be volatile (in EUR…
Savings rates further reduced, but savings margin slightly down due to lower re-investment yields Funds Entrusted Retail Banking, breakdown by business segment Further scope to protect NIM in low interest environment (in %, 4Q14) In the…
Risk costs down from 4Q13; up from 3Q14, which was positively impacted by a release on a large file Risk costs increased in 4Q14 but risk costs Retail Banking trending down (in EUR mln and bps of avg RWA) (in EUR mln) 560 81 177 400…
NPL ratio rose to 3.0%, reflecting new forbearance definition Non-performing loans excl. deconsolidation Vysya NPL ratio (in %) (in % and EUR bln) 4Q14 3Q14 16.9 Retail Banking 15.9 16.4 15.7 15.7 - Dutch Mortgages 2.6 2.0 - Business…
Risk costs Retail Netherlands down, driven by lower risk costs for Dutch mortgages Risk costs Dutch mortgages and Business Lending NL (in EUR mln) Non-performing loans Business Lending NL (in EUR bln and %) 7.8 82 74 68 62 41 2.3 2.3…
Dutch economy and housing market continued its positive momentum Dutch Purchasing Managers Index (PMI) was 54.1 in January 2015; GDP growth 2009-2015 above 50 indicates positive growth (in %) 70 1.7% 1.4% 1.1% 0.7% 60 54.1 50 -0.7% 40…
Strong capital position at Bank and Group level ING Bank CET1 fully-loaded ratio increased to 11.4% ING Group CET1 phased-in ratio increased to 13.5% 13.2% 13.5% 11.1% 11.4% 3Q14 4Q14 3Q14 4Q14 ING Banks CET1 ratio on a…
as well as strong Group results enable us to begin returning capital to our shareholders ahead of schedule 4Q14 net result ING Group includes net results NN Group and Voya Dividend pay-out ratio (in EUR mln) (in % of Group net profit)…
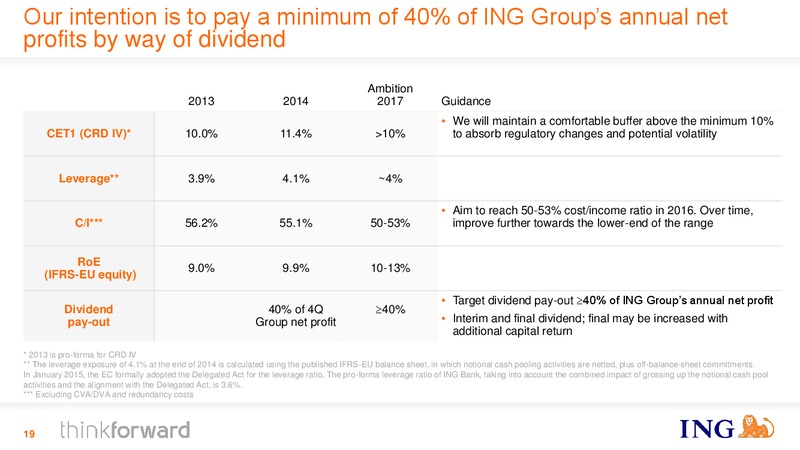
Our intention is to pay a minimum of 40% of ING Groups annual net profits by way of dividend Ambition 2013 2014 2017 Guidance We will maintain a comfortable buffer above the minimum 10% CET1 (CRD IV)* 10.0% 11.4% 10% to absorb…
Wrap up 20
Wrap up Significant progress on restructuring in 2014 Dutch state fully repaid; NN Group stake reduced to 68%; Voya stake down to 19% Think Forward strategy launched in March 2014 and now embedded throughout the organisation More…
Appendix 22
Full year 2014 net profit ING Group Full year 2014 net result ING Group includes net results NN Group and Voya (in EUR mln) 202 -1,021 3,424 65 -1,471 2,606 52 1,251 Underlying net result Net gains / losses Special items…
Reported ING Group capital structure at 31 December 2014 Reported ING Group capital structure - 31 December 2014 Illustrative calculation of impact deconsolidation NN Group ING Bank 38.1 Equity 50.4 We will divest our remaining 68.1%…
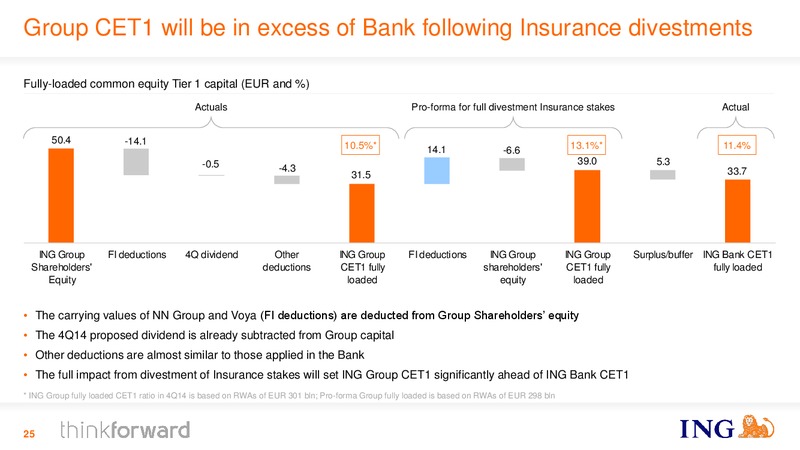
Group CET1 will be in excess of Bank following Insurance divestments Fully-loaded common equity Tier 1 capital (EUR and %) Actuals Pro-forma for full divestment Insurance stakes Actual 50.4 -14.1 10.5%* 13.1%* 11.4% 14.1 -6.6 -0.5…
ING Bank CRD IV common equity Tier 1 ratio fully-loaded 11.4% Impact CRD IV 4Q2014 (in EUR bln) Common equity Tier 1 capital RWAs Common equity Tier 1 ratio 31 December 2014 (Phased-in) 33.3 296.3 11.2% Defined benefit pension fund…
ING Bank has a sizeable capital buffer Total capital (in EUR billion)* ING Bank total Risk Weighted Assets (in EUR billion) 53.3 332 330 14.3% 16.5% 296 13.5% 16.5% 9.5 283 11 8.5 8.3 9.5 34 10.7 5.7 6.9 5.1 5.7 8.1 38.1 252…
We remain vigilant on expenses Underlying operating expenses Cost/income ratio excl. CVA/DVA, redundancy provisions and bank (in EUR bln) tax (in %) 55.2% 54.7% 375 76 53.6% 53.7% 11 149 52.6% 94 24 138 2,115 2,080 2,098 2,110…
Growth in core lending franchises was flat in the fourth quarter, partly due to pre-payments of Dutch mortgages and de-risking of Russian exposure Lending Assets ING Bank, 4Q14 (Client Balances, in EUR bln) Core lending businesses: EUR…
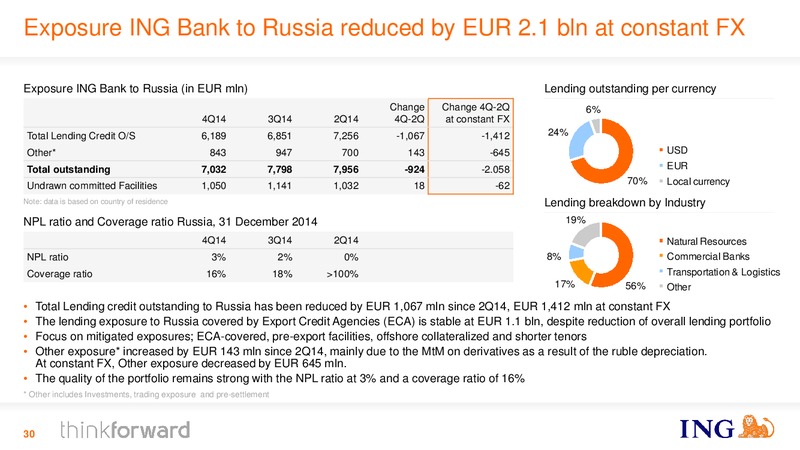
Exposure ING Bank to Russia reduced by EUR 2.1 bln at constant FX Exposure ING Bank to Russia (in EUR mln) Lending outstanding per currency Change Change 4Q-2Q 6% 4Q14 3Q14 2Q14 4Q-2Q at constant FX Total Lending Credit O/S 6,189…
Exposure ING Bank to the Ukraine Exposure ING Bank to the Ukraine (in EUR mln) Change Total Lending credit outstanding to the Ukraine has been reduced 4Q14 3Q14 2Q14 4Q-2Q by EUR 156 mln since 2Q14 Total Lending Credit O/S 1,214 1,289…
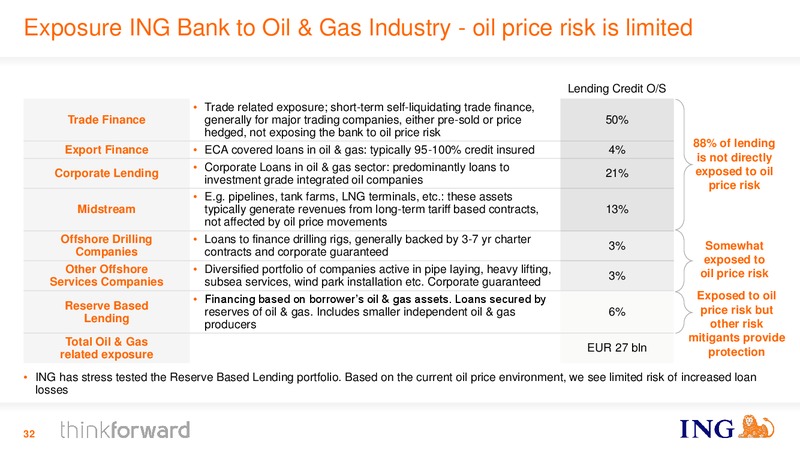
Exposure ING Bank to Oil & Gas Industry - oil price risk is limited Lending Credit O/S Trade related exposure; short-term self-liquidating trade finance, Trade Finance generally for major trading companies, either pre-sold or price…
 Loading...