First-Quarter Fiscal Year 2015 February 10, 2015 Muntalaq, Jeddah Metro, K.S.A.
Presenters Michael S. Burke Chief Executive Officer Stephen M. Kadenacy President Chief Financial Officer February 10, 2015 Page 3
AECOM Fiscal Year 2015 First-Quarter Highlights Adjusted net income1 of 102 million; up 70% year over year. 150+ COUNTRIES Q1 adjusted EPS of 0.711. OVER 30 MARKET SECTORS 40.7 billion in backlog. 4.6 billion in new wins.…
Healthy Book of Future Business & Revenue Visibility Backlog ( billions) 40.7 19.1 Q1 FY15 Highlights: 40.7 billion in backlog. Organic backlog growth of 18% YoY on a 25.1 constant currency basis. 13.7 4.6 billion of new wins.…
Segment Results Design & Consulting Services (DCS) DCS: Key Points: Delivers planning, consulting, architectural and Backlog increased sequentially and from the prior engineering design services to commercial and year, driven by…
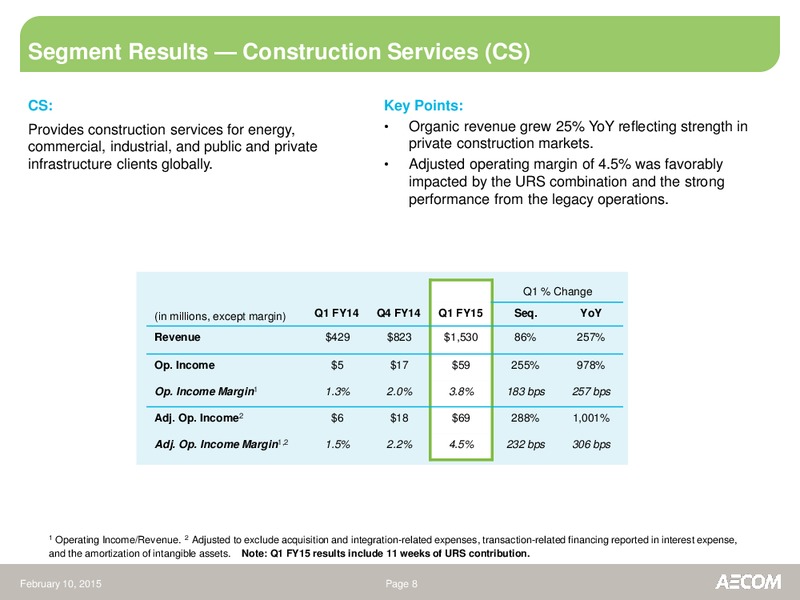
Segment Results Construction Services (CS) CS: Key Points: Provides construction services for energy, Organic revenue grew 25% YoY reflecting strength in commercial, industrial, and public and private private construction markets.…
Segment Results Management Services (MS) MS: Key Points: Provides program and facilities management and Organic MS revenue declined 8.3% YoY due to OCO maintenance, training, logistics, consulting, wind-down, partially offset by…
FCF and Debt Reduction Drive Balanced Capital-Allocation Strategy AECOM is focused on a balanced capital-allocation strategy supported by a prudent and conservative capital structure. Debt reduction is now our first priority.…
Fiscal 2015 Financial Outlook Adjusted EPS1 of 2.75-3.35. Assumptions: Effective tax rate2 of approximately 30%. FY15 share count of approximately 151 million. 50 weeks of URS contribution. Approximately 210 million in depreciation…
Q1 FY15 Business Highlights & Outlook Design & Consulting Services Construction Services Management Services Delivered Americas design Private construction activity Legacy operations performed backlog growth. driving growth. well…
AECOM: A Leading Global Engineering and Construction Services Company 1 global design firm1 with top rankings in key end markets: Facilities; Transportation; Environmental; and Power & Energy. Geographic footprint, services…
Appendix: Reconciliation for Amortization, Acquisition & Integration Expenses February 10, 2015 Page 14
Appendix: Diversified Geographies, End Markets, Funding Sources and Contract Type Funding Sources Non-U.S. Government 15% Private U.S. State/Local 14% End Markets 48% Geographies Federal/ Canada Support Services…
Thank you 100K Employees Nearly 100,000 dedicated professionals globally 19 Billion 19 billion in pro-forma revenue 150+ Countries for LTM ended Dec. 31, 2014 Serving clients in over 150 countries around the world…
 Loading...