Annual General Meeting April 30, 2014 Ryan Kubik President & Chief Executive Officer Canadian Oil Sands Limited
Presentation Overview 1. Our Strategic Focus 2. Results and 2014 Outlook 3. COS Investment Catalysts
STRATEGIC FOCUS
Syncrude: A High Quality Resource Established production base Long-life reserves Fully upgraded light, sweet crude oil Proven operator and proven technology Predictable reservoir recovery over 90%
Highly Leveraged to Increasing Crude Oil Prices1 Illustrative cash flow from operations (/share)2 4.00 3.00 2014 estimate 2.00 1.00 0.00 WTI (US/bbl) 70 80 90 100 110 All figures in Canadian dollars unless otherwise…
Dividends Reflect Free Cash Flow Over Time (1,2) millions Annual Total Dividends Cumulative Dividends/FCF 2,400 8,000 2,100 7,000 1,800 6,000 Dividends 1,500 5,000 1,200 4,000 Cumulative Dividends 900 3,000 600 2,000…
RESULTS & OUTLOOK
2013 Results Cash flow from operations of 1.3 billion Completed two major capital projects, ahead of schedule and 250 million under budget Paid quarterly dividends of 0.35/share, or 678 million Sales volumes of 98,000 bbl/d at…
First Quarter Results Q1 2014 Q1 2013 Actual 1 Actual 2 Sales volume (bbl/d) 105,300 95,700 Realized SCO selling price (/bbl) 105.73 96.11 Operating expenses (/bbl) 46.91 41.20 Net income (/share) 0.35 0.37 Cash flow from…
2014 Outlook 20141 Sales volume (bbl/d)2 100,700 Realized selling price (/bbl) 96.00 Operating expenses (/bbl) 46.08 Cash flow from operations (millions)3 1,194 Cash flow from operations (/share)3 2.46 1. 2014 Outlook as…
COS INVESTMENT CATALYSTS
Syncrudes path to PRODUCTION GROWTH
Operating Leverage Syncrude production Thousand barrels per day 400 350 Average production of 287,000 bbl/d since 2007 300 250 200 150 100 50 0 2007 2008 2009 2010 2011 2012 2013 2014F Every 2 million bbl change in…
Reliability Initiatives Across The Operation
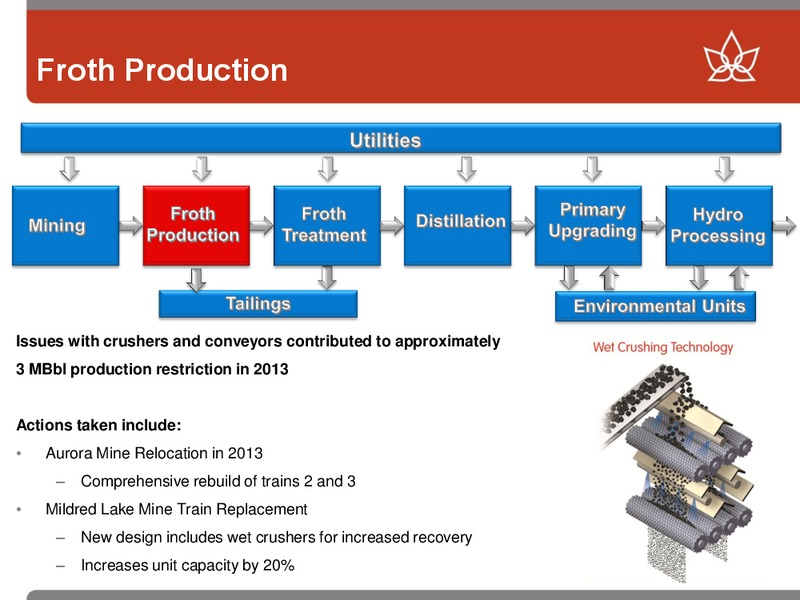
Froth Production Issues with crushers and conveyors contributed to approximately 3 MBbl production restriction in 2013 Actions taken include: Aurora Mine Relocation in 2013 Comprehensive rebuild of trains 2 and 3 Mildred Lake…
Froth Treatment and Distillation High solids in the bitumen feed causing furnace tube leaks downstream in distillation units contributed to approximately 2 - 4 MBbl production restriction. Actions taken include: Improved product…
Hydro Processing Fouled hydrogen plant exchanger Reliability issues in hydro processing have led to as much as 5 MBbls/yr of lost production Actions taken include: Program to replace the waste heat recovery exchangers in all…
Utilities Gas Turbine Generator Additional steam and power utilities planned in 2017
Completing Syncrudes MAJOR PROJECTS
Major Projects Capital Expenditure Profile millions, net to Canadian Oil Sands 1000 Centrifuge Tailings Management 900 Mildred Lake Mine Train Replacement Aurora North Tailings Management 800 Aurora North Mine Relocation 700…
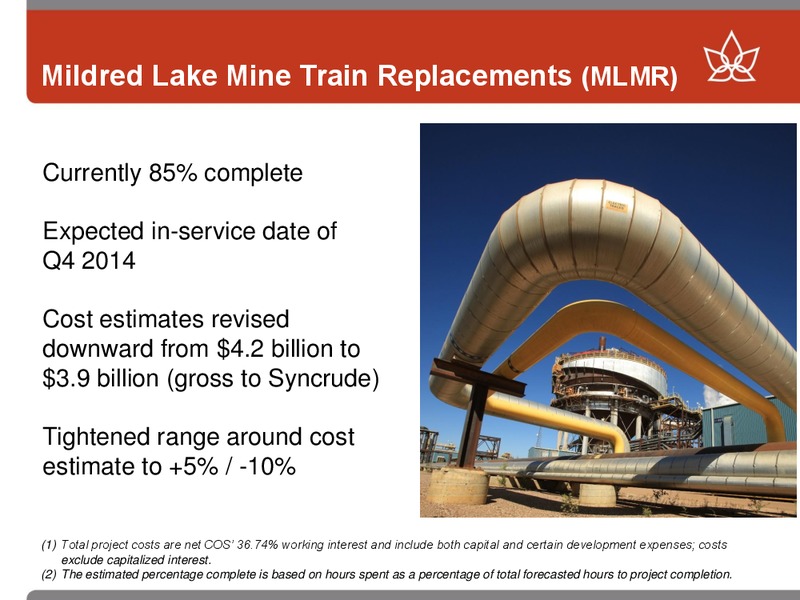
Mildred Lake Mine Train Replacements (MLMR) Currently 85% complete Expected in-service date of Q4 2014 Cost estimates revised downward from 4.2 billion to 3.9 billion (gross to Syncrude) Tightened range around cost estimate to +5% /…
Centrifuge Tailings Management Project Currently 75% complete Expected in-service date of first half of 2015 Cost estimate remains at 1.9 billion (gross to Syncrude) Range around the cost estimate remains at +15% / -15% (1) Total…
Markets for COS Syncrude Production Kitimat Syncrude Edmonton Burnaby Hardisty Quebec City Montreal Sarnia Chicago Patoka Cushing Current synthetic crude oil markets Houston Potential new markets
World Energy Demand by Fuel Type Global energy needs expected to increase by 30% Oil use is expected to increase 13% to 101 million barrels per day Source: International Energy Agency, World Energy Outlook 2013
Oil as a Transportation Fuel Globally, liquids (mostly crude oil) meet 95% of transportation needs Source: International Energy Outlook 2013; US Energy Information Administration
Production Declines Dramatically Without Further Investment Source: International Energy Agency, World Energy Outlook 2013; Production declines from all currently producing fields in the absence of further investment.
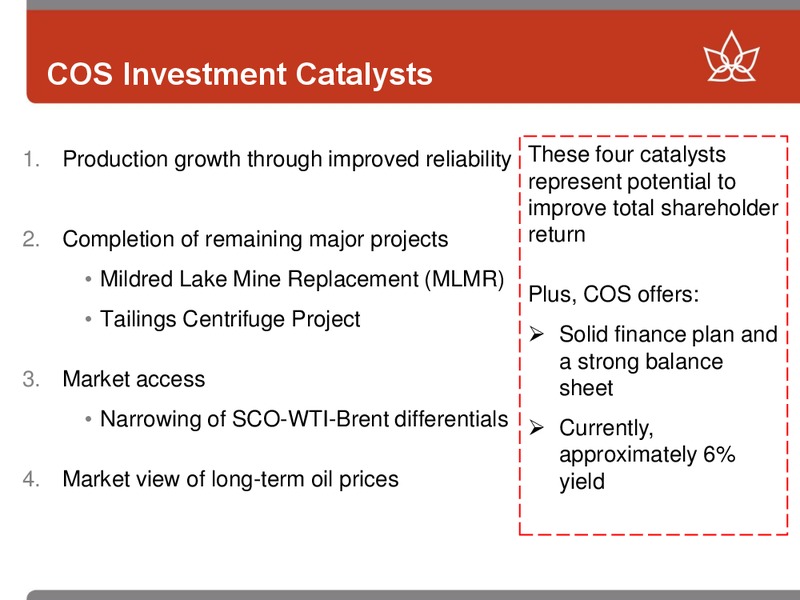
COS Investment Catalysts 1. Production growth through improved reliability These four catalysts represent potential to improve total shareholder 2. Completion of remaining major projects return Mildred Lake Mine Replacement (MLMR)…
 Loading...