Emerge Energy Services LP Investor Presentation March 2015 www.emergelp.com PAGE 1
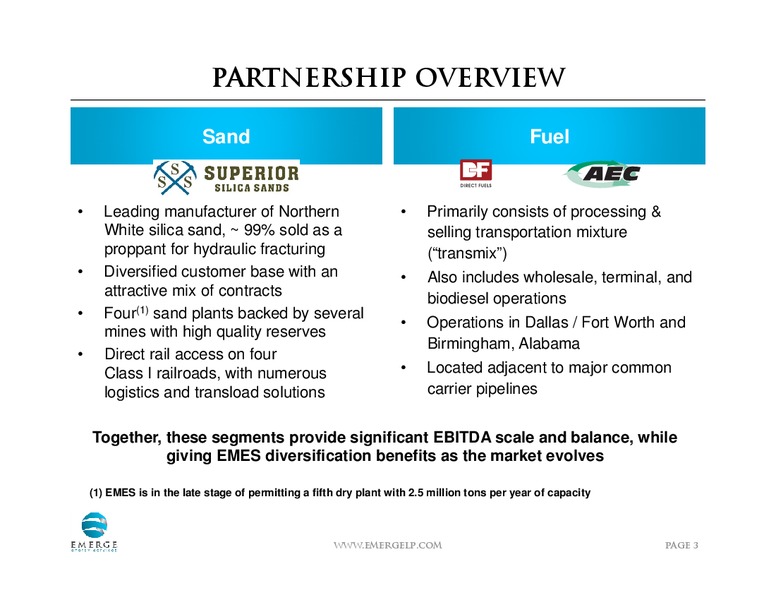
Partnership Overview Sand Fuel Leading manufacturer of Northern Primarily consists of processing & White silica sand, 99% sold as a selling transportation mixture proppant for hydraulic fracturing (transmix) Diversified customer…
Investment Considerations High Quality, Stable Strategically Cash Flow Located Assets Significant Intrinsic Organic Logistics Growth Advantages Capacity Strong Reputation w/ Low Cost Customers and Operating…
SAND SEGMENT www.emergelp.com PAGE 5
From Mine to Railcar Extract Wash Dry Ship www.emergelp.com PAGE 6
Adjusting to the Market The energy industry is cyclical, which is why Emerge Energy has been built from the ground up as a full-cycle company In tough times, we aim to thrive, not just survive We are delaying and reducing our capital…
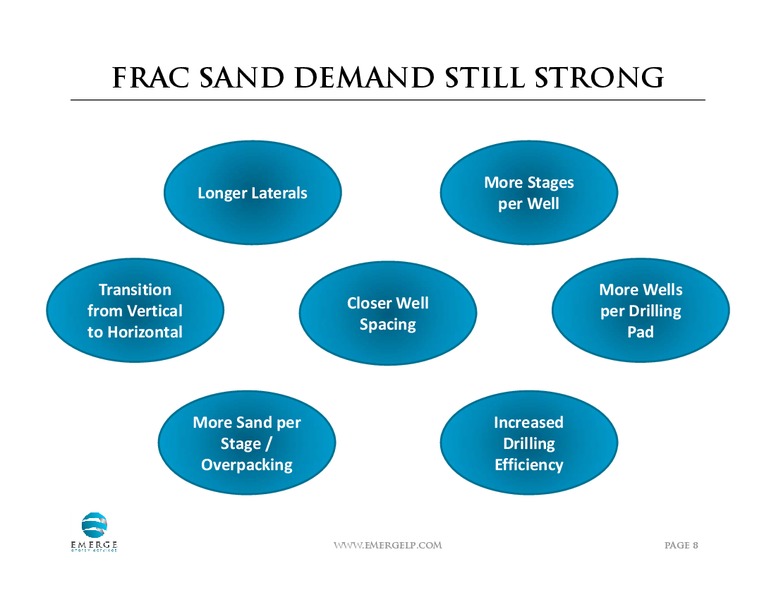
Frac Sand Demand Still STRONG More Stages Longer Laterals per Well Transition More Wells from Vertical Closer Well per Drilling to Horizontal Spacing Pad More Sand per Increased Stage / Drilling Overpacking…
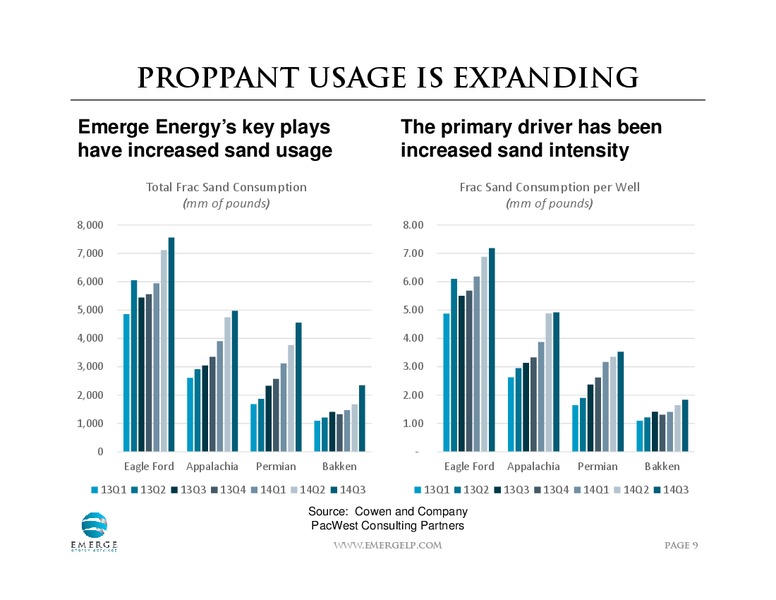
Proppant Usage is Expanding Emerge Energys key plays The primary driver has been have increased sand usage increased sand intensity Total Frac Sand Consumption Frac Sand Consumption per Well (mm of pounds) (mm of pounds) 8,000 8.00…
The Strong Are Getting Stronger Taking the Lead Solid Long-Term Sales Customers are gravitating to the top Long-term contracts for 100% of 6-8 frac sand producers: current capacity Consistent high quality and more reliable Additional…
High Quality & Low Cost The Right Sand Full Weather Operations Emerge Energy sand exceeds API Fully enclosed dry plants for year- and customer specs round operations, regardless of Over 60% of Emerge Energys weather Northern White…
Diversified Sales Portfolio 2014 Sales by Customer 2014 Sales by Basin (52 Total) Eagle Ford Permian Marcellus Canada Cust A Cust B Cust C Cust D Bakken MidCon Barnett Rockies Cust E Cust F Cust G Cust H Haynesville Other Cust I…
Economics By Basin Emerge Energy focuses on basins with strong economics WTI Oil Breakeven Price ( per Bbl) at 3.60/Bbl Natural Gas 90.00 EMES Focus Plays 80.00 70.00 60.00 50.00 40.00 30.00 20.00 10.00 0.00 Source: Credit…
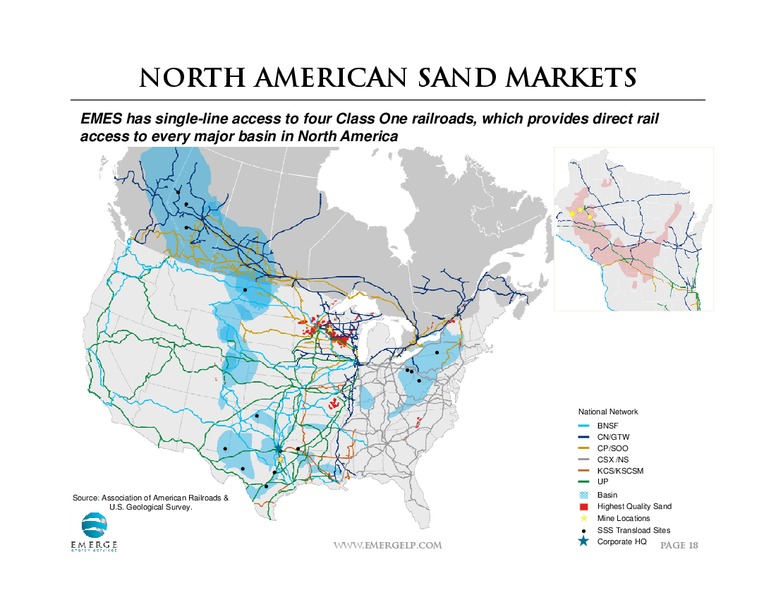
Strong Logistics Platform Our Wisconsin sand facilities have direct access on four Class One rail lines and can reach all major shale plays in North America on single-line hauls Emerge Energy currently has 15 transload locations…
The Future Is Global As the US shale revolution is transforming hydrocarbon production, Emerge Energy is positioning itself as the supplier of choice Northern White sand is only available in North America, and the coarsest…
Sand Asset Summary Wet Plant Location Proven Recoverable Primary Reserve Plant Capacity 2014 Produciton Reserves (1) Composition (Thousands of Tons) (Thousands of Tons) New Auburn, WI 27.8 mm tons 14-60 mesh 2,000 1,332 Thompson…
CURRENT Operations Process Flow Thompson Hills FLS/Arland LP Mine Church Road Barron Arland CN New Auburn New Auburn MNNR BNSF, UP CN, CP, UP Kosse Kosse www.emergelp.com PAGE 17
North American Sand Markets EMES has single-line access to four Class One railroads, which provides direct rail access to every major basin in North America National Network BNSF CN/GTW CP/SOO CSX /NS KCS/KSCSM UP Source:…
Sand Segment Growth Opportunities 8.3 million tons per year under contract with an average life of 4.0 years, including commitments for facilities under construction Contracts and In negotiations for additional tons through multi-year,…
FUEL SEGMENT www.emergelp.com PAGE 20
Fuel Segment Operations Fuel Segment provides a stable base with meaningful growth opportunities Transmix Terminal 2014 2014 Terminal 2014 Fuel from Pipeline Processing Tankage Wholesale Throughput Transmix Sold Connectivity…
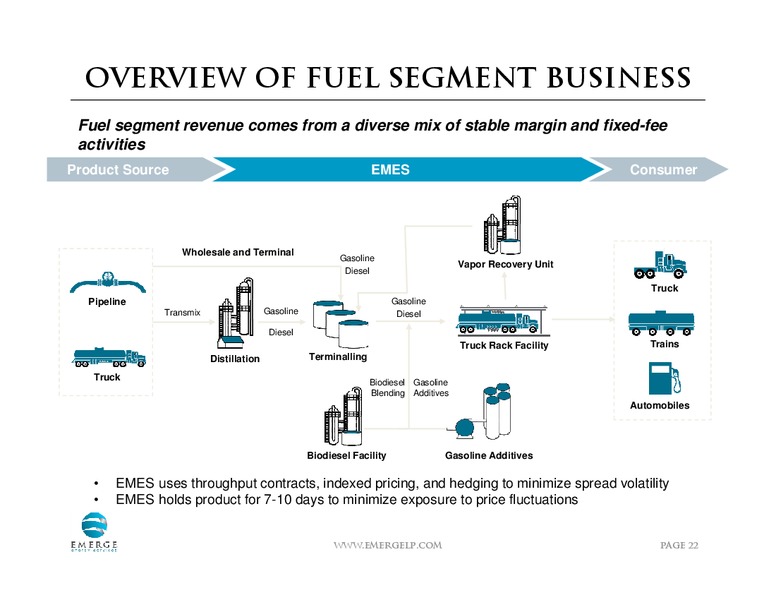
Overview of Fuel Segment Business Fuel segment revenue comes from a diverse mix of stable margin and fixed-fee activities Product Source EMES Consumer Wholesale and Terminal Gasoline Vapor Recovery Unit Diesel Truck Pipeline…
Refined Product Pipelines in the US Transmix facilities are primarily located along major refined products pipelines Direct AEC Fuels Refined Products Pipeline Transmix Facilities EMES FP&D Facilities www.emergelp.com PAGE…
Per Gallon Fuel Margins Rapid 2H 2014 backwardation compressed fuel margins; current market has reversed recent trends Aggregate per Gallon Fuel Margin 0.250 0.200 0.150 0.100 0.050 (0.050) (0.100) (0.150) Q1…
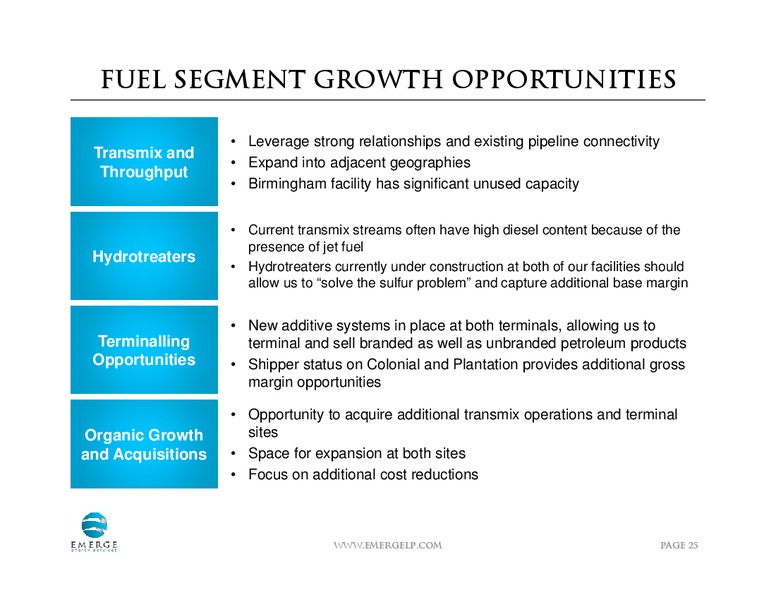
Fuel Segment Growth Opportunities Leverage strong relationships and existing pipeline connectivity Transmix and Expand into adjacent geographies Throughput Birmingham facility has significant unused capacity Current transmix…
FINANCIAL OVERVIEW www.emergelp.com PAGE 26
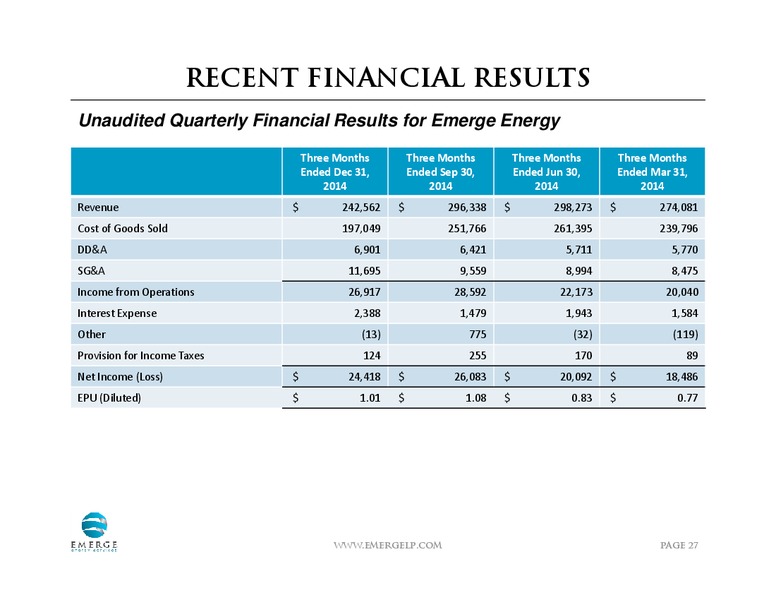
Recent Financial Results Unaudited Quarterly Financial Results for Emerge Energy Three Months Three Months Three Months Three Months Ended Dec 31, Ended Sep 30, Ended Jun 30, Ended Mar 31, 2014 2014 2014 2014 Revenue 242,562 296,338…
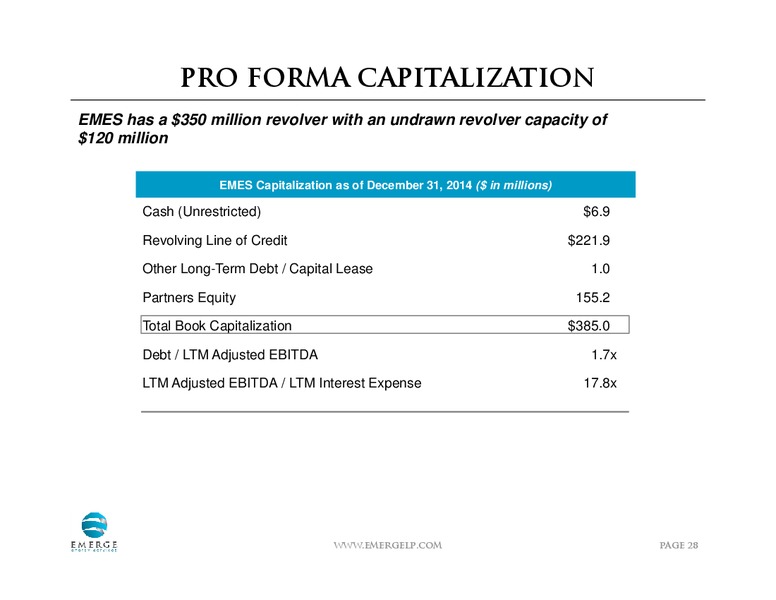
Pro Forma Capitalization EMES has a 350 million revolver with an undrawn revolver capacity of 120 million EMES Capitalization as of December 31, 2014 ( in millions) Cash (Unrestricted) 6.9 Revolving Line of Credit 221.9 Other…
Selected Historical Sales Volumes Sand Sales by Quarter Fuel Sales by Quarter Thousands of Tons Thousands of Gallons 1,400 80,000 1,200 70,000 60,000 1,000 50,000 800 40,000 600 30,000 400 20,000 200 10,000 0 0 1Q 2Q 3Q…
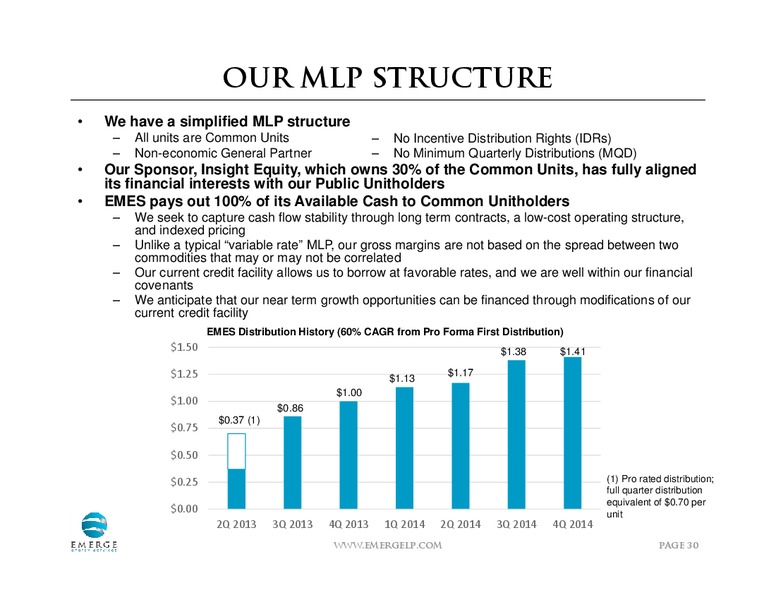
Our MLP Structure We have a simplified MLP structure All units are Common Units No Incentive Distribution Rights (IDRs) Non-economic General Partner No Minimum Quarterly Distributions (MQD) Our Sponsor, Insight Equity, which owns 30%…
Closing Thoughts Emerge Energy has become a leader in the market because of high quality assets, customer relations, customer service, and logistical capabilities We believe we are better positioned to thrive throughout the oil &…
APPENDIX www.emergelp.com PAGE 33
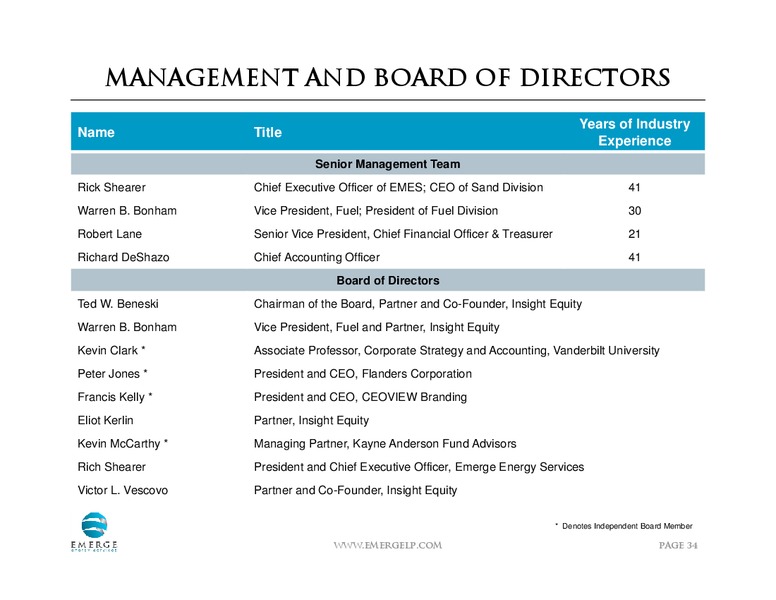
Management and Board of Directors Years of Industry Name Title Experience Senior Management Team Rick Shearer Chief Executive Officer of EMES; CEO of Sand Division 41 Warren B. Bonham Vice President, Fuel; President of Fuel Division…
Non-GAAP Reconciliation The following table presents a reconciliation of Adjusted EBITDA to the most directly comparable GAAP financial measures for each of the periods indicated. Three Months Three Months Year Year Reconciliation of…
Emerge Energy Services LP Investor Presentation March 2015 www.emergelp.com PAGE 36
 Loading...