2013 Full-year results Investor Presentation 19 February 2014
2013 Key Achievements 1 2013 Full-year results
KEY ACHIEVEMENTS POSITIONED FOR FUTURE GROWTH Record production of 87 MMboe. Record full year dividends of Total recordable injury rate of 3.0, a 27% US 249 cents per share. improvement on 2012. Pluto shipped Value focused…
FINANCIAL HEADLINES Record production and our second highest reported profit. Operating revenue 5,926 million Full year of Pluto production Reported Net Profit after Tax 1,749 millionSecond highest result in the companys history…
Strategy Delivering on our commitments and positioned for growth. Delivered 2013 Whats next 2014, 2015+ Pluto reliable production Browse FEED, FID NR2 on time, on budget Leviathan Domgas FID Projects Vincent refurbishment GWF 1, GWF…
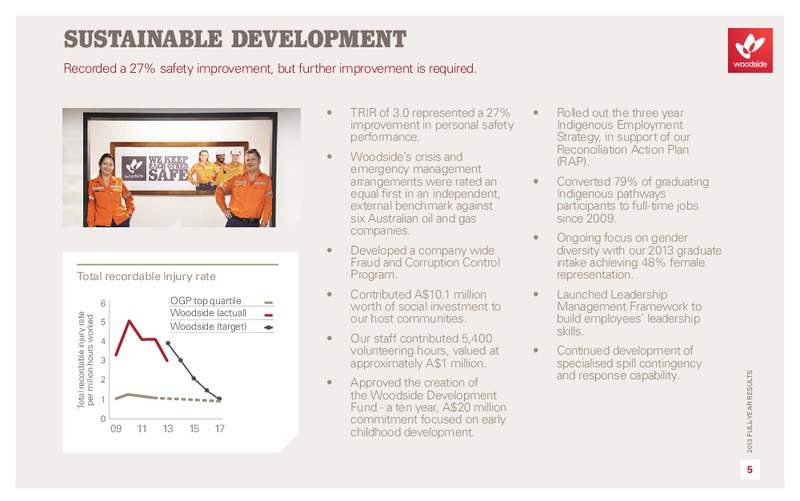
SUSTAINABLE DEVELOPMENT Recorded a 27% safety improvement, but further improvement is required. TRIR of 3.0 represented a 27% Rolled out the three year improvement in personal safety Indigenous Employment performance. Strategy, in…
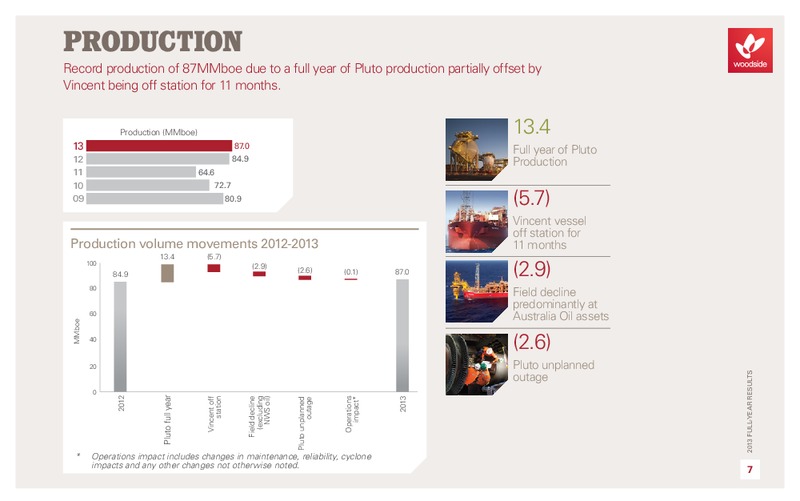
Production Record production of 87MMboe due to a full year of Pluto production partially offset by Vincent being off station for 11 months. Production (MMboe) 13.4 13 87.0 Full year of Pluto 12 84.9 Production 11 64.6 10 72.7 09…
operating revenue Revenue from a full year of Pluto was more than offset by lower oil volumes associated with Vincent being off station and field decline. Operating revenue Table 1 - Sales Volumes All in MMboe 2013 2012 Variance…
Unit PRODUCTION costs 2013 unit costs reflect a full year of Pluto production, Vincent being off station for 11 months and field decline at our late life oil assets. Gas production costs Oil production costs Gas costs 2013 increase in…
cash MARGINS Each of our businesses continue to generate healthy unit cash margins. Increased weighted average unit Weighted average unit cash 2013 Unit cash margins by cash margins are anticipated in margin trend business unit 2014…
Reported Profit Our second highest reported profit, exceeded only in 2012 due to the Browse partial equity gain on sale. Reported profit (974M) Impact of Browse (US million) partial equity sale in 13 1,749 2012 12 2,983 11 10…
Impairments oF oil & gas properties Impairments driven primarily by late life oil assets. Enfield: abandoned Cimatti tie back Impairments (pre-tax) proposal; reduction in the ultimate future production and an increased restoration…
Investment EXPENDITURE Investment for value adding growth. 4000 660 506 US2.2 billion Approximate 2014 total investment expenditure includes the following: 3000 Regional Market Opportunities Cost-effective pipeline export…
Liquidity Cash and undrawn facilities of US3.8 billion to fund growth. Capital management is guided by maintaining strong Cash and debt position Debt maturity profile investment grade credit rating 9,000 to ensure access to global…
free cash flow Nearly 6 billion in cumulative free cash flow in past 2 years. Two year cumulative free cash flow of Free cash flow (operating less investing) 5.9 billion. 3,636 4,000 2012 was impacted by additional 3,000 2…
dividendS Record full year dividend, up 92% on 2012. Record full year dividends of Dividends per share US249 cents per share, including: (US cents per share) 63 cps special dividend 83 cps interim dividend 103 cps final dividend.…
Dividend calculation methodology Methodology change adds back impairments for dividend calculation. The 2013 final dividend calculation is Calculation methodology based on our underlying profit adjusted for the impact of impairments…
consensus Reported profit and dividend in line with consensus. Item USM NPAT and dividend result is consistent with market Consensus Reported Net Profit after Tax 1,753 expectations. Woodside Reported Net Profit after Tax 1,749…
Segment performance Australian Oil adversely impacted by Vincent being off station. NWS continues to deliver a Business unit performance significant contribution to our bottom line, with 55% of operating NWS Pluto Aus Oil revenue…
NPAT Woodside adopts ASICs Regulatory Guide 230 for non-recurring items. 2013 2012 Variance Our approach to impairments Production volume (MMboe) MMboe 87.0 MMboe 84.9 % 2.5 maintains the integrity of Sales volume (MMboe) 85.7…
NPAT Sensitivities For 2014, a US1 A decrease in the movement in the AUD: USD exchange Brent oil price is rate by 0.01 is expected to impact anticipated to NPAT by US34 increase NPAT by million. US4 million. 2013 Full-year…
2013 FULL-YEAR RESULTS Development updates 2013 Full-year results 22
Browse FLNG enables earliest commercialisation. The Browse Joint Venture selected FLNG as the development concept for entry into basis of design (BOD). BOD work in relation to the FLNG development concept is continuing, to support a…
Leviathan OPPORTUNITY Net 4.7 Tcf of natural gas and 8.5 MMbbl of condensate 2C contingent resource opportunity for Woodside. World Class Asset Estimated 2C contingent resource (100%) of 18.9 Tcf of natural gas and 34.1 million…
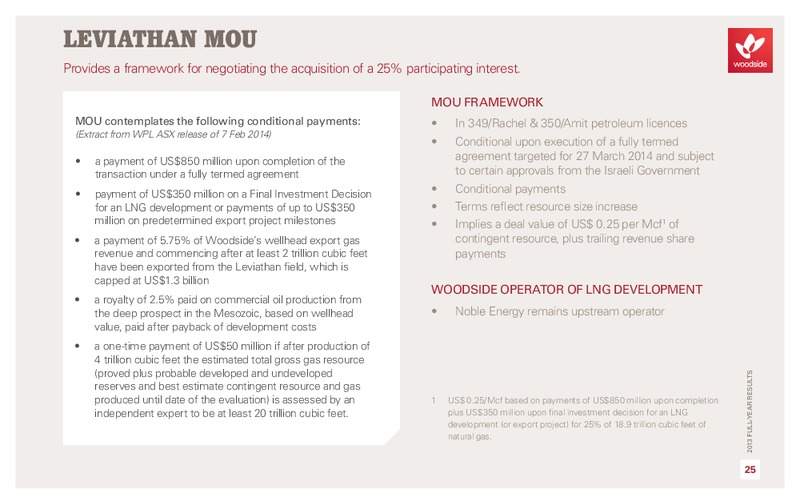
Leviathan MoU Provides a framework for negotiating the acquisition of a 25% participating interest. MOU framework MOU contemplates the following conditional payments: In 349/Rachel & 350/Amit petroleum licences (Extract from WPL ASX…
Leviathan DEVELOPMENT CONCEPT Joint venture targeting 2014 FID for potential domestic gas development. Development Options Progressing Phased offshore development Gas FPSO and fixed platform development targeting regional pipeline…
Leviathan MARKET OPPORTUNITIES Gas markets include domestic, regional and LNG export. Gas Markets Diversified domestic supply to Israel A range of regional and LNG export opportunities are under consideration Domestic Gas…
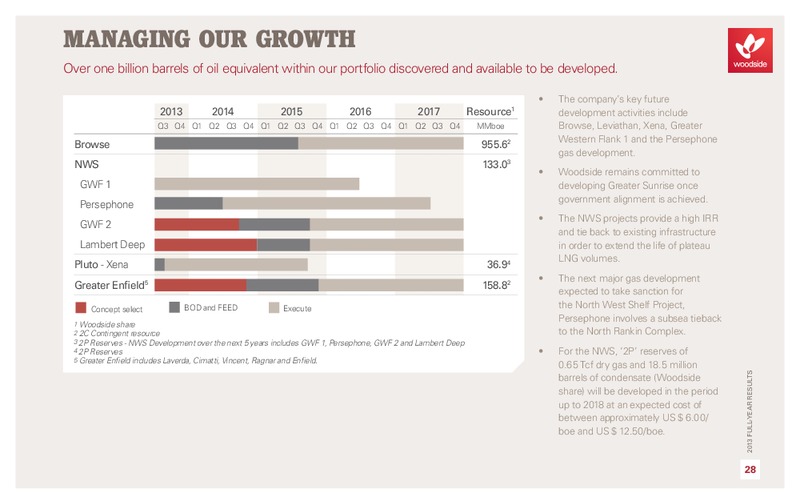
Managing our growth Over one billion barrels of oil equivalent within our portfolio discovered and available to be developed. The companys key future 2013 2014 2015 2016 2017 Resource1 development activities include Q3 Q4 Q1 Q2 Q3 Q4…
Global exploration - 2013 achievements Includes three new basin entries and extensive seismic activity. Mandalay Sagaing MYANMAR AUSTRALIA Myanmar Magwe Production Sharing Contracts Acquisition of over 10,000 km2 of 3D seismic…
Global exploration - 2014 Targets Securing two drill rigs enables increased exploration activity. 2014 2015 Size 2014 PLANNED ACTIVITY Q1 Q2 Q3 Q4 Q1 Drill up to seven wells, five in Drilling Volume* Rydal Small Australia and up…
AUSTRALIAN DRILLING Exploration in Australia continues to focus on high value infill opportunities, and new opportunities in both emerging and frontier acreage. 2 drill rigs secured for 2013/14 drilling program. 33 exploration permits…
PRODUCT PRICING Enhanced LNG prices are expected in 2014, assuming oil prices remain strong. Our heavy sweet crude oil produced in the North West of Western Australia still continues to receive strong premiums relative to Dated Brent…
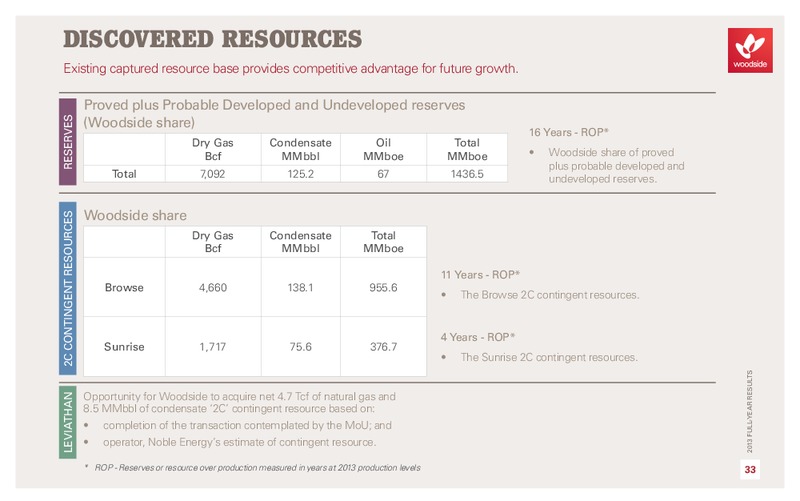
discovered resources Existing captured resource base provides competitive advantage for future growth. Proved plus Probable Developed and Undeveloped reserves (Woodside share) RESERVES 16 Years - ROP* Dry Gas Condensate Oil…
POSITIONED FOR FUTURE GROWTH Strong and stable production volumes supporting growth opportunities. Financial position supporting high dividends and low gearing. Company strategy overhauled and changes implemented. Immediate…
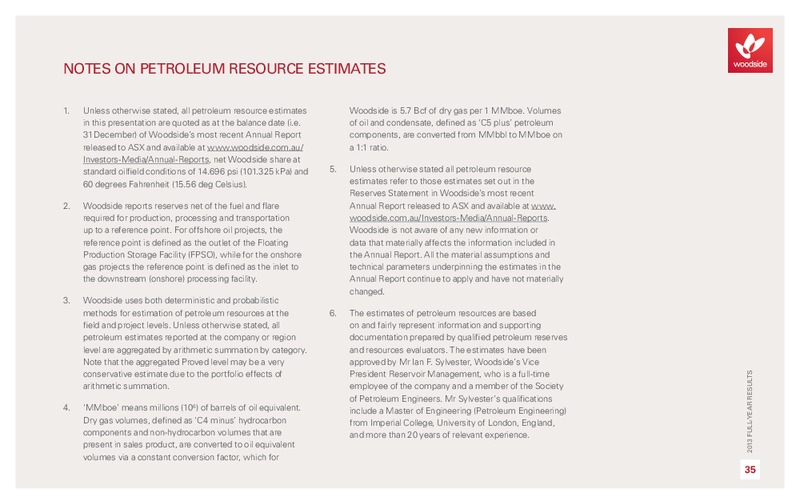
Notes on Petroleum Resource Estimates 1. Unless otherwise stated, all petroleum resource estimates Woodside is 5.7 Bcf of dry gas per 1 MMboe. Volumes in this presentation are quoted as at the balance date (i.e. of oil and condensate,…
2013 Full-year results Investor Presentation 19 February 2014 Head Office: Woodside Petroleum Ltd 240 St Georges Terrace Perth WA 6000 Australia Postal Address: GPO Box D188 Perth WA 6840 Australia t: +61 8 9348 4000 Visit us at…
 Loading...