Bank of America Merrill Lynch 2013 Global Energy Conference November 21, 2013
U.S. Silica is Attractively Positioned Company Profile Operations Footprint Low cost, high quality U.S. Silicasilica supplier Overview Mauricetown 15 facilities and over 100 years of history Mapleton Hard to emulate production…
Two Strong, Complimentary Business Segments Business Oil & Gas Industrial & Specialty Products Segments Whole grain silica Northern White raw sand proppants Ground silica 20/40, 30/50, 40/70 and 100 mesh that Products are used…
SLCA: A Unique Value Proposition Early Innings of Rapid Demand Growth Shale Revolution A Balanced Mix of Stable and Better Insulated From Growing Markets Market Forces and Entrants Sustainable Competitive Grow Faster…
Driving Success with Scale, Innovation & Creativity Segment Strategic Goal Key Actions & Triggers Role of M&A Oil & Gas Increase Market Sparta expansion complete Accelerate Share growth New actionable sites being explored through…
Growing Demand for Proppant Horizontal Wells Lateral Stages per Proppant Proppant Rig Count per Rig Length Lateral per Stage Demand Growth Drivers l Proppant growth has outpaced rig count growth due to higher service intensity…
Building Capacity to Meet Demand Growth New mine and plant near Utica, IL Project 35% complete 1.5MM tons annual capacity of frac sand Scheduled to come online in Spring 2014 6MM tons of O&G capacity exiting 2014 8
Expanding Our Logistics Capabilities Transportation Assets Railroad access on BNSF, Union Pacific, CN, CP and CSX 3,600 railcars, 4,300 by end of 2014 New agreement with Wildcat 40 in-basin transloads, many of which can be turned…
Getting Closer to the Wellhead New San Antonio transload 15K tons of storage capacity Joint venture with BNSF Serves Eagle Ford basin Unit train capable Run rate of over 500K tons on an annual basis 10
Emerging Trends in Oil and Gas In response to market conditions, customer relationships are shifting PAST FUTURE Consolidation leading to fewer, Supplier Mix of large, medium and small larger suppliers with low cost & Landscape…
Key to Success: Low Cost Producer U.S. Silica Frac Plants vs. 2012 Industry Cost Curve New Project Examples Cost per Ton (1) Royalties, road fees, no High access to Cost natural gas, etc. 2012 Trucking to Demand Class I rail…
A Balanced Mix of Stable and Growing Markets Revenue by Segment 350 Revenues Protected By Revenue (millions) 300 Superior product offering 250 Diversified ISP business 200 Long-standing, sticky customer relationships Oil &…
Unique Industrial & Specialty Position Segment Applications Drivers of Stability Glass Smartphones, tablets, U.S. Silicas multiple plants provide supply containers, automotive glass and fiberglass redundancy and low transportation…
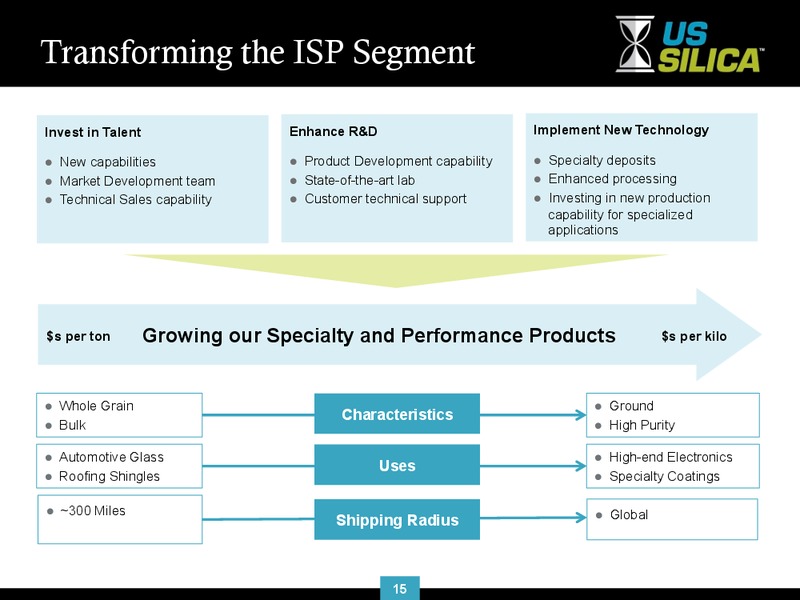
Transforming the ISP Segment Invest in Talent Enhance R&D Implement New Technology l New capabilities l Product Development capability l Specialty deposits l Market Development team l State-of-the-art lab l Enhanced processing l…
Capital Allocation Strategy Our Three Priorities 1) Reinvest in the Business Process improvements New Greenfield mine and production facilities 2) Enhance Shareholder Value Mergers & acquisitions New product developments 3)…
Strong Balance Sheet to Fund Growth Initiatives Summary Capitalization (US in thousands) l 50MM total available borrowing base under 9/30/2013 12/31/2012 revolving line-of-credit Cash and Cash Equivalents 128,687 61,022 l 40.7MM…
Compelling Investment Opportunity 2x Revenue over last 3 years Proven Results 3x Adj. EBITDA(1) over last 3 years Strong operating cash flows Economically irreplaceable ingredient Unique Option to Strong long-term demand…
Questions
Appendix A
Reconciliation (Adjusted EBITDA to Net Income) The following table sets forth a reconciliation of net income, the most directly comparable GAAP financial measure, to Adjusted EBITDA. Three Months Ended September 30, 2013 2012 Net…
 Loading...