1 Global Hunter Securities Industrial Technology and Equipment Conference March 16, 2015 TM
3 Company Snapshot By the Numbers1 Industry Sectors Product Categories 2014 Sales Upstream Line Pipe & OCTG 5.933B Adjusted EBITDA 424M Employees 4,9002 Projects 28% Locations 400+ Midstream Valves Countries Operations 20…
4 Revenue by Industry Sector 28% Midstream Gas Utility Downstream 25% Other/ 10% Gas Industrial Chemical Utility 12% 9% 9% Chemicals Refining& Transmission Refining 9% 13% 18% Transmission 17% Other / Drilling &…
5 Revenue by Geography and Product Line By Geography By Product Line Eastern 22% Valves 32% Gulf Coast 19% Fittings & Flanges 21% Southwest 18% Line Pipe 19% Western 15% General Oilfield 18% Asia / Europe 15% Products…
7 Why Customers Choose MRC Global Well Positioned Benefits of MRC Global Supplier Registration / Preferred Supplier List Global delivery footprint with 1.5 million + sq. ft. of regional distribution centers Approximately 1.2B…
8 MRC Global is a leading provider of Integrated Supply Services to the Energy Industry Integrated Supply Statistics Supplying Integrated Supply services since 1988 Accounts for sales in excess of 825 million and growing…
9 Strategic Objectives Execute Global Preferred Supplier Contracts Organic Growth Focus on multi-year Top 25 MRO agreements and Targeted Growth Accounts: adding scope to current agreements develop the next 75 customers Recently…
10 Strategic Shift in Product Mix to Higher Margin Products Total Revenue less Carbon Energy Tubulars (OCTG & Line Pipe) ( millions) 4,238 3,697 3,705 2,989 2,384 2010 2011 2012 2013 2014 15% CAGR for Higher…
11 Product Mix Shift from 2008 to 2014 Stable, higher margin valves are a larger percentage of revenue More volatile carbon pipe is a smaller percentage of revenue The prices of higher margin products are more stable 2008…
12 Carbon Steel Prices in 2008/2009 as Compared to Today Inflation impacted both OCTG and LP in 2008resulting in a significant reduction in prices in 2009 Today, prices are lower and have less to fall in a downturn OCTG Prices…
13 Strategic Expansion into Offshore Production Platform MRO Top 4 largest offshore markets 140 billion E&P spend Norway is the largest we are now positioned in 4 of the 5 largest offshore markets MRC Global revenue mix Pre…
14 Building an International Platform International Segment Revenue 873 ( millions) 567 554 330 256 52 0 2008 2009 2010 2011 2012 2013 2014 2014 International Acquisitions Date Acquisition Rationale Region…
17 Balance Sheet Metrics ( millions) Total Debt Capital Structure 2014 1,527 Cash and Cash Equivalents 25 1,454 1,360 Total Debt (including current portion): 1,257 Term Loan B due 2019, net of discount 780 987 Global ABL…
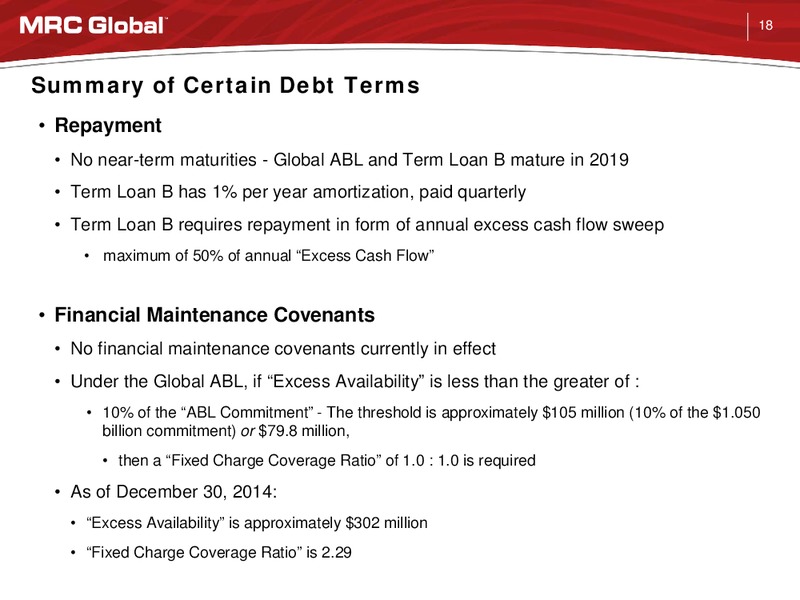
18 Summary of Certain Debt Terms Repayment No near-term maturities - Global ABL and Term Loan B mature in 2019 Term Loan B has 1% per year amortization, paid quarterly Term Loan B requires repayment in form of annual excess cash…
19 2015 Outlook Market indicators North American E&P capital expenditure budgets down 35% or more US rig count down 800-900 from peak in 2014 Commodities WTI Oil price 45-55/bbl (Brent 50-60) US Natural Gas prices…
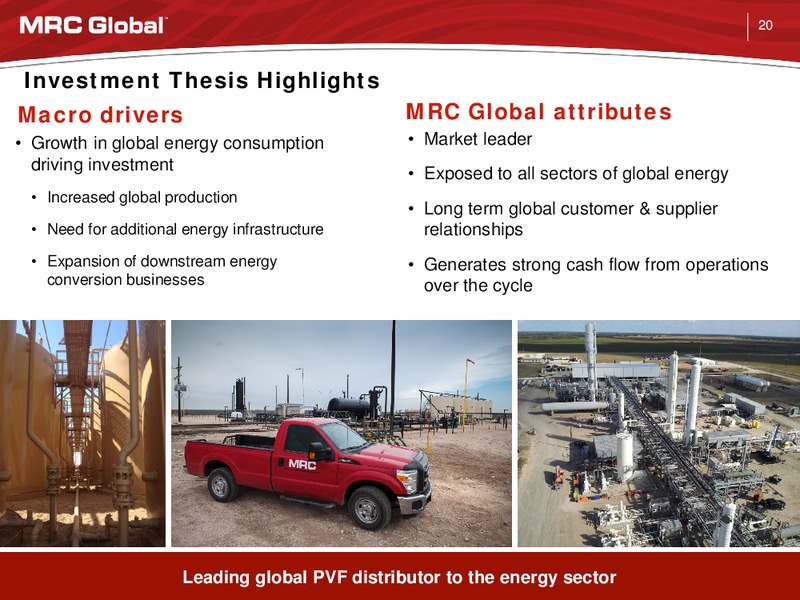
20 Investment Thesis Highlights Macro drivers MRC Global attributes Growth in global energy consumption Market leader driving investment Exposed to all sectors of global energy Increased global production Long term global…
21 Appendix
22 Global Footprint to Serve Customers - North America Nisku, AB By the Numbers As of 12/31/2014 Branches 170+ RDCs 10 VACs 14 Cheyenne, WY Munster, IN Employees 3,400 Odessa, TX Nitro, WV Bakersfield, CA Tulsa,…
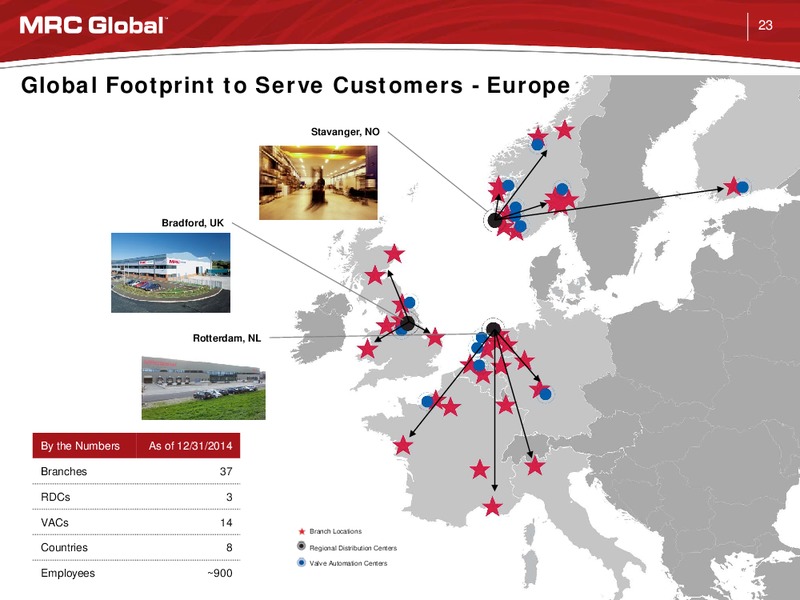
23 Global Footprint to Serve Customers - Europe Stavanger, NO Bradford, UK Rotterdam, NL By the Numbers As of 12/31/2014 Branches 37 RDCs 3 VACs 14 Branch Locations Countries 8 Regional Distribution Centers…
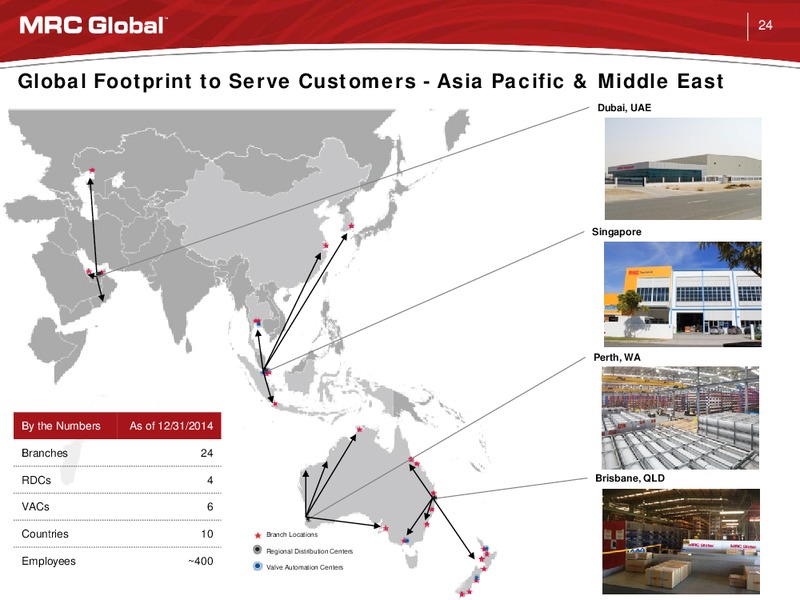
24 Global Footprint to Serve Customers - Asia Pacific & Middle East Dubai, UAE Singapore Perth, WA By the Numbers As of 12/31/2014 Branches 24 RDCs 4 Brisbane, QLD VACs 6 Countries 10 Branch Locations Regional…
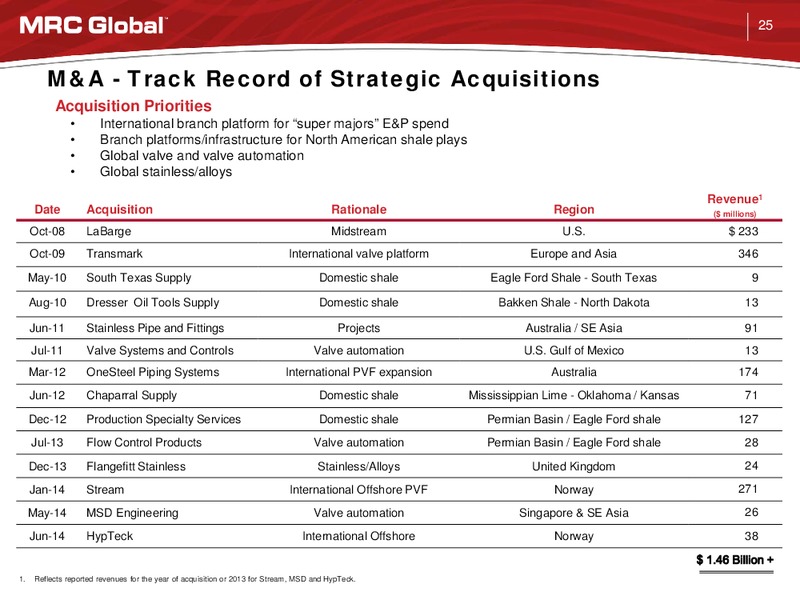
25 M&A - Track Record of Strategic Acquisitions Acquisition Priorities International branch platform for super majors E&P spend Branch platforms/infrastructure for North American shale plays Global valve and valve automation…
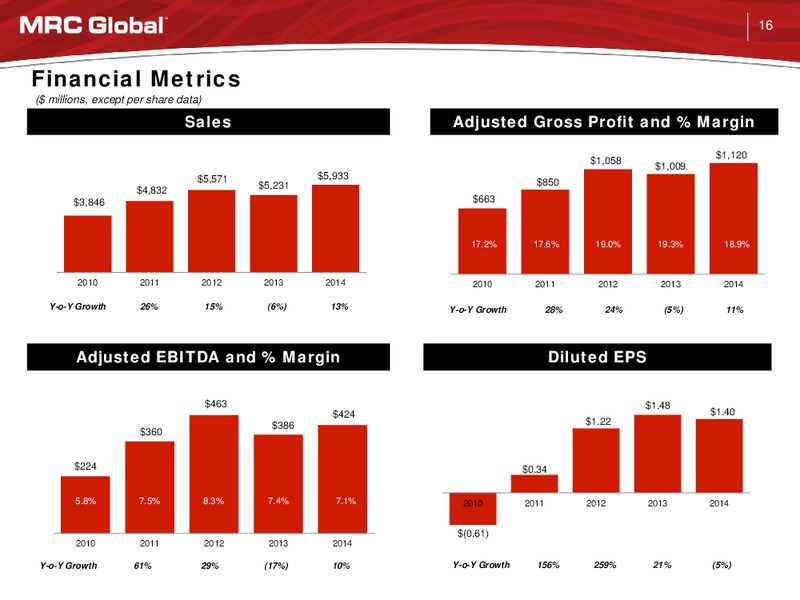
26 Adjusted EBITDA Reconciliation Year Ended December 31 ( millions) 2014 2013 2012 2011 2010 Net income 144.1 152.1 118.0 29.0 (51.8) Income tax expense 81.8 84.8 63.7 26.8 (23.4) Interest expense 61.8 60.7 112.5 136.8 139.6…
 Loading...