2015 Interim Results Presentation 16 February 2015 6 months ended 31 December 2014 Dennis Barnes, Chief Executive Officer 1 Graham Cockroft, Chief Financial Officer
Performance highlights 3
Advancing our safety culture Our number one priority is safety and we are advancing our safety culture to achieve zero harm On track to meet our target of reducing TRIFR by 20% each year Over 4,700 safety conversations recorded in…
Statutory profit down 54% to 51m Underlying earnings per share down 21% 6 months ended 31 December 2014 EBITDAF1 257m down 3% from 264m Profit 51m down 54% from 112m Earnings per share (cents) 6.9 cps down 55% from 15.3 cps…
Business performance Retail volumes remained stable; increased share of growing small business market offset residential customer losses National demand increased 2.9% with increased irrigation load and cooler temperatures…
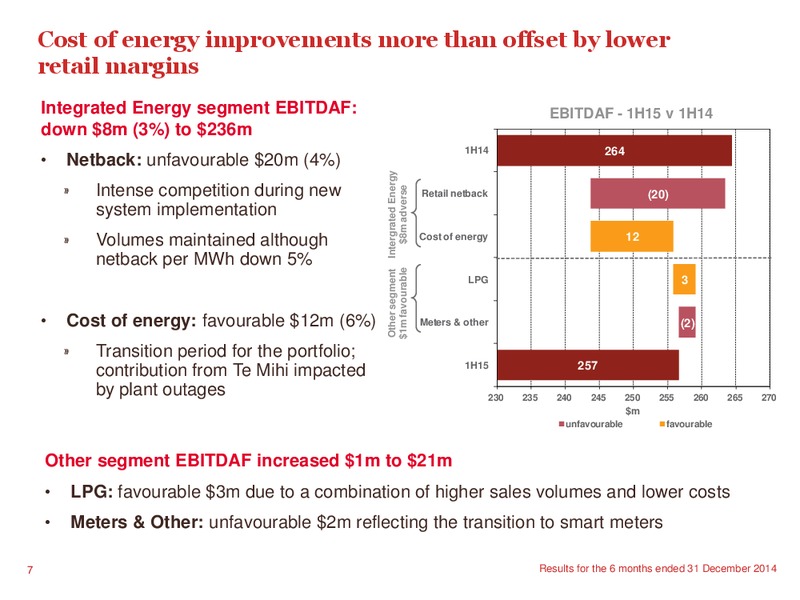
Cost of energy improvements more than offset by lower retail margins Integrated Energy segment EBITDAF: EBITDAF - 1H15 v 1H14 down 8m (3%) to 236m 1H14 264 Netback: unfavourable 20m (4%) Other segment Intergrated Energy…
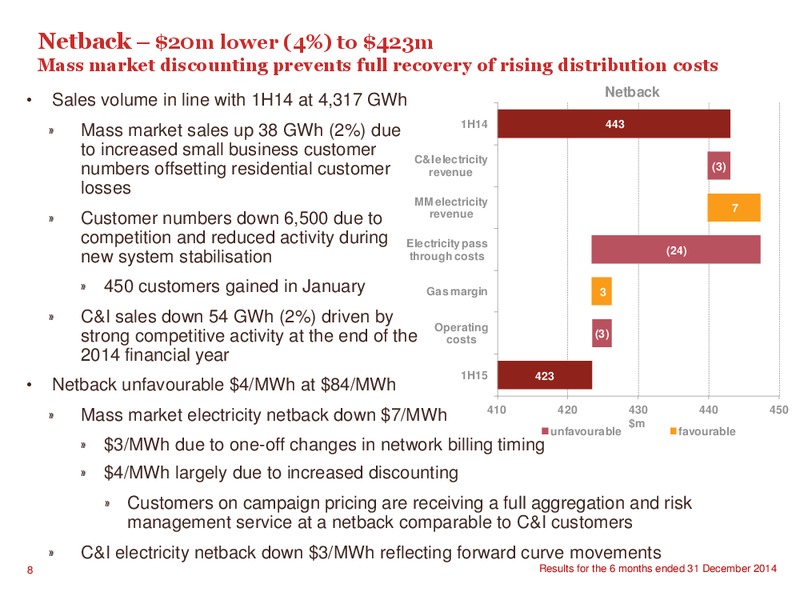
Netback 20m lower (4%) to 423m Mass market discounting prevents full recovery of rising distribution costs Netback Sales volume in line with 1H14 at 4,317 GWh 1H14 443 Mass market sales up 38 GWh (2%) due to increased small…
Retail Transformation Stabilisation continues; benefits realisation commences Since system go-live Average time to answer calls down 80% Average call handing times reduced 33% Contact proportion of EGCC complaints reduced from 70%…
Cost of energy favourable 12m (6%) to 187m Renewable generation increased from 68% to 76% Cost of energy Wholesale spot market up 1m Generation volume up 74 GWh with Te (199) 1H14 Mihi increasing geothermal generation by 392 GWh,…
Other segment favourable 1m (5%) to 21m Other segment LPG margin up 3m LPG sales up 2,288 tonnes (7%) with reticulated supply responding to 1H14 20 cooler weather Profit margin up 42/tonne (12%) LPG with continued margin pressure…
Financial Review Graham Cockroft 12
Statutory profit down 54% to 51m Underlying earnings per share down 21% 6 months ended 6 months ended Variance 31 December 2014 31 December 2013 m m m % Profit 51 112 (61) (54%) Earnings per share (cents) 6.9 15.3 (8.4) (55%)…
Statutory profit down 54% from 112m to 51m Underlying earnings after tax down 22% from 97m to 76m Contact's statutory profit movement 120 15 100 7 8 80 12 6 26 m 60 112 97 40 76 51 20 0 1H14 Net items 1H14…
Improved working capital is partially offset by higher stay in business capex and lower EBITDAF 6 months ended 6 months ended Variance 31 December 2014 31 December 2013 Free cash flow m m m % 200 EBITDAF 257 264 (7) (3%) 180 180…
Financing costs increased by 12m due to the reduction in capitalised interest following the completion of the Te Mihi and Retail Transformation projects 6 months ended 6 months ended Variance 31 December 2014 31 December 2013 m m m…
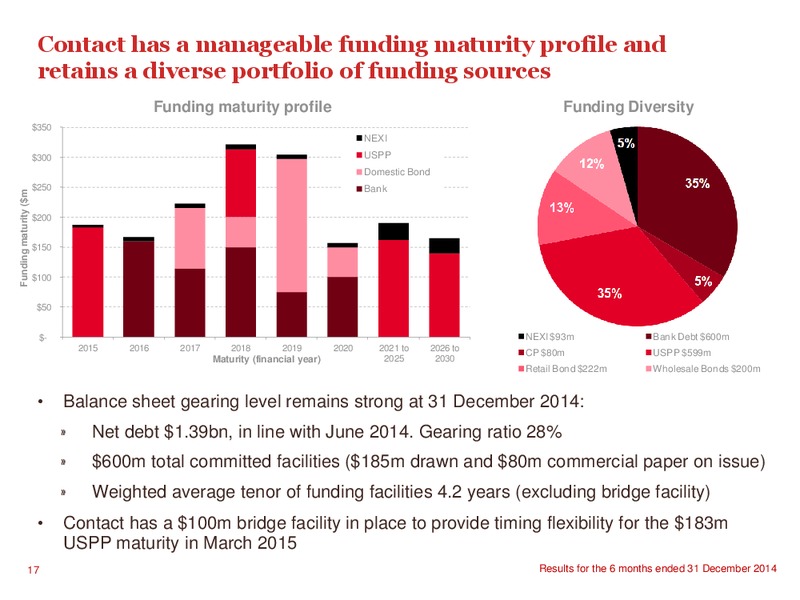
Contact has a manageable funding maturity profile and retains a diverse portfolio of funding sources Funding maturity profile Funding Diversity 350 NEXI 300 USPP Domestic Bond 250 Bank Funding maturity (m 200 150 100…
Fully imputed interim distribution Stable at 11 cps Free cash flow including the purchase or sale of fixed assets in 1H15 was 146m compared with 117m in 1H14 due to reduced growth capital expenditure, partially offset by the sale…
Prospects 19
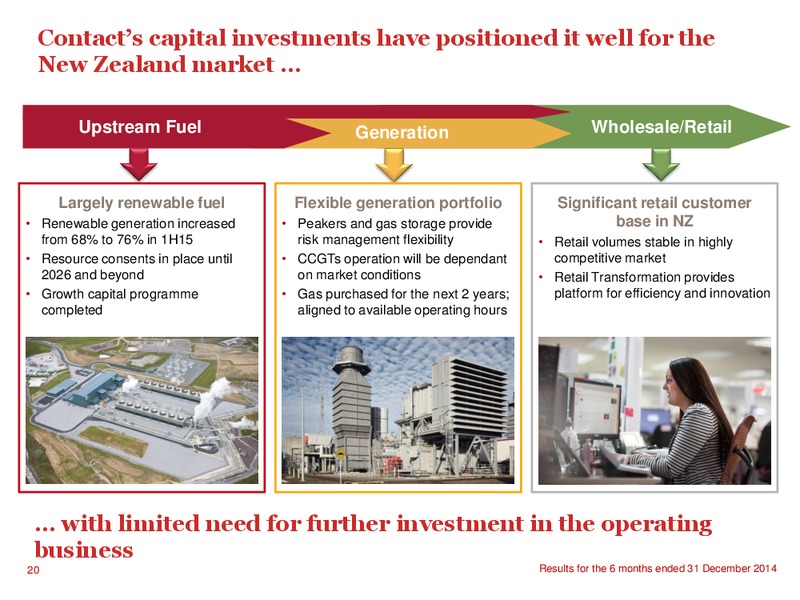
Contacts capital investments have positioned it well for the New Zealand market Upstream FuelFuel Generation Wholesale/Retail Retailer Generator Largely renewable fuel Flexible generation portfolio Significant retail customer…
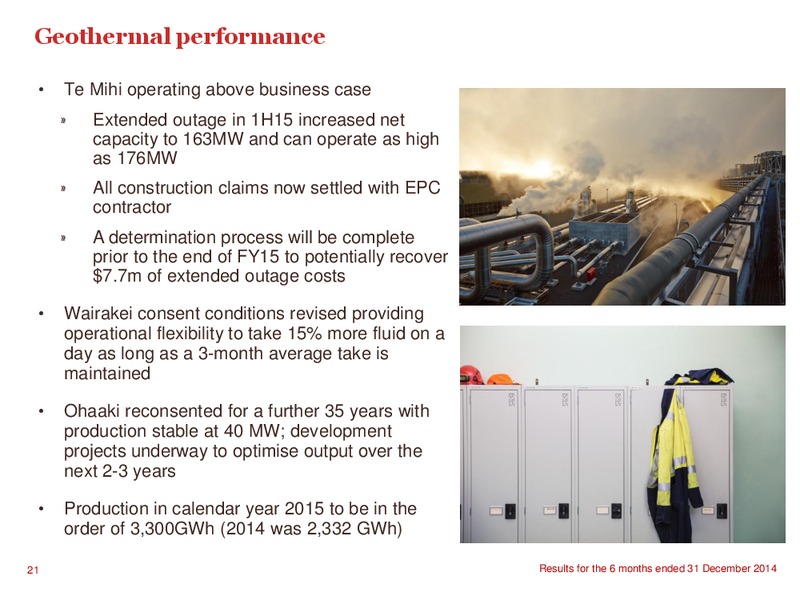
Geothermal performance Te Mihi operating above business case Extended outage in 1H15 increased net capacity to 163MW and can operate as high as 176MW All construction claims now settled with EPC contractor A determination process…
Thermal assets provide hydrology risk management and optionality Extension to gas supply agreement Contracted gas volumes 35 completed with Maui Developments OMV (take-or-pay) Peak take or pay Maui (max) Limited 30 was 52 PJ in…
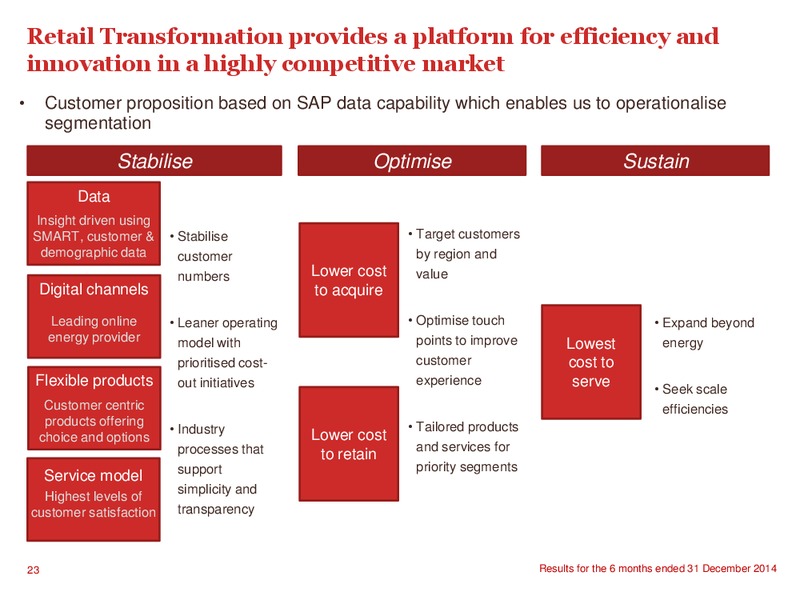
Retail Transformation provides a platform for efficiency and innovation in a highly competitive market Customer proposition based on SAP data capability which enables us to operationalise segmentation Stabilise Optimise Sustain…
Outlook 2H15 expected to improve Geothermal generation expected to increase to over 1,600 GWh with the possibility of a liquidated damages receipt for the extended Te Mihi outage in 1H15 Higher plant availability Lower contract gas…
The New Zealand electricity market is mature, limiting options for growth No material long-term growth expected Tiwai future is uncertain Continued improvement in energy efficiency is likely Technology advances may drive…
The investment in renewable generation has lowered Contacts cost of energy and requires limited ongoing capital expenditure Generation mix Capital expenditure 100% 600 500 Capital expenditure on the 80% CCGTs will be determined…
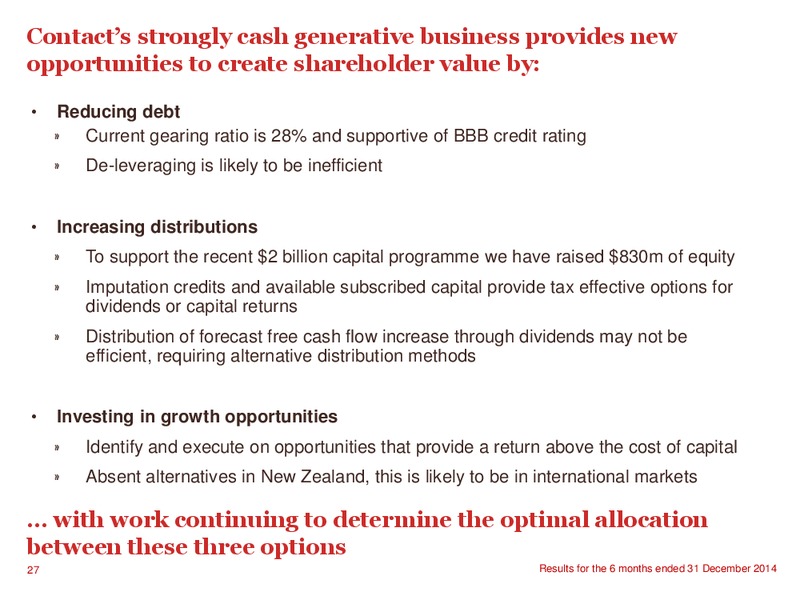
Contacts strongly cash generative business provides new opportunities to create shareholder value by: Reducing debt Current gearing ratio is 28% and supportive of BBB credit rating De-leveraging is likely to be inefficient…
A strong capability in geothermal and hydro development and operation provides opportunities for growth Geothermal is Contacts area of strongest capability A dedicated, internationally recognised subsurface team in Wairakei Operational…
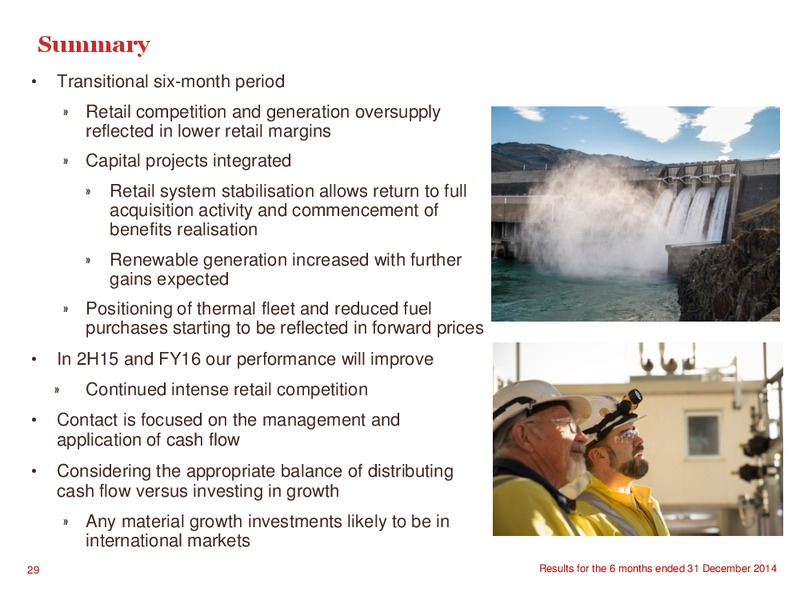
Summary Transitional six-month period Retail competition and generation oversupply reflected in lower retail margins Capital projects integrated Retail system stabilisation allows return to full acquisition activity and…
Supporting material 30
Non-GAAP profit measure - EBITDAF EBITDAF is Contacts earnings before net interest expense, tax, depreciation, amortisation, change in fair value of financial instruments and other significant items The CEO monitors EBITDAF as a key…
Explanation of reconciliation between EBITDAF and profit for the period The adjustments from EBITDAF to reported profit are as follows: Depreciation and amortisation: Costs increased by 8m (9%) reflecting commissioning of Te Mihi…
Non-GAAP profit measure underlying earnings The CEO monitors underlying earnings and believes it assists investors to understand the ongoing performance of the business Underlying earnings after tax is calculated by adjusting reported…
Explanation of reconciliation from reported profit to underlying earnings The adjustments from reported profit to underlying earnings are as follows: The change in fair value of financial instruments that do not qualify for hedge…
Operating cashflow after tax (OCAT) and OCAT ratio Contact uses OCAT and OCAT ratio as internal measures of the cash-generating performance of the business Key difference between OCAT and statutory cash flows from operating…
 Loading...