2014 full year Group results 12th February 2015 www.morganadvancedmaterials.com
Agenda 2014 full year Group results Strategy and operational update Summary and outlook 2
Key highlights Positive revenue and EBITA margin momentum in mixed market conditions One Morgan model has improved the business through organisational restructuring and footprint rationalisation Exits of low growth/margin and…
2014 full year Group results 4
Full year margin increased to 12.8%; 13.0% in H2 2014 FY14* FY13* % change from FY13 At constant As reported currency m m % % Revenue 921.7 957.8 -3.8% +1.8% EBITA before restructuring and one-off items** 118.0 119.0 -0.8% +6.2%…
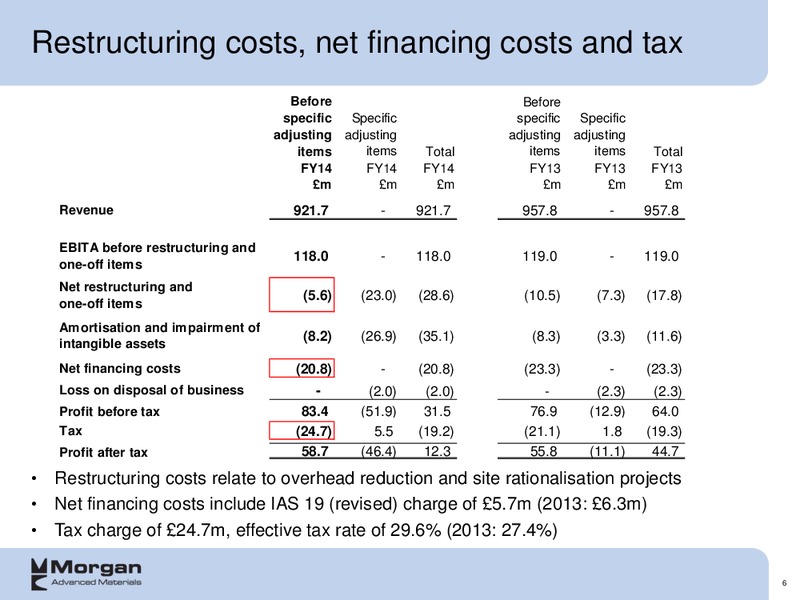
Restructuring costs, net financing costs and tax Before Before specific Specific specific Specific adjusting adjusting adjusting adjusting items items Total items items Total FY14 FY14 FY14 FY13 FY13 FY13 m m m m m m Revenue 921.7…
Specific adjusting items FY14 FY13 m m Restructuring costs (1) 16.3 0.0 Business exit costs (2) 1.9 7.3 Transaction related costs (3) 1.2 0.0 Settlement of prior period anti-trust litigation (4) 3.6 0.0 Impairment of intangible…
Strong operating cash flow, with significant investment FY14 FY13 Operating working m m capital/sales ratio Cash from trading* 146.1 148.3 of 22.3% (2013: Change in working capital (10.4) (4.4) 20.5%) Change in provisions (15.7)…
Significant margin improvement in Asia/RoW, progress in Europe and North America maintaining mid-teen margins million Revenue EBITA* Profit Margins % FY14 FY13 FY14 FY13 FY14 FY13 North America 353.1 359.9 52.5 55.5 14.9% 15.4%…
North America maintaining mid-teen margins Revenue* 400.0 359.9 353.1 350.0 300.0 1.9% year-on-year decrease in Revenue* m 250.0 revenue at reported rates, 3.6% 200.0 150.0 growth at constant currency 100.0 50.0 0.0 2013…
Europe margin improvement despite impact of C&DS Revenue* 8.8% decrease in revenue at 400.0 357.3 reported rates, 5.5% at constant 350.0 325.7 currency. C&DS impacted by 300.0 reduced MoD demand and its Revenue* m 250.0…
Asia/RoW strong revenue growth and margin progression Revenue* Revenue growth of 1.0% at 300.0 250.0 240.6 242.9 reported rates compared to 2013, 13.0% on a continuing basis and at Revenue* m 200.0 150.0 constant currency…
Material movement in exchange rates during 2014 impacting sterling reported numbers Constant currency FY 2013 FX impact of FY 2013 FY 2014 FX impact of FY 2014 at 2013 using 2014 at 2014 at 2014 using 2014 at 2014 average average…
Financial summary Revenue growth of 1.8% at constant currency, 3.8% higher H2 v H1 on an organic and constant currency basis 12.8% margins achieved in 2014, 13.0% in H2 Strong operating cash flow and net debt at 1.4 times net…
Strategy and operational update 15
Strategy reminder of key themes Building sustainable competitive advantage in attractive markets with truly, differentiated products underpinned by world- leading technology Our goal is for all of our businesses and technologies…
Portfolio reshaping where we were Electrical Carbon Seals and Bearings IFB/castables C&DS advanced composites 60% 35% Fibre Technical Ceramics 5% Piezo ceramics Brazed alloys and assemblies C&DS logistics support Ceramic…
Solutions achieved for all low margin businesses Indian carbon business reduced to minority stake UK MoD vehicles logistics/spares contract exited UK fired shapes business JV arrangement Chinese lithium ion materials business…
Current status exited/sold low margin businesses, good progress with margin improvement of Electrical Carbon Seals and Bearings IFB/castables C&DS advanced composites c.80% EBITA % c.20% Fibre Technical Ceramics 5% Piezo…
Continued improvement made in Seals and Bearings Revenue growth of c.8% at constant currency primarily driven by water and Seals & Bearings EBITA* margin petrochem markets 12.0% 10.0% 8.0% EBITA margin improvement EBITA*…
Top-line growth in IFB/castables, driven by increased project work Revenue growth due to IFB/castables EBITA* margin increased project business 10.0% volumes primarily in Asia 8.0% and North America, but at lower margins EBITA*…
C&DS business profile changing away from traditional UK MoD contracts Revenue in 2014 down to 31.5m due to continued reduction in MoD demand C&DS EBITA* margin 10.0% Significant reduction in UK MoD demand, leading to review and…
Significant progress in Electrical Carbon, further improvement to come from rationalisation project Year-on-year improvement of 300bps in EBITA margin driven by: Electrical Carbon EBITA* margin volume benefit revenue up 16.0%…
Technical Ceramics remains a mid-teen margin business despite impact of ceramic cores Revenue down c.5% at constant currency, primarily in North America due to lower volumes of ceramic cores Technical Ceramics EBITA* margin 20.0%…
Fibre good growth and high-teen margins Organic revenue growth of c.9% at constant currency Fibre EBITA* margin 20.0% Opportunity for further margin improvement continued 16.0% EBITA* % 12.0% positive mix shift from 17.7%…
R&D investment increased to 2.3% of revenue Increasing investment in R&D 2.3% of revenue (2013: 2.1%, 2012: 1.9%) Global Materials Centre of Excellence for Structural Ceramics (Stourport, UK) operational in H1 2015 Additional Global…
Capital investment for long-term profitable growth Capex c.1.2x depreciation in 2014 Key projects: High-temperature ceramics manufacturing site in Dalian, China Superwool greenfield site in Abu Dhabi Expansion of South Korean…
Summary and outlook 28
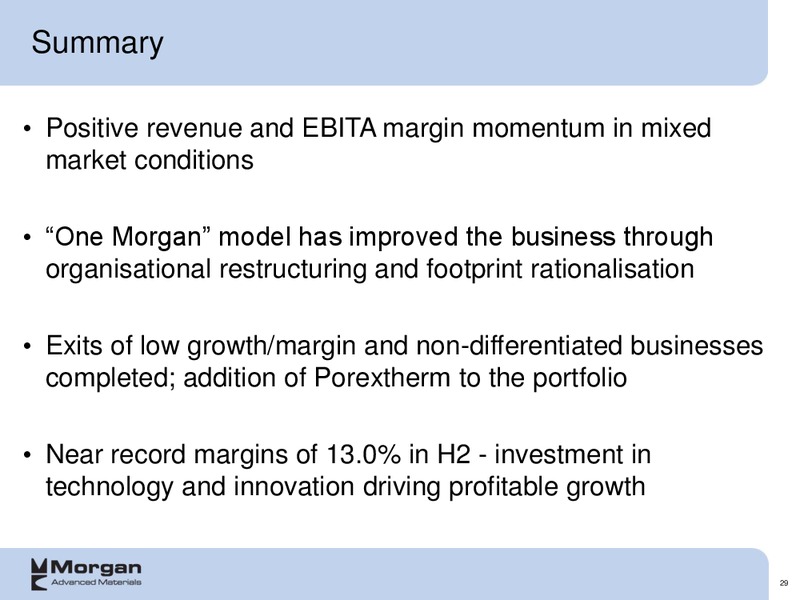
Summary Positive revenue and EBITA margin momentum in mixed market conditions One Morgan model has improved the business through organisational restructuring and footprint rationalisation Exits of low growth/margin and…
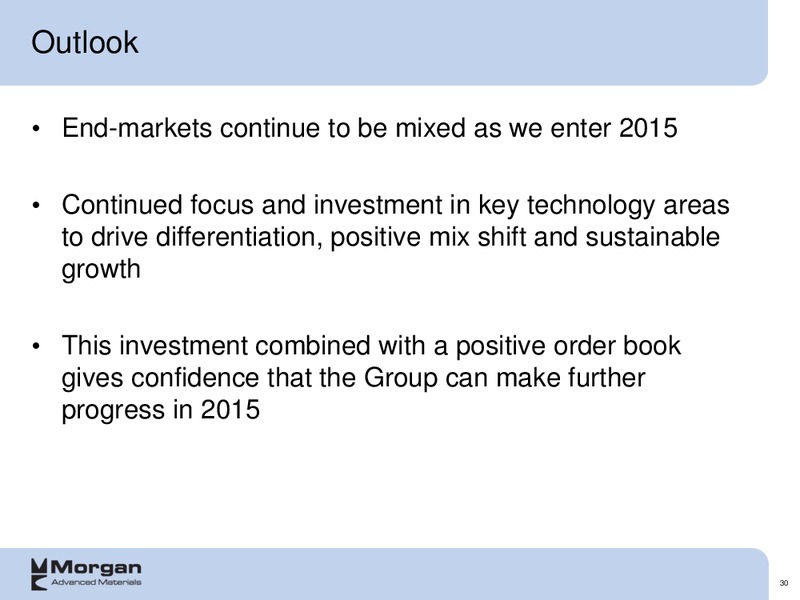
Outlook End-markets continue to be mixed as we enter 2015 Continued focus and investment in key technology areas to drive differentiation, positive mix shift and sustainable growth This investment combined with a positive order…
2014 full year Group Results 12th February 2015 www.morganadvancedmaterials.com
Appendix 32
Revenue and EBITA as historically presented margin progression driven by AM&T business million Revenue EBITA* Profit Margins % FY14 FY13 FY14 FY13 FY14 FY13 Technical Ceramics 237.0 258.6 33.7 40.2 14.2% 15.5% Thermal Ceramics…
EBITA margins before restructuring and one-off items EBITA before restructuring and one-off items* % 14.0% 13.0% 13.0% 12.8% 12.7% 12.4% 12.0% 12.0% 11.1% 10.8% 10.0% 9.4% 8.8% 8.0% 6.7% 6.0% 5.3% 4.0% 2.0% 0.0%…
End-market mix across regions 2014 revenue by market Revenue by market 2014 100% 90% 80% 70% Healthcare 60% Security & Def ence Electronics 50% Energy 40% Transportation Petrochemical 30% Industrial 20% 10% 0% Group…
Operating ROCE All million 2014 2013 At reported rates Year End Year End LTM Underlying EBITA 112.4 108.5 Change -v- 2013 Year End 3.6% Operating Capital Land & Building - NBV 93.1 97.9 Plant & Equipment - NBV 147.9 143.5 Third Party…
Net financing costs FY14 FY13 m m Bank interest charge 17.2 18.3 Bank interest income (1.4) (1.3) Amounts derived from financial instruments (0.7) 0.0 Net interest on IAS19 obligations 5.7 6.3 20.8 23.3 38
Underlying EPS FY14 FY13 m m Basic earnings from continuing operations 7.8 41.8 Amortisation 8.2 8.3 Specific adjusting items 47.0 10.6 Underlying earnings 63.0 60.7 Weighted average number of shares in the period 285.1m 282.9m…
2014 full year Group results 12th February 2015 www.morganadvancedmaterials.com
 Loading...