Calpine: National Portfolio of Nearly 27,000 MW Geographic Diversity Dispatch Flexibility As of 11/7/2014 Geographically diversified portfolio: Scale in three most competitive power markets in America Largest operator…
Nations Largest Baseload Renewable, Natural Gas and Cogeneration Power Provider Modern Clean 50 5 Capacity Wtd Avg Age (Years) 40 4 30 SO2 lbs/MWh 3 20 2 10 1 0 0 CPN DYN NRG CPN DYN NRG Efficient 12,000 2,500…
Calpines Strategic Advantages in the Current Environment Well Positioned to Respond to Resilient in Increasing Market Volatility Low-Gas Price Setting Market Rules California High ramps Changes to capacity rules Possible return to…
REGIONAL OBSERVATIONS 6
Consistent Focus on Core Competitive Markets West Strategic Priority: Asset management and regulatory engagement given CA renewable integration challenges Near-Term Opportunities: Recontracting existing plants (gas and geothermal)…
Market Overview: East PJM New England Strong market signals given pending retirements and New build siting/ Small market increasing volatility permitting challenges Sustained Marcellus basis advantage 175 Well-designed capacity…
Market Overview: Texas & California Texas California Load Growth Persists, Despite Mild Summer Right Fleet for California 60,000 Baseload, intermediate and peaking capacity 58,000 Quick ramping capabilities Average On-Peak Load…
Stable California Platform Despite Solar Penetration Value of Solar Declines As Net Peak Load Shifts Todays Largest complex of geothermal 140 penetration level power plants in the world Geysers: 120 Premium, reliable…
Capital Allocation and Portfolio Repositioning ( millions, unless otherwise indicated) 20141: Aggressively Deploying Capital Portfolio Transformation 3.1B 3.1B Today1: 2Q08: North 2,822 MW Financings2 725 949 YTD Share 12% East…
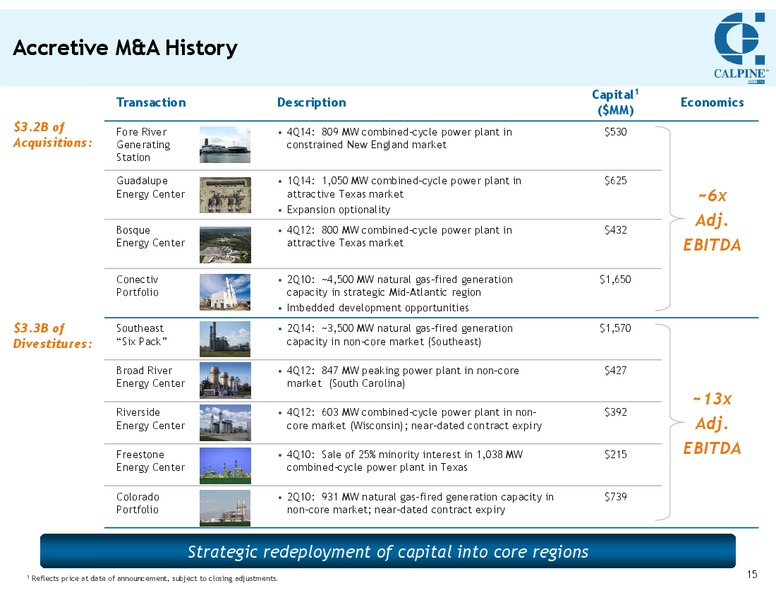
Accretive M&A History Capital1 Transaction Description Economics (MM) 3.2B of Fore River 4Q14: 809 MW combined-cycle power plant in 530 Acquisitions: Generating constrained New England market Station Guadalupe 1Q14: 1,050 MW…
Regional Adjusted EBITDA1: YTD 2014 vs. 2013 ( millions, 000 MWh) West Region Adjusted EBITDA1 Generation2 25,751 25,235 486 516 East Region YTD13 YTD14 YTD13 YTD14 Adjusted EBITDA1 Generation2 633 Higher Commodity Margin1…
Pro Forma Energy Margin1: Positioned to Respond to Favorable Secular Trends Energy Hedge Profile2 Sensitivities Continued Commercial Progress: Natural Gas Price Sensitivity2 New Contracts Energy Margin1,2 as % of (assuming no change…
Although Calpines fleet can be difficult to model, simplifying techniques may help 1. Estimate annual generation (MWh) based on market outlook relative to disclosed 5. Adjust margin to capture items such as ancillary services and storage…
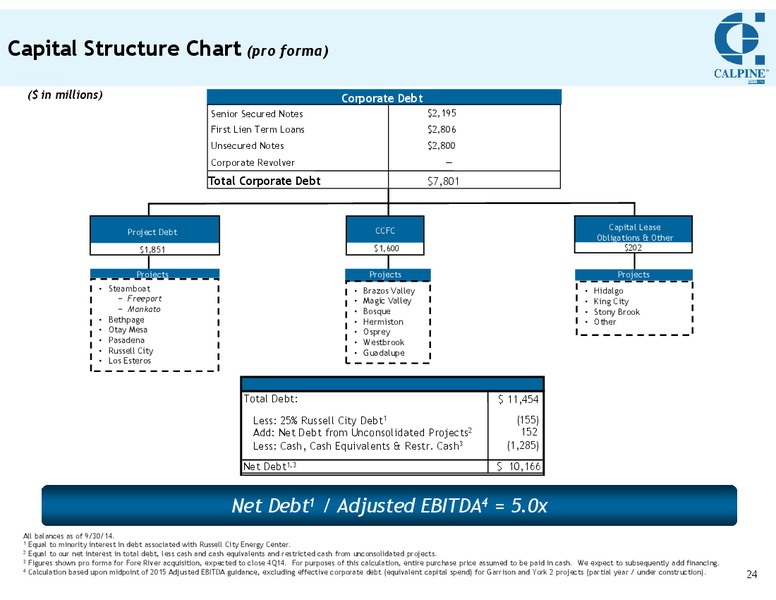
Capital Structure Chart (pro forma) ( in millions) Corporate Debt Senior Secured Notes 2,195 First Lien Term Loans 2,806 Unsecured Notes 2,800 Corporate Revolver Total Corporate Debt 7,801 CCFC Capital Lease Project Debt…
Calpine1 Continues to Benefit from Federal NOL Positions Federal NOLs at Dec. 31, 2013: 7.5 billion All are unrestricted 1 Includes CCFC. 25
Calpine Operating Power Plants As of November 7, 2014 With With Load CPN Peaking Technology Location COD Peaking Type Interest Capacity, Capacity Net West Region Agnews Power Plant Natural Gas Intermediate CA 1990 28 100% 28…
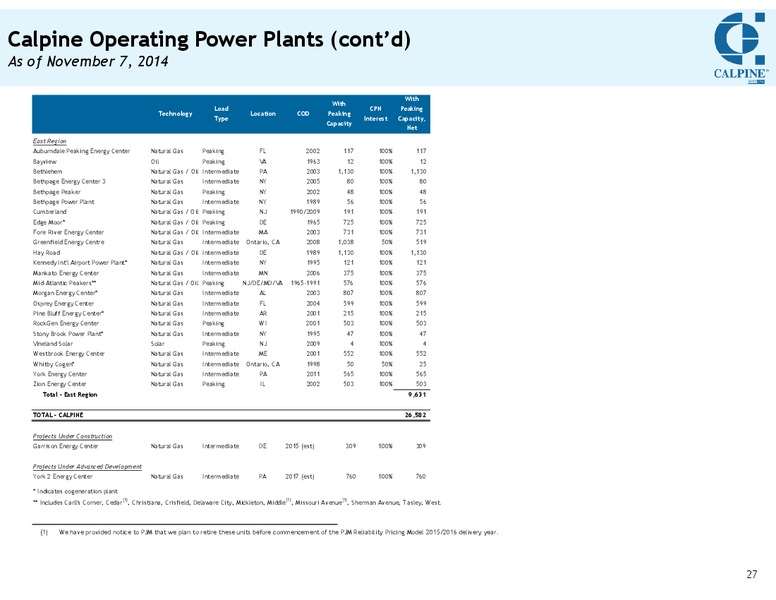
Calpine Operating Power Plants (contd) As of November 7, 2014 With With Load CPN Peaking Technology Location COD Peaking Type Interest Capacity, Capacity Net East Region Auburndale Peaking Energy Center Natural Gas Peaking FL…
Reg G Reconciliation: Commodity Margin ( in millions) Commodity Margin includes our power and steam revenues, sales of purchased power and physical natural gas, capacity revenue, revenue from renewable energy credits, sales of surplus…
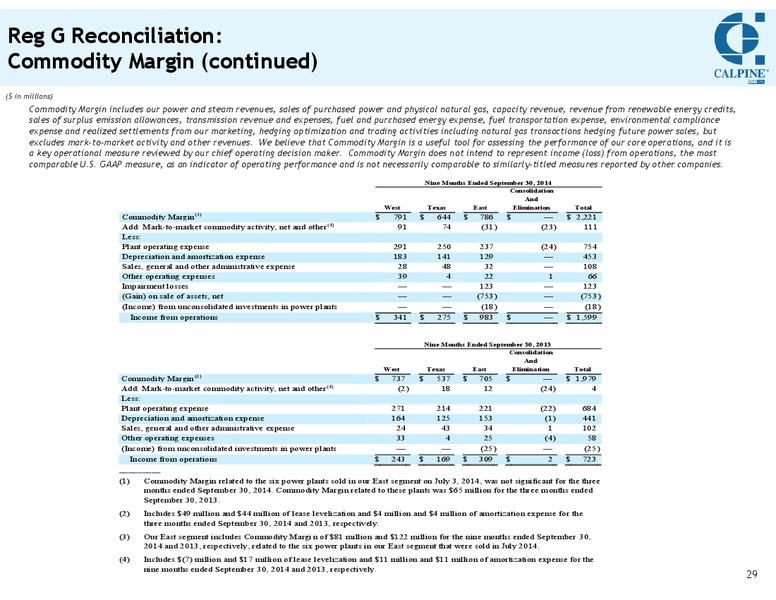
Reg G Reconciliation: Commodity Margin (continued) ( in millions) Commodity Margin includes our power and steam revenues, sales of purchased power and physical natural gas, capacity revenue, revenue from renewable energy credits, sales…
Reg G Reconciliation: Adjusted EBITDA and Adjusted Free Cash Flow ( in millions, except share and per share amounts) Three Months Ended September 30, Nine Months Ended September 30, (1) (1) 2014 2013 2014(2) 2013(2) Adjusted EBITDA…
Reg G Reconciliation: 2014 Adjusted EBITDA and Adjusted Free Cash Flow Guidance Note: Guidance as of 11/6/14. 31
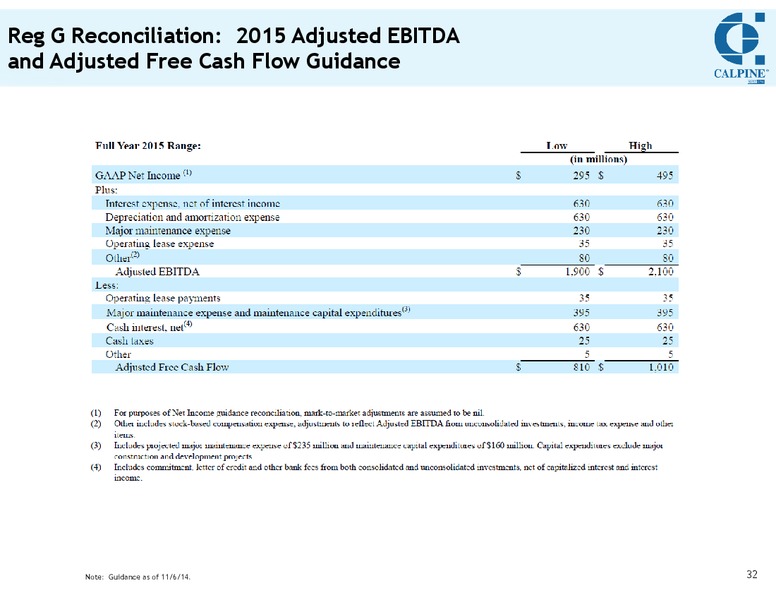
Reg G Reconciliation: 2015 Adjusted EBITDA and Adjusted Free Cash Flow Guidance Note: Guidance as of 11/6/14. 32
Major Maintenance and Capital Expenditure Guidance ( in millions) 2014E 2015E Major maintenance expense 240 235 A Maintenance capital expenditures 165 160 B Growth-related capital expenditures1 305 355 C Capital expenditures,…
 Loading...