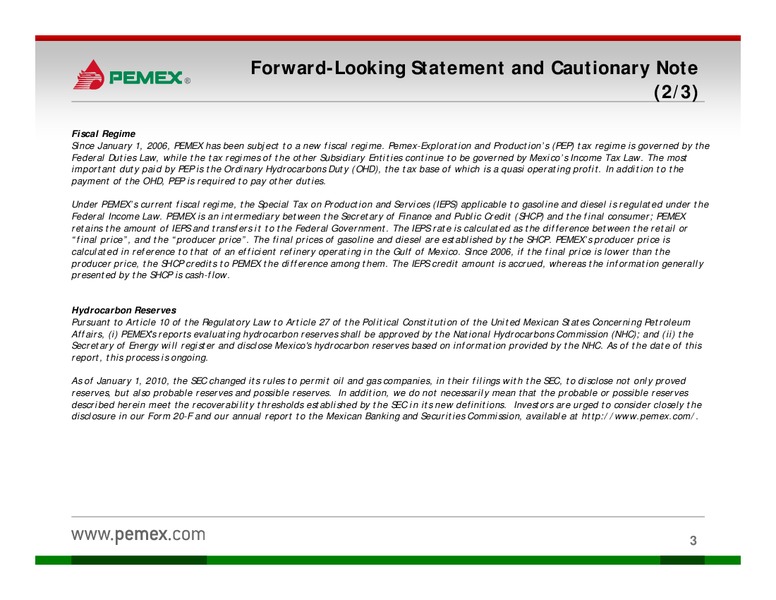
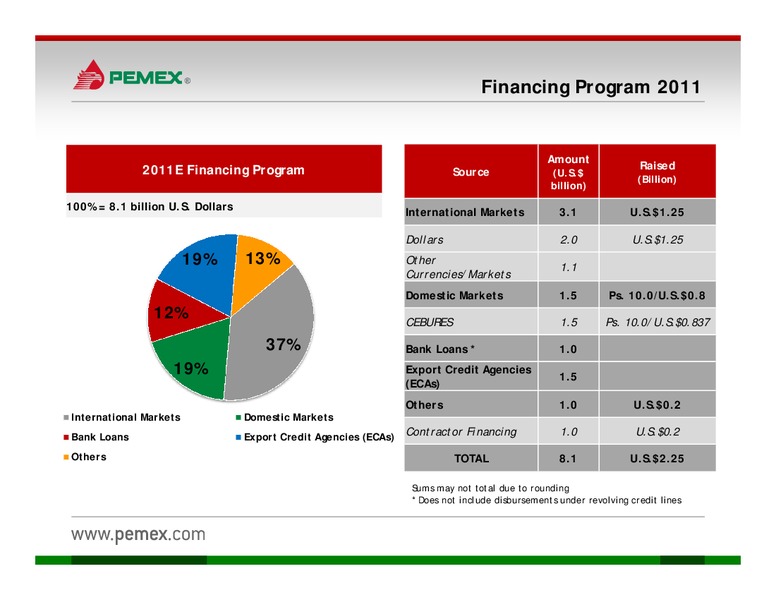
Forward-Looking Statement and Cautionary Note (2/3) Fiscal Regime Since January 1, 2006, PEMEX has been subject to a new fiscal regime. Pemex-Exploration and Productions (PEP) tax regime is governed by the Federal Duties Law, while the…
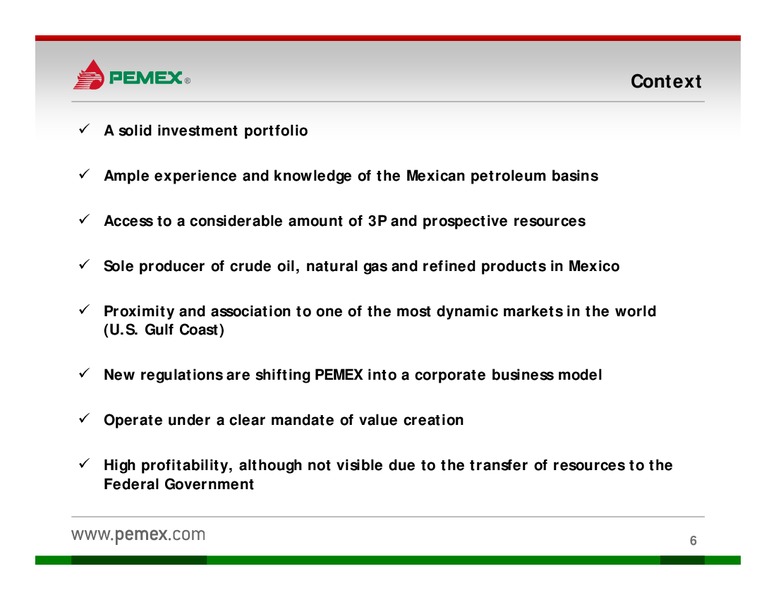
Context A solid investment portfolio Ample experience and knowledge of the Mexican petroleum basins Access to a considerable amount of 3P and prospective resources Sole producer of crude oil, natural gas and refined products in…
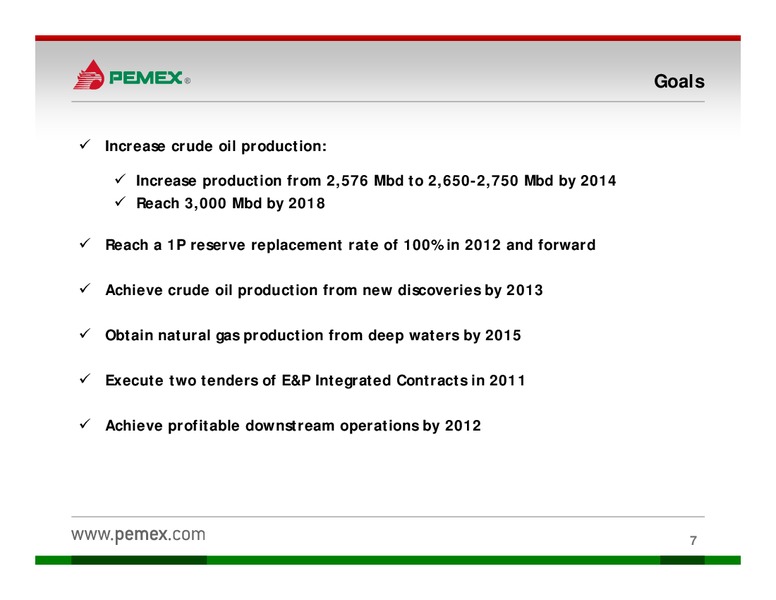
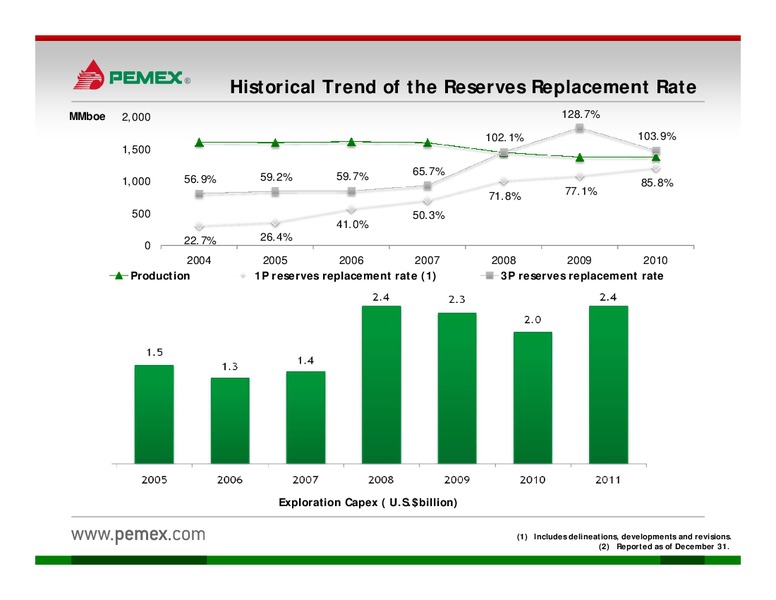
Goals Increase crude oil production: Increase production from 2,576 Mbd to 2,650-2,750 Mbd by 2014 Reach 3,000 Mbd by 2018 Reach a 1P reserve replacement rate of 100% in 2012 and forward Achieve crude oil production from new…
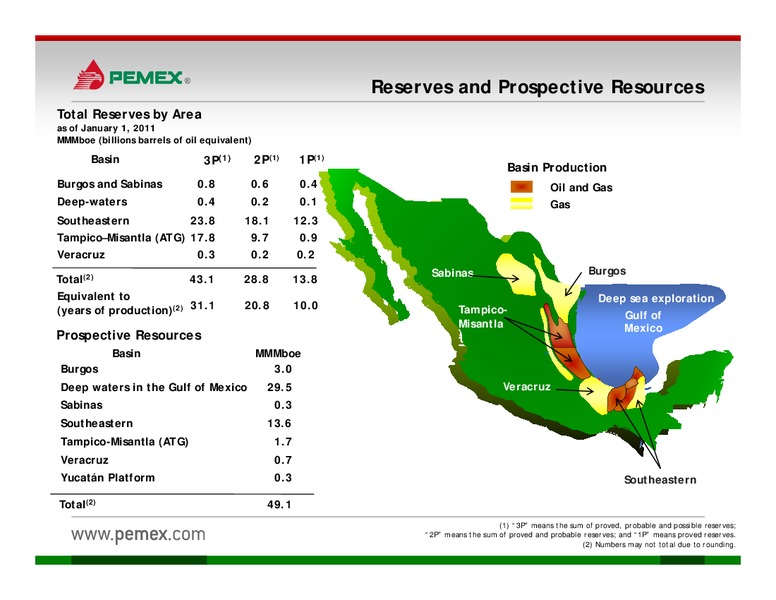
Reserves and Prospective Resources Total Reserves by Area as of January 1, 2011 MMMboe (billions barrels of oil equivalent) Basin 3P(1) 2P(1) 1P(1) Basin Production Burgos and Sabinas 0.8 0.6 0.4 Oil and Gas Deep-waters 0.4 0.2 0.1 Gas…
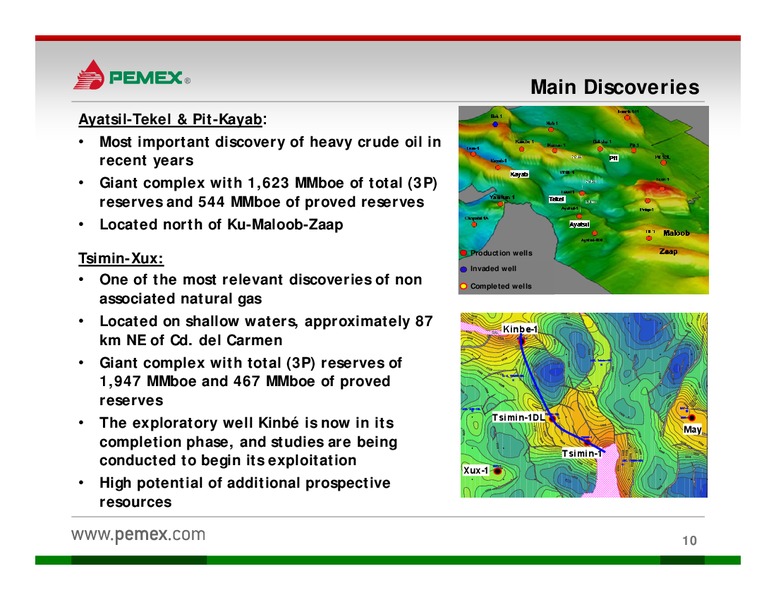
Main Discoveries Ayatsil-Tekel & Pit-Kayab: Most important discovery of heavy crude oil in recent years Giant complex with 1,623 MMboe of total (3P) reserves and 544 MMboe of proved reserves Located north of Ku-Maloob-Zaap…
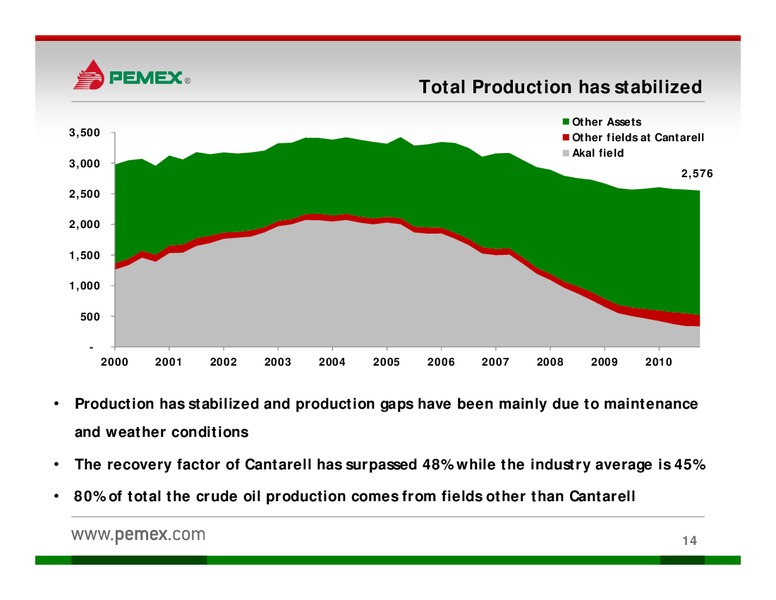
Total Production has stabilized Other Assets 3,500 Other fields at Cantarell Akal field 3,000 2,576 2,500 2,000 1,500 1,000 500 - 2000 2001 2002 2003 2004 2005 2006 2007 2008 2009 2010 Production has stabilized and…
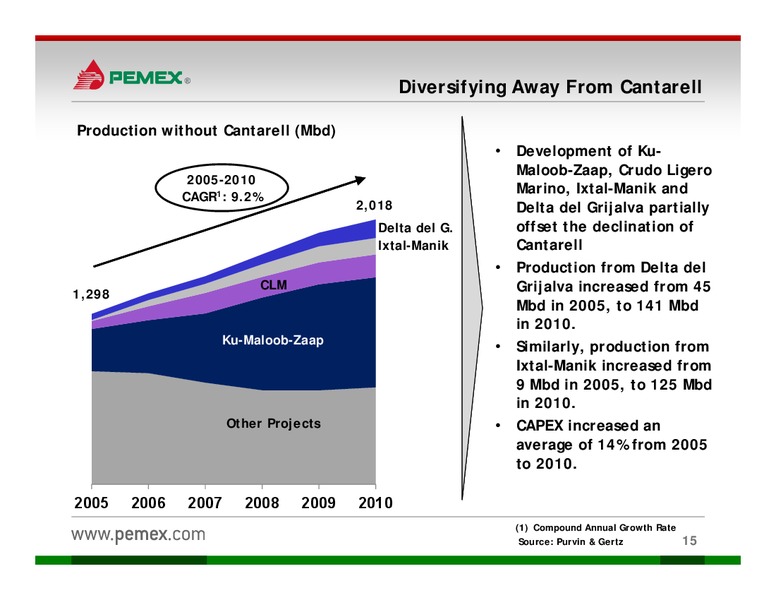
Diversifying Away From Cantarell Production without Cantarell (Mbd) Development of Ku- Maloob-Zaap, Crudo Ligero 2005-2010 CAGR1: 9.2% Marino, Ixtal-Manik and 2,018 Delta del Grijalva partially Delta del G. offset the declination…
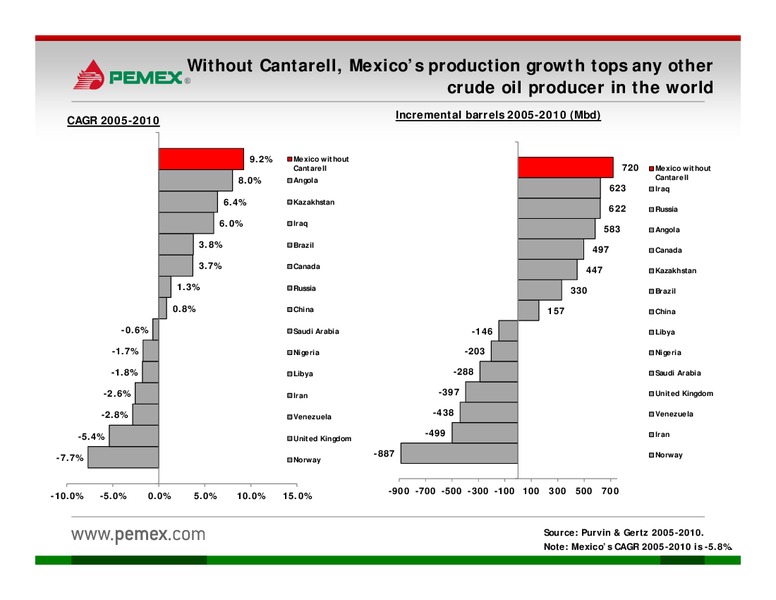
Without Cantarell, Mexicos production growth tops any other crude oil producer in the world CAGR 2005-2010 Incremental barrels 2005-2010 (Mbd) 9.2% Mexico without Cantarell 720 Mexico without 8.0% Angola Cantarell 623 Iraq 6.4%…
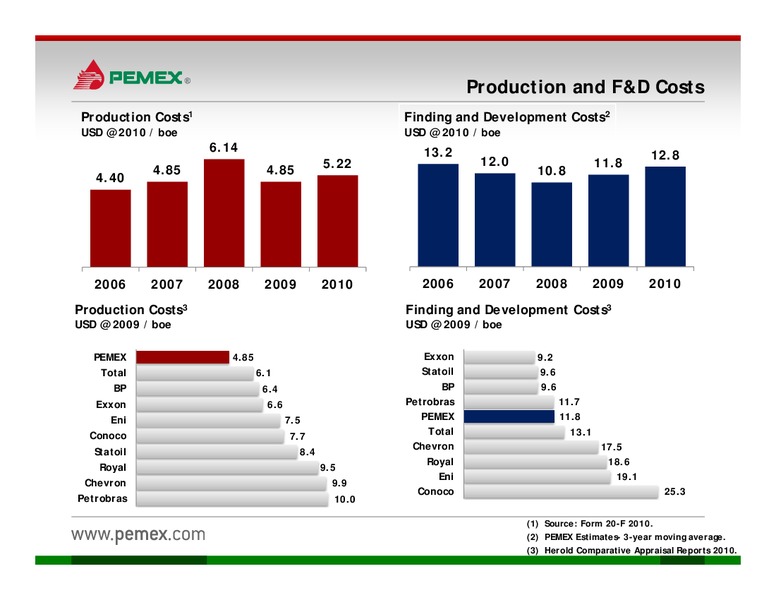
Production and F&D Costs Production Costs1 Finding and Development Costs2 USD 2010 / boe USD 2010 / boe 6.14 13.2 12.0 12.8 5.22 11.8 4.85 4.85 10.8 4.40 2006 2007 2008 2009 2010 2006 2007 2008 2009 2010 Production Costs3…
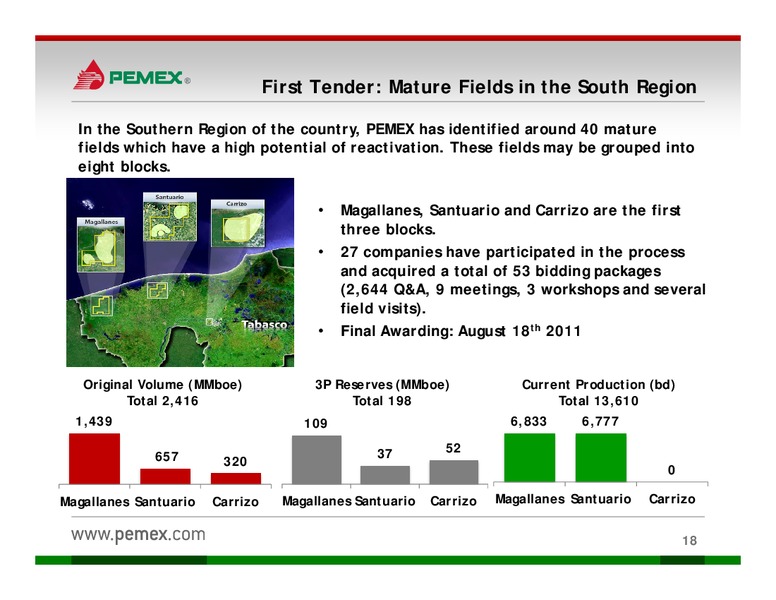
First Tender: Mature Fields in the South Region In the Southern Region of the country, PEMEX has identified around 40 mature fields which have a high potential of reactivation. These fields may be grouped into eight blocks.…
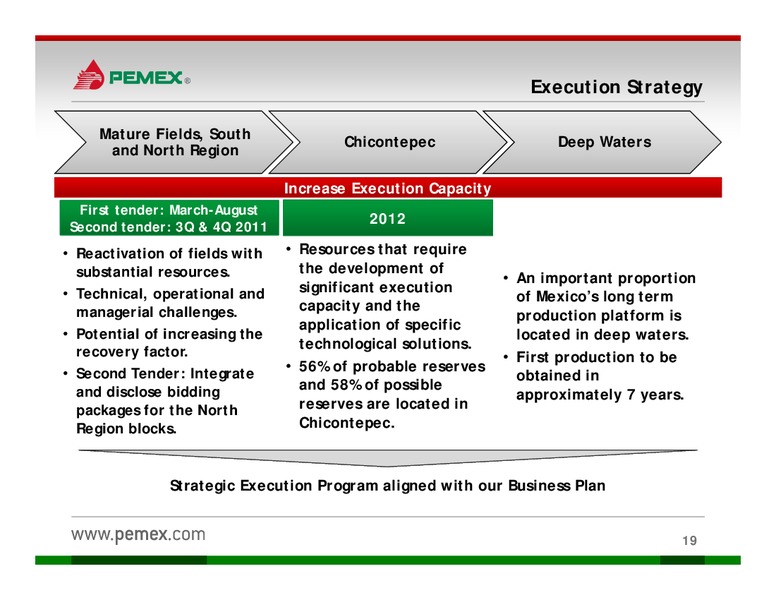
Execution Strategy Mature Fields, South Chicontepec Deep Waters and North Region Increase Execution Capacity First tender: March-August 2012 Second tender: 3Q & 4Q 2011 Reactivation of fields with Resources that require…
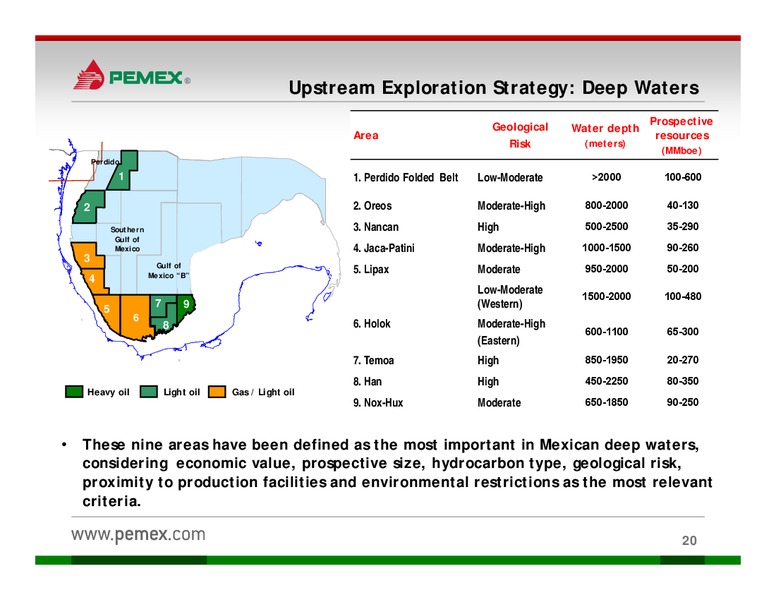
Upstream Exploration Strategy: Deep Waters Prospective Geological Water depth Area resources Risk (meters) (MMboe) Perdido 1 1. Perdido Folded Belt Low-Moderate 2000 100-600 2 2. Oreos Moderate-High 800-2000 40-130 Southern…
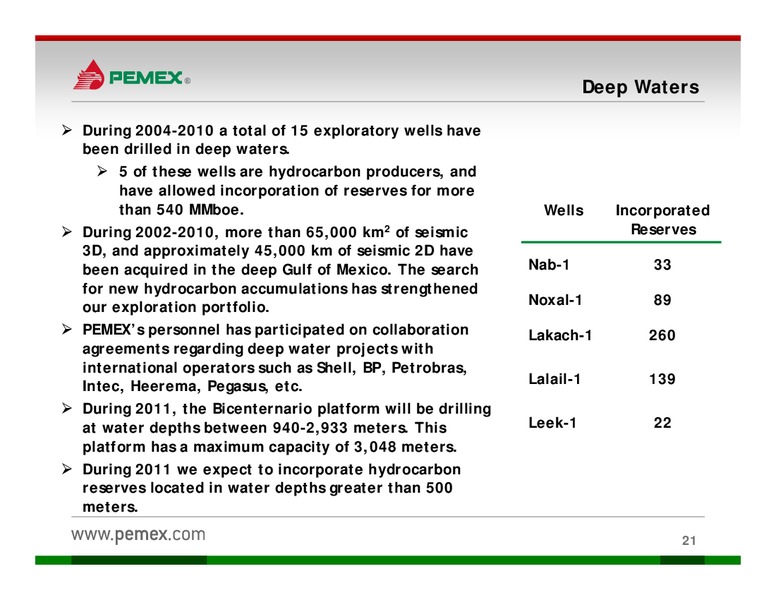
Deep Waters During 2004-2010 a total of 15 exploratory wells have been drilled in deep waters. 5 of these wells are hydrocarbon producers, and have allowed incorporation of reserves for more than 540 MMboe. Wells Incorporated…
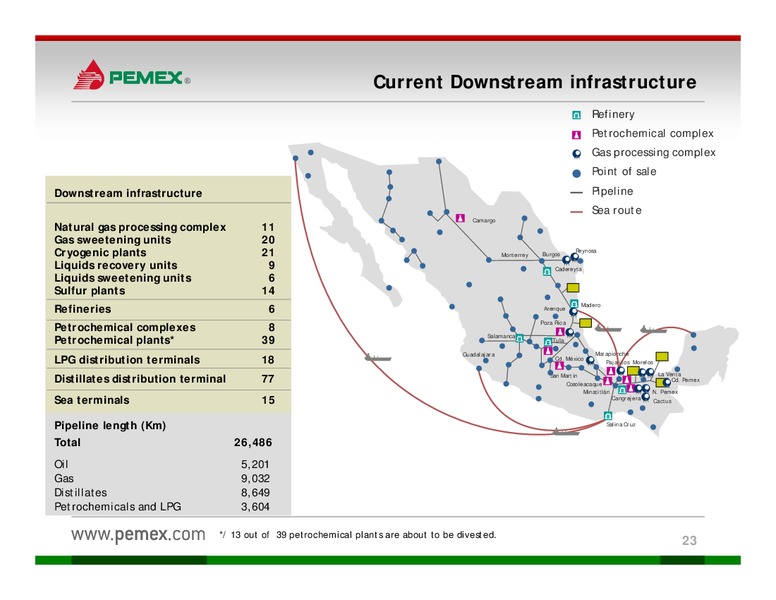
Current Downstream infrastructure Refinery Petrochemical complex Gas processing complex Point of sale Downstream infrastructure Pipeline Sea route Camargo Natural gas processing complex 11 Gas sweetening units 20 Cryogenic plants…
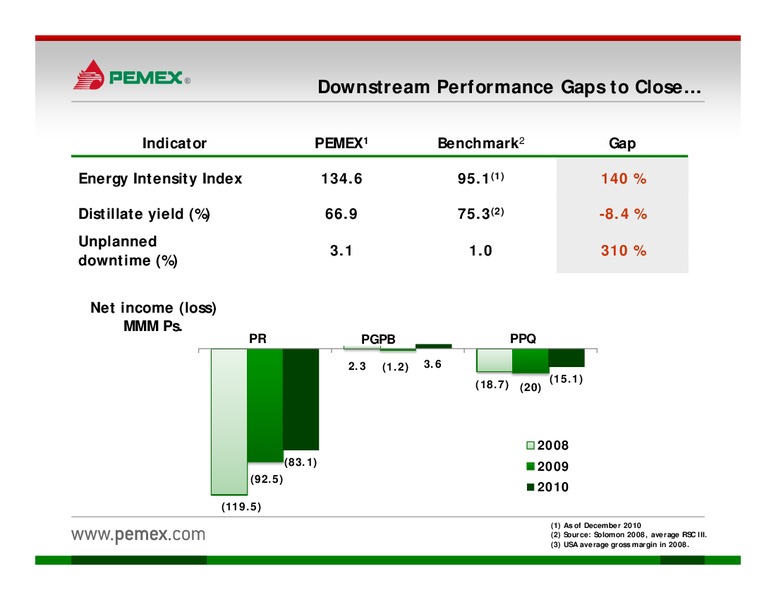
Downstream Performance Gaps to Close Indicator PEMEX1 Benchmark2 Gap Energy Intensity Index 134.6 95.1(1) 140 % Distillate yield (%) 66.9 75.3(2) -8.4 % Unplanned 3.1 1.0 310 % downtime (%) Net income (loss) MMM Ps. PR PGPB…
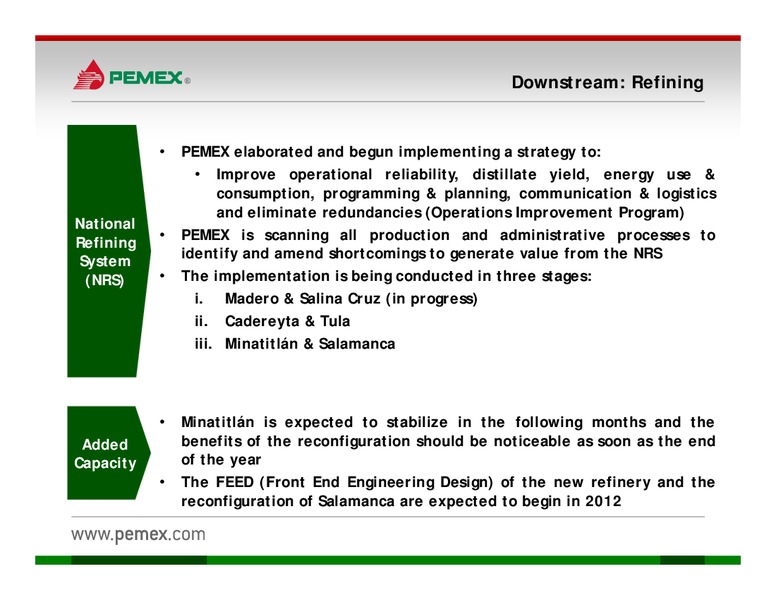
Downstream: Refining PEMEX elaborated and begun implementing a strategy to: Improve operational reliability, distillate yield, energy use & consumption, programming & planning, communication & logistics and eliminate redundancies…
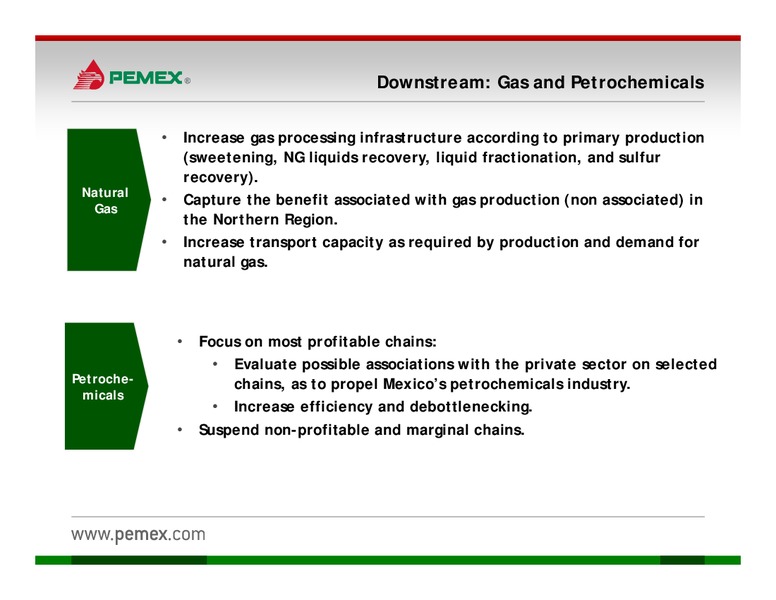
Downstream: Gas and Petrochemicals Increase gas processing infrastructure according to primary production (sweetening, NG liquids recovery, liquid fractionation, and sulfur recovery). Natural Capture the benefit associated with gas…
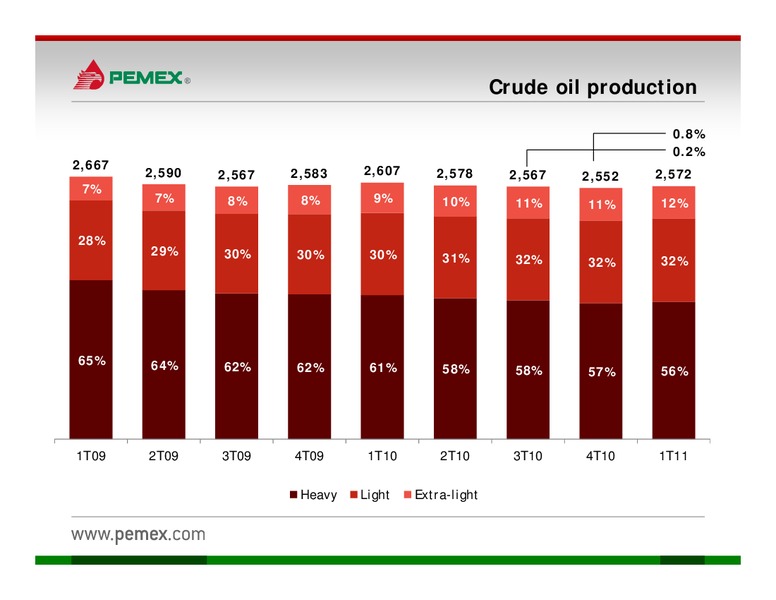
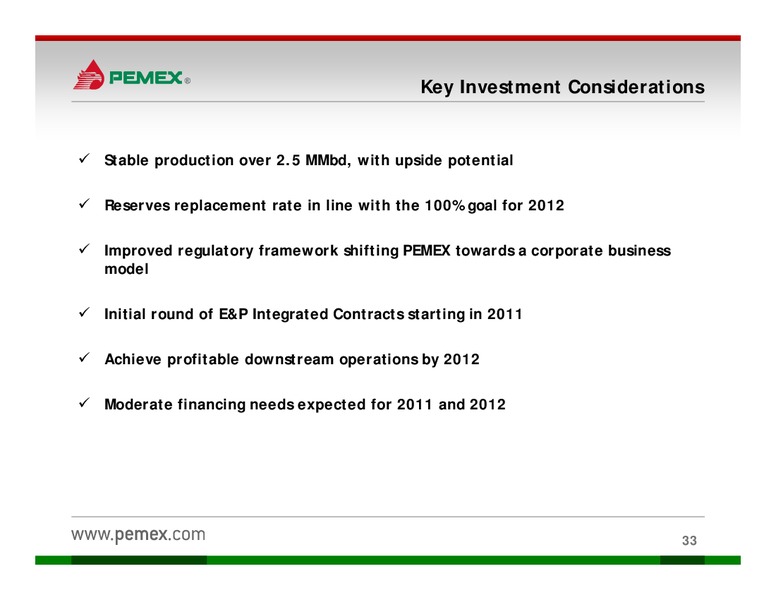
Key Investment Considerations Stable production over 2.5 MMbd, with upside potential Reserves replacement rate in line with the 100% goal for 2012 Improved regulatory framework shifting PEMEX towards a corporate business model…
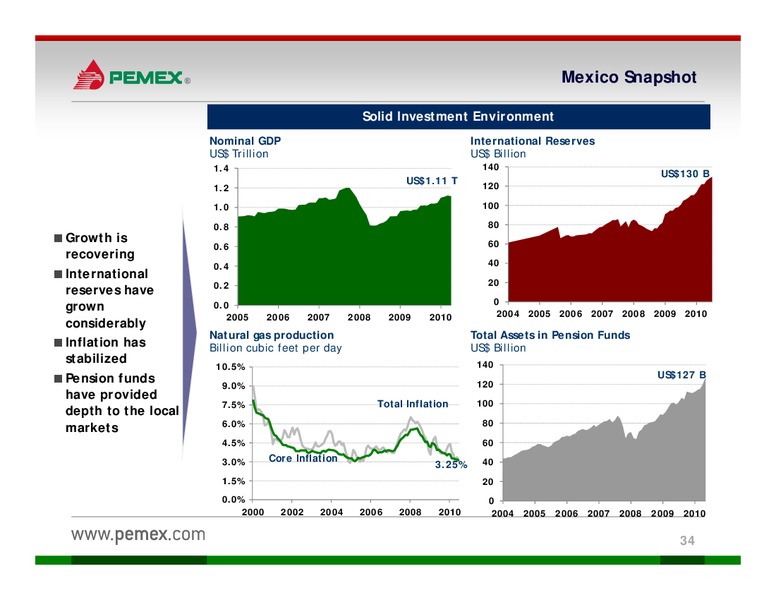
Mexico Snapshot Solid Investment Environment Nominal GDP International Reserves US Trillion US Billion 1.4 140 US130 B US1.11 T 120 1.2 1.0 100 0.8 80 Growth is 60 0.6 recovering 0.4 40 International 0.2 20 reserves have…
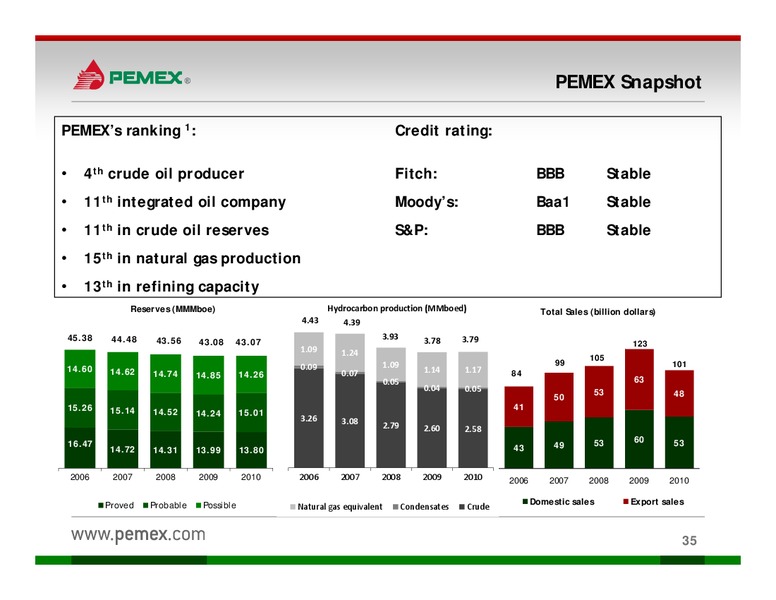
PEMEX Snapshot PEMEXs ranking 1: Credit rating: 4th crude oil producer Fitch: BBB Stable 11th integrated oil company Moodys: Baa1 Stable 11th in crude oil reserves S&P: BBB Stable 15th in natural gas production 13th in refining…
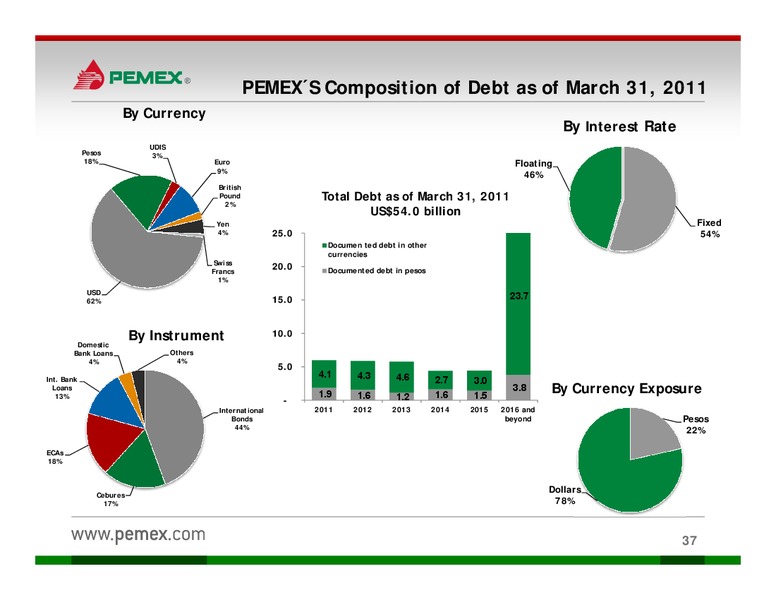
PEMEXS Composition of Debt as of March 31, 2011 By Currency By Interest Rate UDIS Pesos 3% 18% Euro Floating 9% 46% British Pound Total Debt as of March 31, 2011 2% US54.0 billion Yen Fixed 4% 25.0 54% Documen ted debt in…
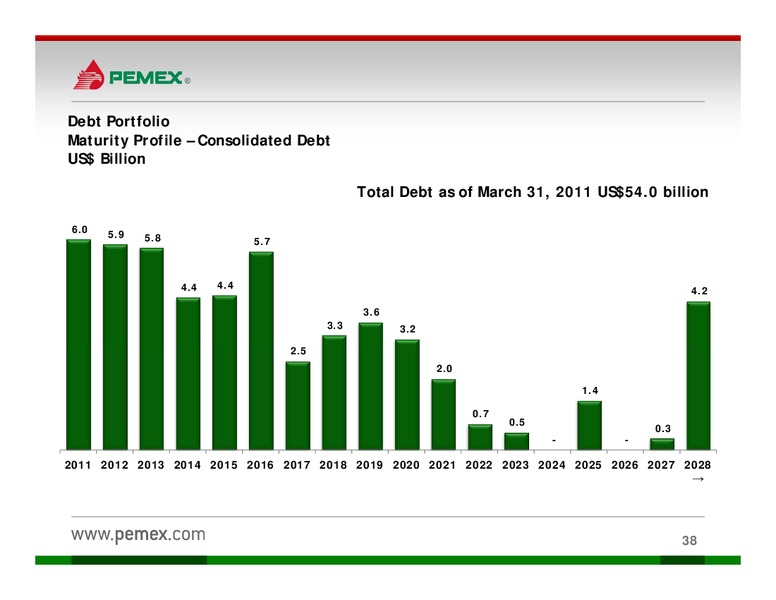
Debt Portfolio Maturity Profile Consolidated Debt US Billion Total Debt as of March 31, 2011 US54.0 billion 6.0 5.9 5.8 5.7 4.4 4.4 4.2 3.6 3.3 3.2 2.5 2.0 1.4 0.7 0.5 0.3 - - 2011 2012 2013 2014 2015 2016 2017 2018…
 Loading...