FY15 half year results Ian Davies, Managing Director and CEO Andrew Price, Chief Financial Officer Brisbane, 24 February 2015 Production commenced at the Martlet oil field in late November 2014
Ian Davies Managing Director and CEO Highlights Financial results Project updates Full year FY15 outlook 2 H1 FY15 results
H1 FY15 highlights Focus on delivering FY15 production guidance and maintaining strong funding position No lost time injuries; TRIFR of 3.92(1) SAFETY Cooper Medivac-24 helicopter service launched Record first half production of…
H1 FY15 performance Earnings reflect strong production and lower oil price Production (mmboe) Record first half production up 14% 1.38 14% 1.25 to 0.74 million barrels 0.60 0.65 0.74 Revenue and EBITDAX impacted by 27% lower oil…
Response to changed market conditions Strong financial position heading into the second half Company remains profitable and all work programs fully funded Portfolio of producing assets remains cash positive Hedging provides full…
Delivering the strategy Continued progression of key growth projects despite short term oil outlook OIL BUSINESS Cooper oil exploration Projects progressing with strategy unchanged, increased hurdle rate Deferring higher risk…
Andrew Price Chief Financial Officer Highlights Financial results Project updates Full year FY15 outlook 7 H1 FY15 results
Key financial results Underlying earnings impacted by lower oil price and higher exploration expense Higher sales volumes and H1 H1 million Change favourable AUD/USD exchange rate FY15 FY14 offset by lower oil price Average oil…
Non-cash impairment and net profit Non-cash impairment charge reflects lower oil price environment Senexs operating outlook remains million H1 H1 strong FY15 FY14 Impairment charge reflects Statutory net profit (loss) after tax…
Underlying net profit reconciliation Lower oil price and higher exploration expense impact underlying net profit Movement in underlying NPAT between H1 FY14 and H1 FY15 31.8 (13.9) (6.2) 2.0 (13.1) 1.0 1.6 (1) Underlying H1…
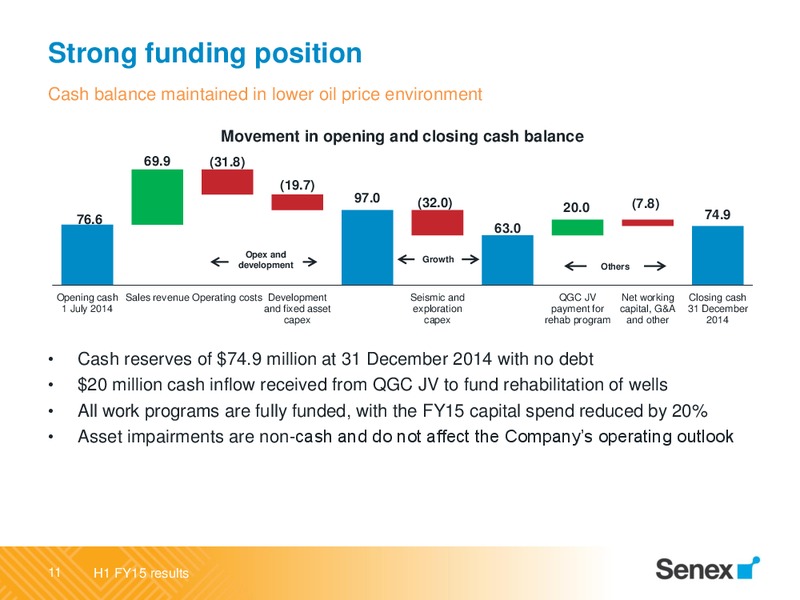
Strong funding position Cash balance maintained in lower oil price environment Movement in opening and closing cash balance 69.9 (31.8) (19.7) 97.0 (32.0) (7.8) 20.0 76.6 74.9 63.0 Opex and Growth development Others Opening…
Ian Davies Managing Director and CEO Highlights Financial results Project updates Full year FY15 outlook 12 H1 FY15 results
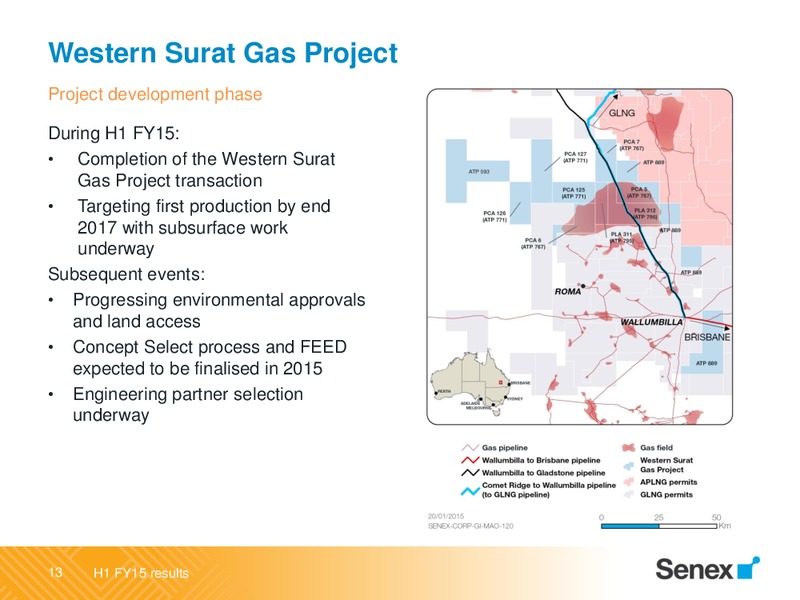
Western Surat Gas Project Project development phase During H1 FY15: Completion of the Western Surat Gas Project transaction Targeting first production by end 2017 with subsurface work underway Subsequent events: Progressing…
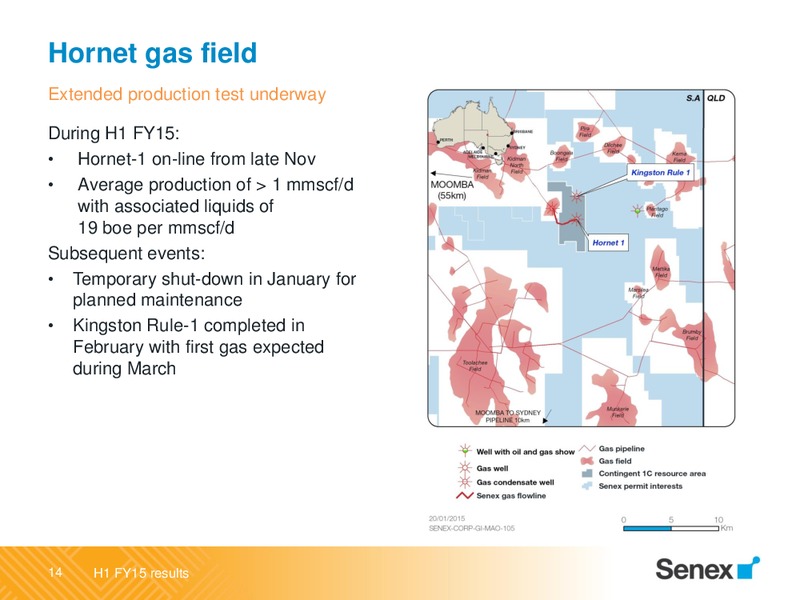
Hornet gas field Extended production test underway During H1 FY15: Hornet-1 on-line from late Nov Average production of 1 mmscf/d with associated liquids of 19 boe per mmscf/d Subsequent events: Temporary shut-down in January for…
Vanessa gas field Progress towards commercialisation During H1 FY15: Successful production test conducted in December 2014 Gas flowed at average rate of 5.0 mmscf/d with condensate produced at a rate of 15 boe per mmscf/d Subsequent…
Unconventional gas JVs with Origin Energy Seismic acquisition underway During H1 FY15: Senex and Origin progressed detailed planning of the 105 million Stage 1 work programs (Senex 100% free carried for its share) Three seismic…
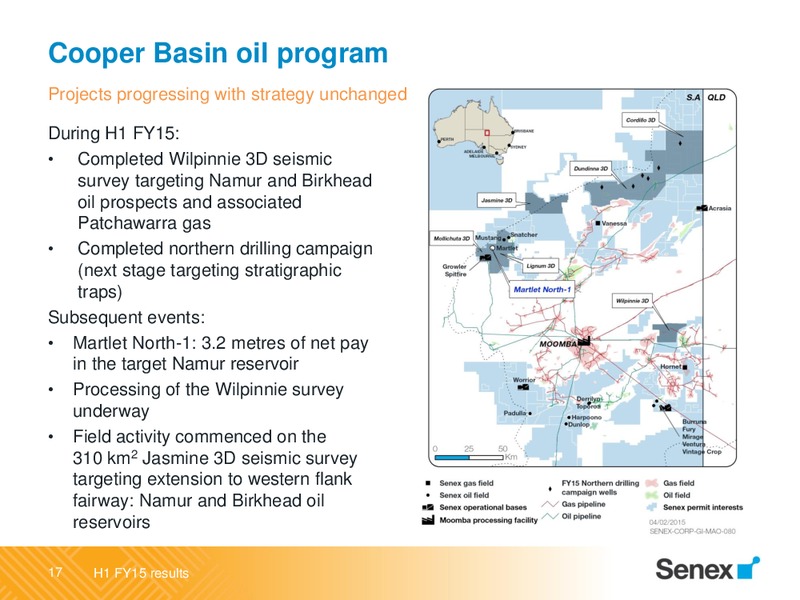
Cooper Basin oil program Projects progressing with strategy unchanged During H1 FY15: Completed Wilpinnie 3D seismic survey targeting Namur and Birkhead oil prospects and associated Patchawarra gas Completed northern drilling…
Ian Davies Managing Director and CEO Highlights Financial results Project updates Full year FY15 outlook 18 H1 FY15 results
FY15 outlook for capex and production Capex reduced by 20% with no changes to FY15 production guidance FY15 capex reduced in response to the expected decrease in revenues Capital program high-grading opportunities Continued…
Delivering the strategy Maintaining growth in the changed oil price environment Zero debt and fully funded: 74.9 million of cash at 31 December 2014 Maintaining Rapid response to changed market conditions in order to retain…
Registered Office Level 14, 144 Edward Street GPO Box 2233 Brisbane, Queensland 4000 Australia Telephone +61 7 3335 9000 Web www.senexenergy.com.au H1 FY15 results
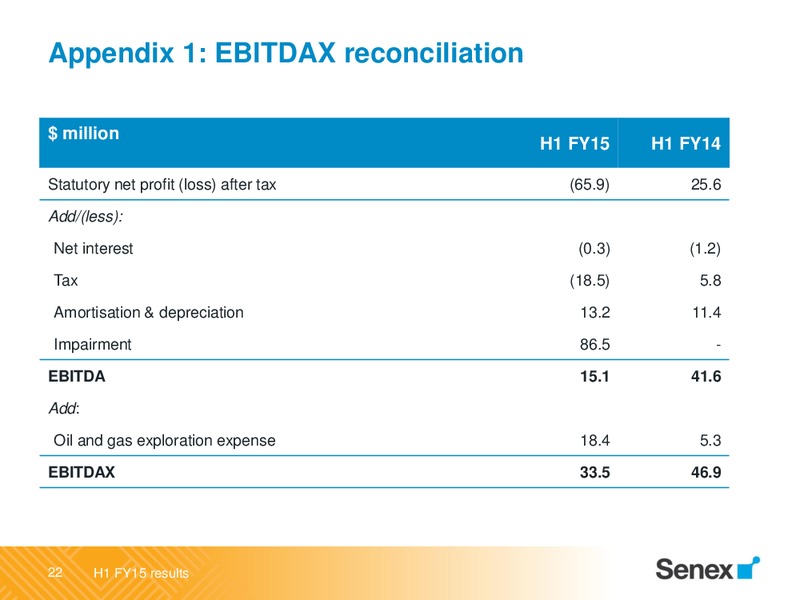
Appendix 1: EBITDAX reconciliation million H1 FY15 H1 FY14 Statutory net profit (loss) after tax (65.9) 25.6 Add/(less): Net interest (0.3) (1.2) Tax (18.5) 5.8 Amortisation & depreciation 13.2 11.4 Impairment 86.5 - EBITDA 15.1…
 Loading...