Fourth Quarter and Year-End 2014 Investor Review Presented February 25, 2015 1
Summary of Q4 Results Q4 revenue of 845.0 million, down 4% from prior year with currency translation accounting for majority of decline Environmental-related businesses delivered strong results while downturn in energy markets…
Revenue (in millions) 319.7 299.4 Q4 Performance Revenue up on strong backlog, + 7% incremental S-K contributions, and project volumes Technical Services Adjusted EBITDA and margins up considerably due to mix, increased Q4…
Revenue (in millions) 154.6 160.5 Q4 Performance Industrial and Field Services Revenue increased due to strength in +4% Field Services and growth in U.S. Industrial, which more than offset the currency translation effect and…
Revenue (in millions) 84.5 74.0 Q4 Performance Oil Re-refining and Recycling Revenue down due to lower base oil and 12% blended pricing Base oil pricing declined throughout quarter with large decline in early December Q4…
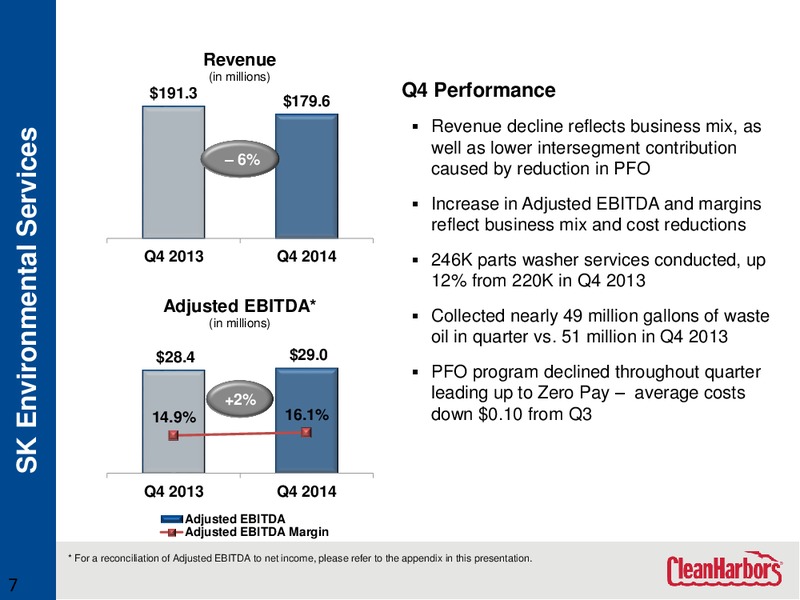
Revenue (in millions) 191.3 179.6 Q4 Performance Revenue decline reflects business mix, as SK Environmental Services well as lower intersegment contribution 6% caused by reduction in PFO Increase in Adjusted EBITDA and…
Revenue (in millions) 53.8 Q4 Performance 36.5 Revenue down due to manufacturing 32% slowdown and less drill camps business, along with currency translation Lodging Services Fixed lodges performed largely on plan, although we…
Revenue (in millions) 96.3 Q4 Performance 77.6 Revenue performance reflects overall Oil and Gas Field Services downturn in energy markets, along with 19% currency translation Seismic business heavily affected by reductions in…
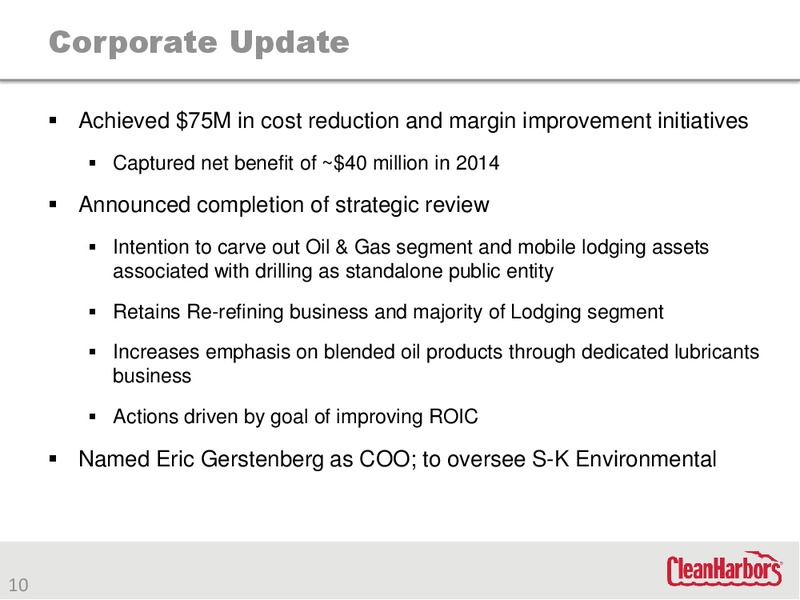
Corporate Update Achieved 75M in cost reduction and margin improvement initiatives Captured net benefit of 40 million in 2014 Announced completion of strategic review Intention to carve out Oil & Gas segment and mobile lodging…
Outlook Technical Services Extending disposal momentum at both incinerators and landfills Pursuing continued expansion of our InSite program in promising verticals Continuing construction of new El Dorado incinerator Industrial…
Outlook SK Environmental Services Opening new branches or co-locating with existing Field Services locations Implementing Zero Pay and Charge for Oil programs across network Preparing to optimize network and cross-selling…
Financial Review 13
Key Verticals Performance in Q4 2014 (% of total Q4 revenue) Refineries and Oil Sands Other 2% 2% 2%1% 1% Chemical 2% General Manufacturing 3% 4% 13% Base Oil/Blenders/Packagers 4% Automotive 4% 13% Oil and Gas Production…
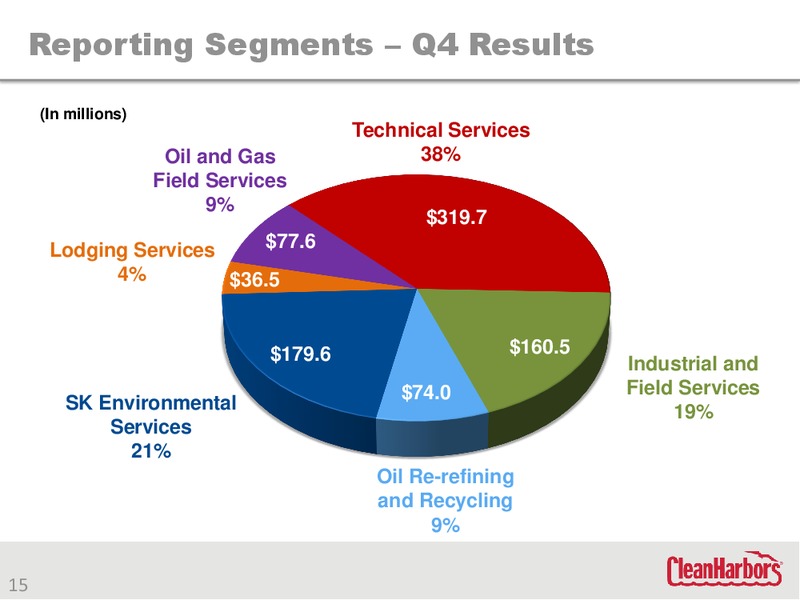
Reporting Segments Q4 Results (In millions) Technical Services Oil and Gas 38% Field Services 9% 319.7 Lodging Services 77.6 4% 36.5 179.6 160.5 Industrial and 74.0 Field Services SK Environmental 19% Services 21% Oil…
Q4 and 2014 Income Statement (In millions, except per share data) Q4 2014 Q4 2013 2014 2013 Revenue 845.0 879.4 3,401.6 3,509.7 Cost of revenues 610.7 645.2 2,441.8 2,542.6 Gross profit 234.3 234.3 959.8 967.0 Gross margin %…
Balance Sheet and Cash Flow Highlights (In millions) 12/31/14 9/30/14 12/31/13 Balance Sheet Highlights Cash and marketable securities 246.9 258.0 322.5 Accounts payable 267.3 251.8 316.5 Billed and unbilled receivables 597.9…
Guidance (as of February 25, 2015) Q1 2015 Range Adjusted EBITDA* (in millions) 83 90 2015 Range Adjusted EBITDA* (in millions) 530 570 Long-Term Target ROIC 13% * For a reconciliation of Adjusted EBITDA to net income,…
Questions & Answers 19
Appendix 20
Non-GAAP Reconciliation (in thousands) For the Three Months Ended: For the Year Ended: December 31, December 31, December 31, December 31, 2014 2013 2014 2013 27,377 26,801 (28,328) 95,566 Net income (loss) 2,637 2,913 10,612…
Non-GAAP Reconciliation (in thousands) For the Year Ended: December 31, December 31, Adjusted net income 2014 2013 (28,328) 95,566 Net (loss) income Goodwill impairment charge, net of tax 120,750 92,422 95,566 Adjusted net…
Non-GAAP Reconciliation For the Quarter Ending For the Year Ending March 31, 2015 December 31, 2015 Amount Amount (In millions) (In millions) Projected GAAP net (loss) income (4) To 2 103 to 136 Adjustments: Accretion of…
 Loading...