Half Year FY2015 Financial Results 23 February 2015 ABN 51 009 799 455
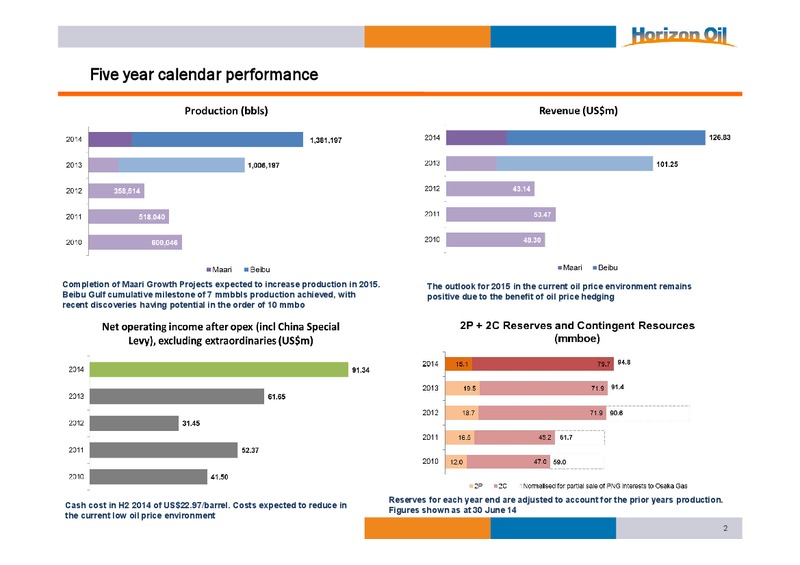
Five year calendar performance Completion of Maari Growth Projects expected to increase production in 2015. The outlook for 2015 in the current oil price environment remains Beibu Gulf cumulative milestone of 7 mmbbls production…
Half Year Highlights 618,665 barrels produced, sales of 565,397 barrels at an average realised price (net of hedging) of US94.0 per barrel, generating revenue of US53.1 million, and with operating expenditure of Performance US30.8…
Operational Results LTIFR of 0.8 (Lost Time Injury Frequency Rate), TRIFR of 3.3 (Total reportable injury frequency rate) at 31 HSSE Dec 14 over a 12 month rolling 1.2 million manhours No significant loss of containment incidents…
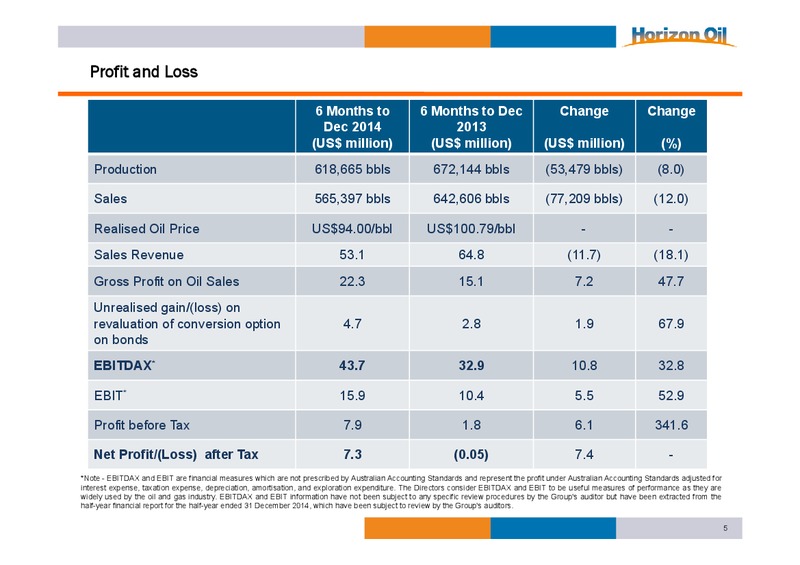
Profit and Loss 6 Months to 6 Months to Dec Change Change Dec 2014 2013 (US million) (US million) (US million) (%) Production 618,665 bbls 672,144 bbls (53,479 bbls) (8.0) Sales 565,397 bbls 642,606 bbls (77,209 bbls) (12.0)…
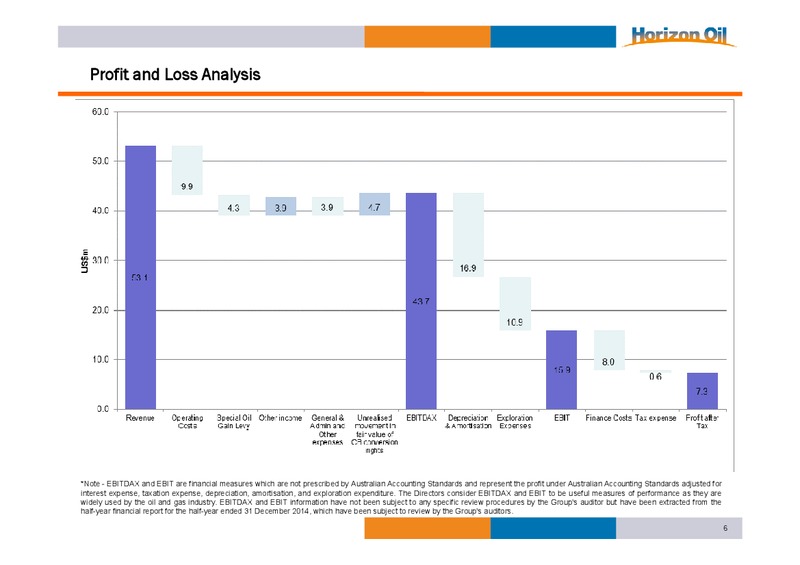
Profit and Loss Analysis *Note - EBITDAX and EBIT are financial measures which are not prescribed by Australian Accounting Standards and represent the profit under Australian Accounting Standards adjusted for interest expense,…
Cash Flow 6 Months to 6 Months to Change Change Dec 2014 Dec 2013 (US million) (US million) (US (%) million) Opening Cash 98.9 19.0 79.9 420.5 Net Cash from Operating Activities 26.3 29.9 (3.2) (10.8) (excl G&A) General &…
Cash Flow Analysis 8
Forecast net production at 31 December 2014 Note: Wei 12-8E includes managements estimates of recoverable resources from the recent discoveries following the drilling of 12-10-1 & 2 exploration wells 9
2015 calendar year hedging position and risk management 842,500 bbls hedged through 2015 to mid 2016 at average of US95/barrel Oil price hedging program protects revenue by mitigating the effect of low oil prices Oil…
Outlook for 2015 Corporate Outlook Operating cashflows expected to be substantially maintained notwithstanding lower oil prices, following completion of the Maari Growth Projects, continued China production and a strong hedge position,…
 Loading...