2014 Preliminary Results London, 3 March 2015 Mt Owen coal, Australia
CCR copper refinery, Canada Highlights Ivan Glasenberg Chief Executive Officer
2014 Highlights(1) Strong financial performance despite difficult market conditions Adjusted EBITDA(2) of 12.8bn, down 2% Marketing Adjusted EBIT(2) of 2.8bn, up 18% Net income(3) of 4.3bn, down 7% Industrial synergies and cost…
Sustainability and governance Safety LTIFR(1) 2009 to 2014 Regrettably 16 fatalities in 2014 (26 in 2013) 2.96 Reduction on 2013 reflects SafeWork focus on safety 2.74 leadership, culture and implementation of Fatal Hazard 2.49 47%…
Ulan West coal, long wall operation, Australia Financial performance Steven Kalmin Chief Financial Officer
Financial performance highlights Robust financial performance despite difficult 12.8bn 4.3bn 33cents market conditions Adjusted EBITDA, Net income pre- Earnings per share, Weaker prices largely offset down 2% significant items, down…
Marketing EBIT up 18% Adjusted EBIT 2013 vs 2014 (M) Metals & Minerals: Energy: Strongest performance Modestly lower adjusted decrease in EBIT since 2008. Adjusted EBIT Agriculture: EBIT largely reflects the reflects oversupplied up…
Robust industrial financial performance despite weaker prices Adjusted pro forma EBITDA/EBIT 2013 vs 2014 (M) Healthy industrial performance despite Energy: Metals & Minerals: Agriculture: generally weaker Higher production Impact of…
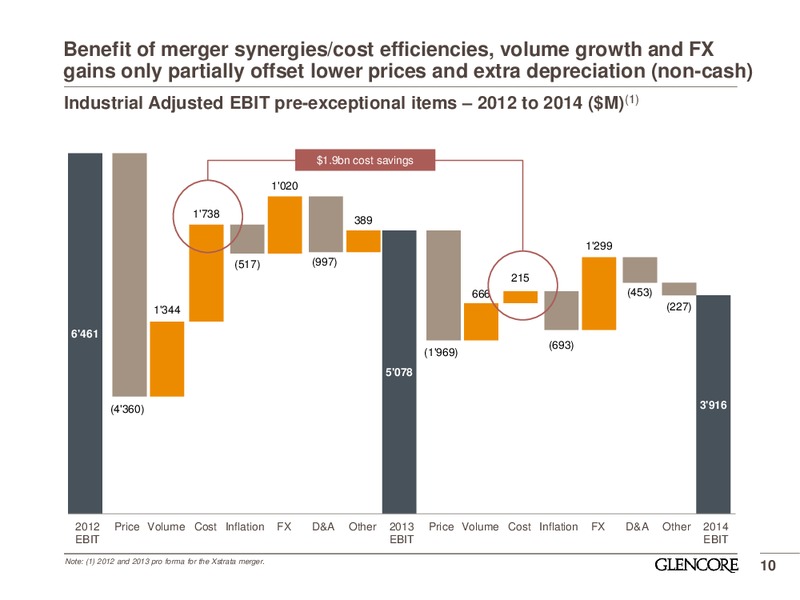
Benefit of merger synergies/cost efficiencies, volume growth and FX gains only partially offset lower prices and extra depreciation (non-cash) Industrial Adjusted EBIT pre-exceptional items 2012 to 2014 (M)(1) 1.9bn cost savings…
Robust balance sheet and strong cashflow coverage Net 52.2 54.4 Robust liquidity position with 9.4bn of funding(1) committed undrawn credit facilities and cash (bn) 49.2 as of 31 December 2014 49.8 Strong cashflow coverage ratios:…
2.8 billion reduction in 2014 capex Metals & Minerals:5.7bn(1) Energy: 2.2bn Total capex: 8.6bn(1) (24%) Expansionary -2.8bn Marketing and capitalised interest 7'025 -1,826M 4'175 4'224 2'568 Sustaining…
2015E industrial capex at 6.5-6.8bn, down from 7.9bn Reduction of 1.1 - 1.4bn of capital has been identified 7.9bn across the business Investor day 2014 forecast for 2015: Reduction of c.200M in sustaining capital through further…
Returning excess capital to shareholders in 2014 Excess capital allocation matrix +2.3bn -8.4bn Working Capex net of Investment capital change disposals M&A / opportunities also +4.5bn brownfield screened against returns generated from…
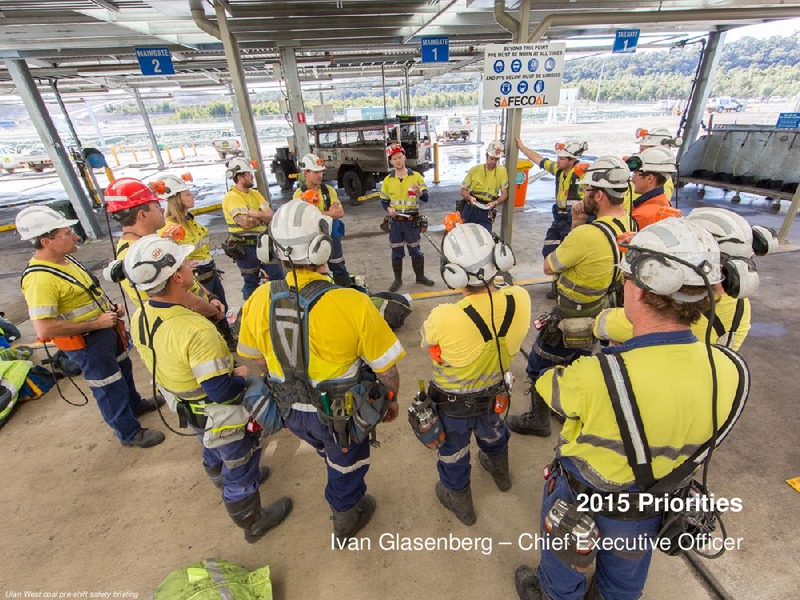
2015 Priorities Ivan Glasenberg Chief Executive Officer Ulan West coal pre-shift safety briefing
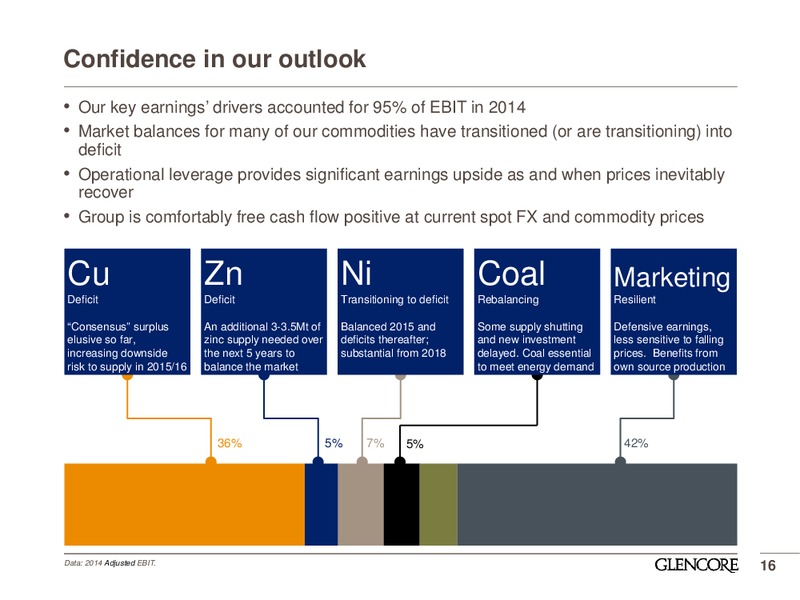
Confidence in our outlook Our key earnings drivers accounted for 95% of EBIT in 2014 Market balances for many of our commodities have transitioned (or are transitioning) into deficit Operational leverage provides significant earnings…
Our priorities for 2015 Deliver Operating growth efficiency from remaining key projects: McArthur Achieving at or near first River, Katanga, quartile costs/margins Koniambo and Chad oil Confidence Grow base dividend Capital…
Installing ground support at the George Fisher zinc mine, Australia Q&A DVM
Temperature monitoring, Raglan nickel, Canada Appendix
Final 2014 distribution Increased final distribution reflects Distribution payments (US cents per share) confidence in our outlook and +9.1% financial position 18.0 Final cash distribution of 12 cents per share declared, representing…
Adjusted and reported EBITDA The impact of the proportionate consolidation of certain associates and joint ventures and the Xstrata acquisition pro forma adjustments, are set out in the following table: Adjustment 2014 Adjustments for…
Industrial 2015 EBIT sensitivity USM Indicative full year(1) 10% movement in copper price 1,300 10% movement in zinc price 280 10% movement in lead price 60 10% movement in nickel price 160 10% movement in ferrochrome price 125…
 Loading...