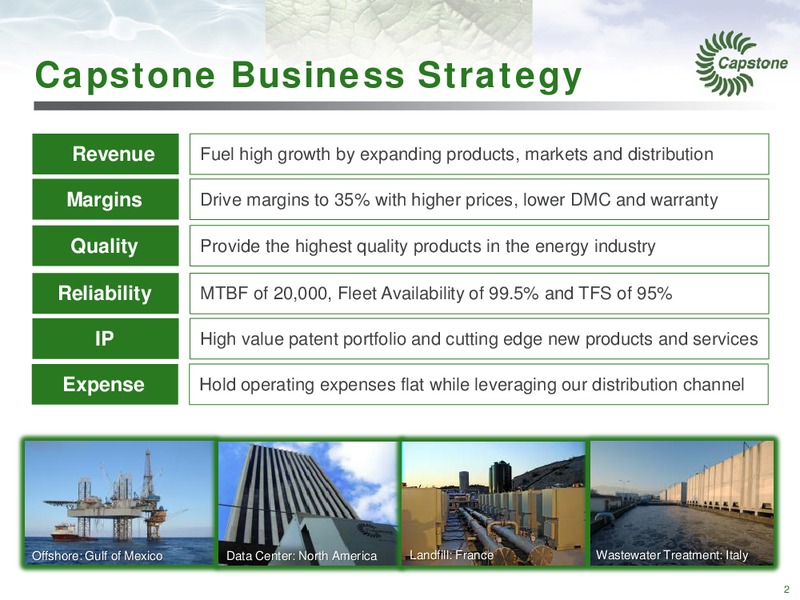
Capstone Business Strategy Revenue Fuel high growth by expanding products, markets and distribution Margins Drive margins to 35% with higher prices, lower DMC and warranty Quality Provide the highest quality products in the energy…
Macro Drivers/Business Catalysts Corporate Focus on Reducing Costs HR 4916 - Power Sustained Low Cost Efficiency Oct. 2014 Gas Environment New Marine SOx Declining Grid Regulations Reliability Subsidies in CA, NY, New Gas…
Broad Suite of Products All Capstone MicroTurbines operate: All are multi-fuel capable: Continuously or on-demand Low or high pressure natural gas Stand alone or grid connect Biogas (landfill, wastewater Individually or multi-pack…
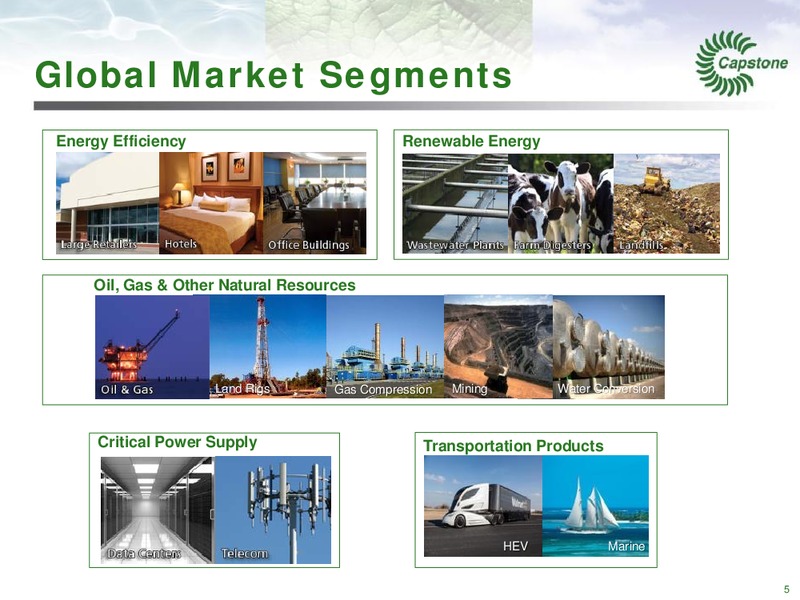
Global Market Segments Energy Efficiency Renewable Energy Oil, Gas & Other Natural Resources Land Rigs Land Rigs Gas Compression Mining Water Conversion Critical Power Supply Transportation Products Marine HEV…
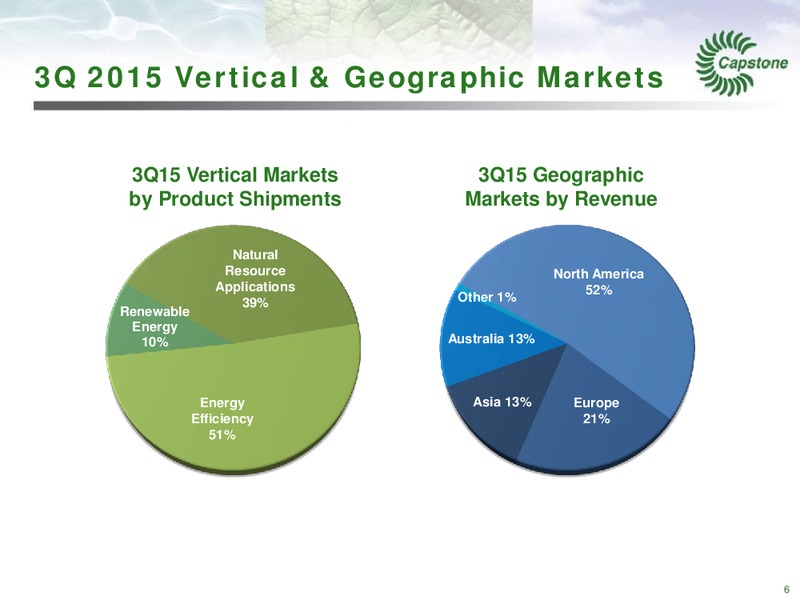
3Q 2015 Vertical & Geographic Markets 3Q15 Vertical Markets 3Q15 Geographic by Product Shipments Markets by Revenue Natural Resource North America Applications Energy 52% 39% Other 1% Renewable Efficiency Energy XX% 10%…
Sizing the Opportunity Total Market Opportunity Managements Estimate of Potential Capture Combined Boiler Retrofit Cooling Heat & 0.4 Power Data Boiler Combined 0.8 Center Retrofit, Cooling Data Center 0.02 (UPS), Heat & (UPS)…
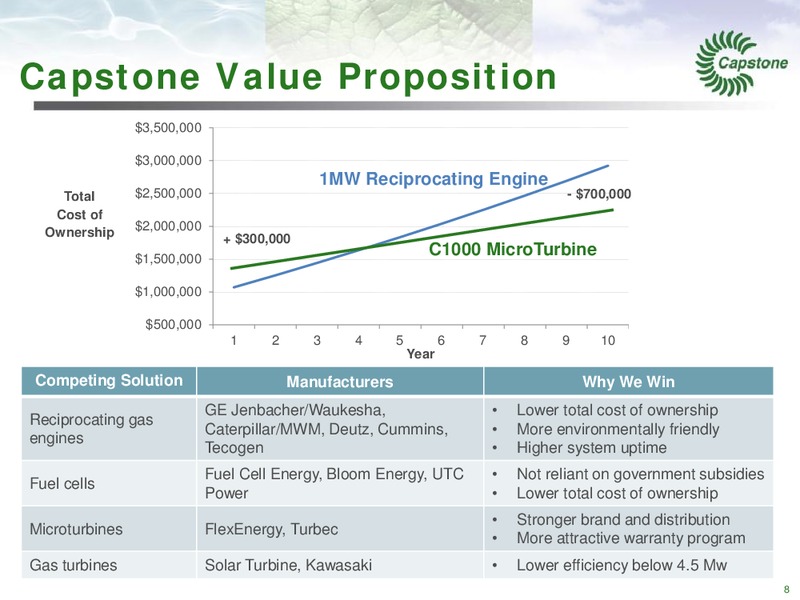
Capstone Value Proposition 3,500,000 3,000,000 1MW Reciprocating Engine Total 2,500,000 - 700,000 Cost of Ownership 2,000,000 + 300,000 1,500,000 C1000 MicroTurbine 1,000,000 500,000 1 2 3 4 5 6 7 8 9 10 Year Competing…
Growing Channel to Market NORTH AMERICA SOUTH AMERICA EMEA ASIA TOTAL Distributors 27 19 23 15 84 Employees 188 124 283 145 740 Locations 42 41 41 28 152 OEMs 3 2 3 2 10 Note: The above employee and location figures…
Annual Margin Improvement 20% 16% 15% 11% 10% 5% 5% 0% -2% -5% -10% -12% -12% -15% -14% -20% C200 Series first introduced to -25% market -24% -30% FY07 FY08 FY09 FY10 FY11 FY12 FY13 FY14 Gross margins have improved…
Product Backlog millions 200 175.5 180 160 140 120 100 80 60 40 20 5.0 0 FY2007 FY2008 FY2009 FY2010 FY2011 FY2012 FY2013 FY2014 3Q2015 Backlog has grown at a 66% annual rate over the last 7 years. 15
Strengthening Aftermarket Service Contributing to overall gross margin improvement Record FPP contract backlog Large install base provides scalability C200/C1000 reliability improving Lower product warranty expenses Increased…
Long Term Goals 1-3 3+ Past Present Years Years Gross Margin -24% 16% 30% 35% Critical Power Market 0% 8% 12% 15% Mobile Power Market 0% 1% 5% 10% (Bus Truck Marine) C30 C200 New Product Offerings C250 C370 C65 C1000…
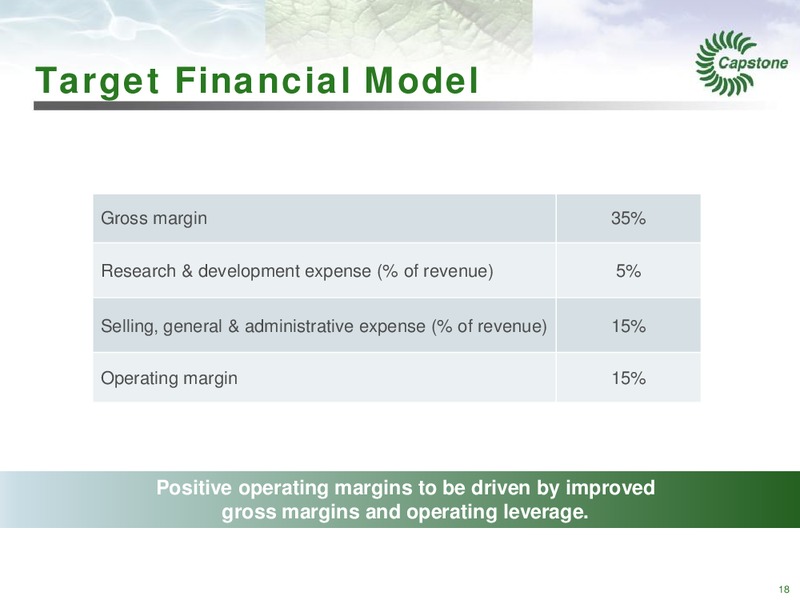
Target Financial Model Gross margin 35% Research & development expense (% of revenue) 5% Selling, general & administrative expense (% of revenue) 15% Operating margin 15% Positive operating margins to be driven by improved…
 Loading...