W&T Offshore, Inc. IPAA OGIS San Francisco Palace Hotel, San Francisco, CA October 1, 2009
Company Highlights Reserve Data 2008 2007 Proved Reserves (Bcfe) 491 639 Proved Developed Reserves (Bcfe) 334 395 Proved Developed % 68% 62% Oil and Liquids % 54% 52% Highlights Field Statistics (as of 12/31/08) Ticker WTI (NYSE)…
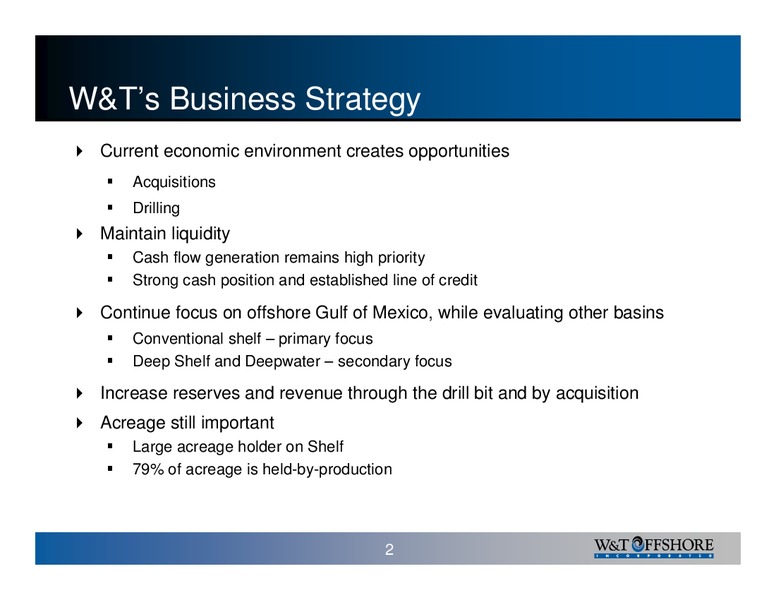
W&Ts Business Strategy Current economic environment creates opportunities Acquisitions Drilling Maintain liquidity Cash flow generation remains high priority Strong cash position and established line of credit Continue focus on…
25 Years of Operating Successfully in the Gulf of Mexico
Why We Focus on the GOM GOM basin has substantial known reserves 9 year exploration drilling success rate of 78% History of replacing production through combination of acquisitions and drilling Maintained steady reserve life…
Development and Exploration Success In 2009, W&T achieved a success rate of 73% Development Drilling Exploration Drilling 9 100% 100% 100% 100% 100% 35 100% 100% 86% 8 30 86% 86% 86% 1999 83% 11 77% 75% EEX, Vastar 75% 7…
Production Profile 8 140.0 Oil & NGLs (Bcfe) C AG R 2000-200 Natural Gas (Bcf) 19% 126.5 120.0 99.2 49.8 97.9 100.0 Full-Year Guidance 82.4 106.4 82.4 Bcfe 79.0 80.0 71.1 38.8 41.9 26.2 29.1 3Q Guidance 60.0 54.2…
Proved Reserves Mix 2007 2008 * Total PDP & PDSI = 41% PDP PDP 35% 30% PDSI 11% PDNP PUD PUD 27% PDNP 32% 38% 27% Oil Gas Total Oil Gas Total Mbo MMcf MMcfe Mbo MMcf MMcfe PDP 13,436 143,478 224,097 35% PDP 8,632 96,838…
3P Reserves 2008 3P reserves increased 14% over 2007 2007 2008 Proved Proved 37% 54% Possible 30% Possible Probable Probable 37% 26% 16% Oil & NGLs Gas Total Oil & NGLs Gas Total Mbo MMcf MMcfe Mbo MMcf MMcfe Proved…
Acquisition Strategy
Winning Acquisition Strategy Key to our successful acquisition strategy is our ability to target under-exploited assets Key Acquisition Factors Example 1. Cash Flow Strong current production rates, including several behind pipe,…
W&T Acquisition Strategy W&T has broken its acquisition strategy into three different focus areas where we are seeking opportunities. Gulf of Mexico Other Offshore Onshore 12
Disciplined Acquisition Strategy Creates Value W&T has a very active A&D team that evaluates transaction beyond the GOM In 2008, W&T visited or evaluated over 2 billion of acquisition opportunities in data rooms or private…
Operations Update
Accomplishments in 2Q We increased production by 16% over the first quarter Drilling successes during the first half of 2009 and late 2008 Workover successes Some deferred production from hurricane back online Adjusted EBITDA…
Green Canyon 646 Daniel Boone Flowline and umbilical lines laid Subsea work completed Final top side work on Frontrunner spar ongoing Project on budget and the start up procedures have begun 16
Profitability Initiative Goal: Develop and implement strategies to significantly improve cash flow and profitability from W&T operated properties in 2009 Reviewing active and inactive wellbores for upside Revenue enhancement - Focusing…
W&T Profitability Initiative In early 2009, W&T launched a profitability initiative Diesel Fuel throughout the company. 4.50 The results to date are: 4.00 Lower transportation costs 3.50 3.00 Per gallon Utilizing fewer boats…
Financials
Hedging Strategy & Schedule The Company has hedged 11.9 Bcf of its 2010 natural gas production and 1.27 MMBbls of its 2010 oil production. Hedges were put in place to augment the borrowing base and the 2010 drilling budget Natural…
Drill Within Cash Flow W&T has a long history of funding capital expenditures through internally generated cash flow Capital Expenditures ( in millions) 900 884 820 800 Adj. EBITDA CapEx 700 642 658 589 600 500 472 396…
W&T Liquidity - Opportunities Paid 205 million Term Loan B with draw on revolver during the 2nd quarter Subsequentially, paid down 63 million on Revolver in 2nd quarter, leaving borrowings outstanding of 142.4 million Cash balance at…
2009 Guidance and Capital Budget Estimated Production Full-Year 2009 Crude oil (MMBbls) 6.5 8.4 Natural gas (Bcf) 43.6 56.1 Total (Bcfe) 82.8 106.4 Operating Expenses ( in millions) Full-Year 2009 Lease operating expenses 205 235*…
Key Drivers Proven Track-Record of Acquiring and Exploiting assets Large inventory of prospects Flexibility Sufficient Liquidity 25
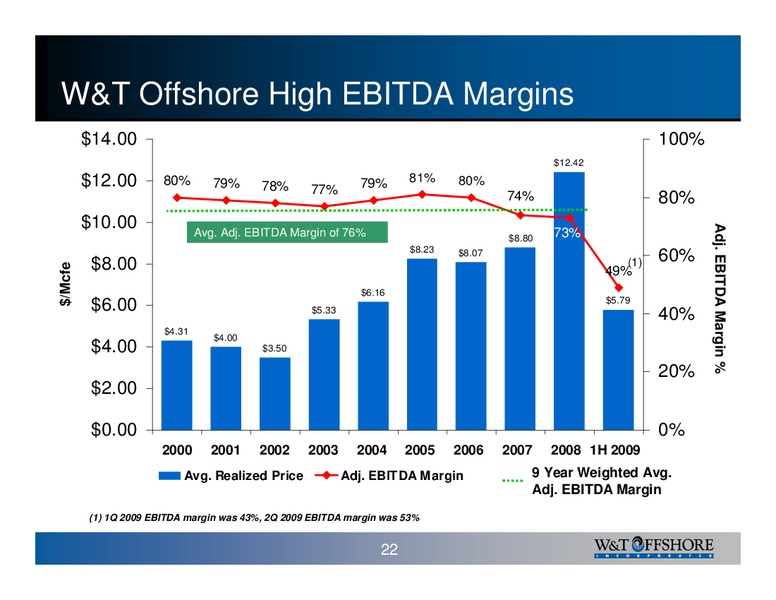
Reconciliation of Net Income to EBITDA The following table presents a reconciliation of our consolidated net income to consolidated EBITDA to Adjusted EBITDA: Year Ended December 31, 1H 2000 2001 2002 2003 2004 2005 2006 2007 2008…
W&T Offshore, Inc. (NYSE: WTI) Nine Greenway Plaza Suite 300 Houston, TX 77046 Main line - 713-626-8525 Fax - 713-626-8527 Investor Relations - 713-297-8024 www.wtoffshore.com www.investorrelationswtoffshore.com
 Loading...