2012 BARCLAYS CEO ENERGY-POWER CONFERENCE New York September 5th, 2012
W&T Offshore, Inc. (NYSE: WTI) Revenues for 2011/1st half 2012 971 MM / 451 MM Adj EBITDA for 2011/1st half 2012 646 MM / 281 MM Proved Reserves (1) 701.1 Bcfe / 116.9 MMboe Reserves - Oil & Liquids (1) 59% PV-10 of Proved…
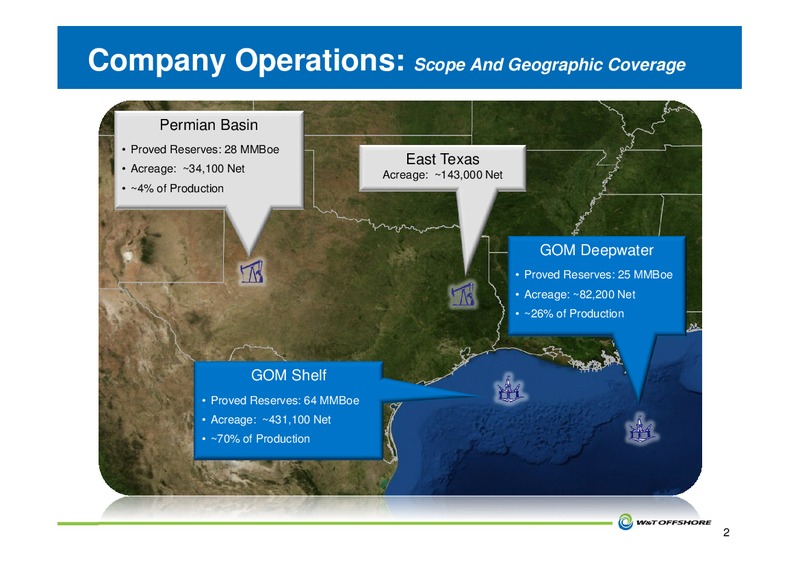
Company Operations: Scope And Geographic Coverage Permian Basin Proved Reserves: 28 MMBoe East Texas Acreage: 34,100 Net Acreage: 143,000 Net 4% of Production GOM Deepwater Proved Reserves: 25 MMBoe Acreage: 82,200 Net 26% of…
Why Invest in W&T Company remains focused on growth at a reasonable price History of acquiring assets at an attractive valuation History of taking advantage of previously neglected properties and successfully exploiting acquired…
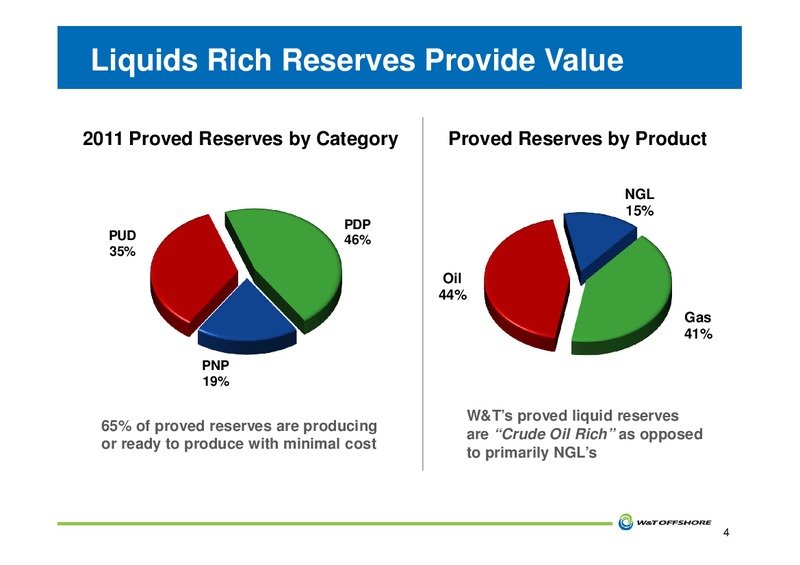
Liquids Rich Reserves Provide Value 2011 Proved Reserves by Category Proved Reserves by Product NGL 15% PDP PUD 46% 35% Oil 44% Gas 41% PNP 19% W&Ts proved liquid reserves 65% of proved reserves are producing are Crude…
Pricing Premiums Drive Higher Returns W&T is receiving premium prices for both its oil and gas production In the previous six quarters, our realized pricing consistently beats West Texas Intermediate and Henry Hub prices Crude…
Drilling Within Cash Flow Historically, we have not borrowed money for drilling Adj. EBITDA CAPEX, Excl. Acquisitions Acquisition CAPEX 700 600 ( in millions) 500 400 300 200 100 0 2009 2010 2011…
Growing Through Multiple Avenues Focusing on all three aspects of our business development Exploration: Seeking organic growth through exploration activity Offshore exploration, including deepwater projects Targets offshore via lease…
Remaining CAPEX Focused on Exploration ( in millions) 2012 CAPEX budget of 425 million, before considering acquisitions More exploration focus in the second half of 2012 250 Exploration CAPEX more than triples in 2H 2012 200…
Offshore Exploration Activity in 2012 MP 163 1 (WI: 40%) Est. Drill Costs (net) : 3.1 MM Target IP: 480 Boepd Est. 1st production: late Q4 MP 108 B-1 ST02 (WI: 100%) Est. D&C Costs : 27 MM Target IP: 1,200 Boepd WC 73 2 (WI:…
Gulf of Mexico Activity 2012 Gulf of Mexico remains a focus for us Majority source of our cash flow High rate of return projects with rapid payback We are positioned well in the Gulf of Mexico Fourth largest producer on the Gulf…
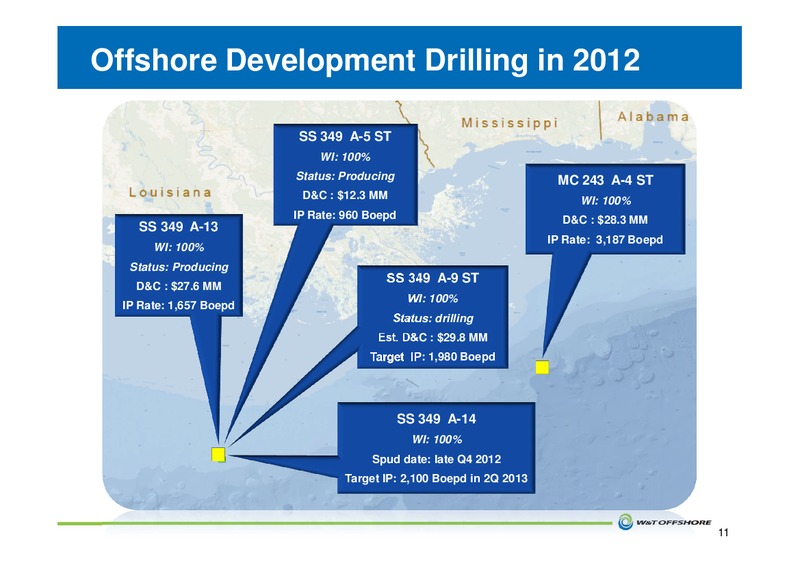
Offshore Development Drilling in 2012 SS 349 A-5 ST WI: 100% Status: Producing MC 243 A-4 ST D&C : 12.3 MM WI: 100% IP Rate: 960 Boepd D&C : 28.3 MM SS 349 A-13 IP Rate: 3,187 Boepd WI: 100% Status: Producing SS 349 A-9 ST D&C…
Ship Shoal 349 - Mahogany Field (WI:100%) Ship Shoal 349 production has grown 300% over the last nine months SS 349 Mahogany Average Monthly Production 4500 4000 A-13 3500 A-1 ST4 3000 Upcoming Activity BOEPD 2500 at…
Mississippi Canyon 243 - Matterhorn (WI: 100%) Matterhorn production has nearly doubled over the past 12 months MC 243 Matterhorn Production Profile 7000 A-4 ST 6000 A-7 5000 A-7 recomplete BOEPD 4000 Online July 2011…
New Leases Equal New Opportunities W&T was high bidder* on 11 of 13 blocks in the recent GOM lease sale: SS 360 SS 368 MP 89 MP 93 MP 106 MP 127 MP 285 MP 286 CH 28 W&T Operated Property CH 29 CH 39 OBO Property *BOEM still…
Onshore Activity in 2012 Terry County (Exploration & Delineation) Star Project (Exploration & Delineation) Yellow Rose (Exploration & Development) 15
Permian Basin Geology Multiple operators are targeting these zones with horizontal activity Our focus in the West Texas Permian Basin is the Wolfberry Vertical wells in the Permian can produce from over 4,000 of net pay…
Yellow Rose (WI: 100%) Permian Basin Development Project with long life reserves and exploration upside 2012 Activity Update Recent lease position has grown to 23,200 net acres in Dawson, Martin, Andrews, Gaines counties in Texas.…
Terry County (WI: 35.6 90%) Exploratory Opportunity 100 Miles North of W&T Proved Reserves at Yellow Rose Background 10,800 net acres Geologically similar to Yellow Rose In the exploration and delineation phase 14 vertical…
STAR Prospect (WI: 97.6%) Low entry cost, pure exploration play Background Currently 143,700 net acres in six East Texas counties and still growing Results of the four Targeting oil in the James Limes formation wells will be…
W&Ts Acquisition Advantage W&T has proven acquisition criteria Properties generate cash flow, are financeable, and have identified upside We are a preferred buyer in the Gulf of Mexico 28+ years of proven experience for safe…
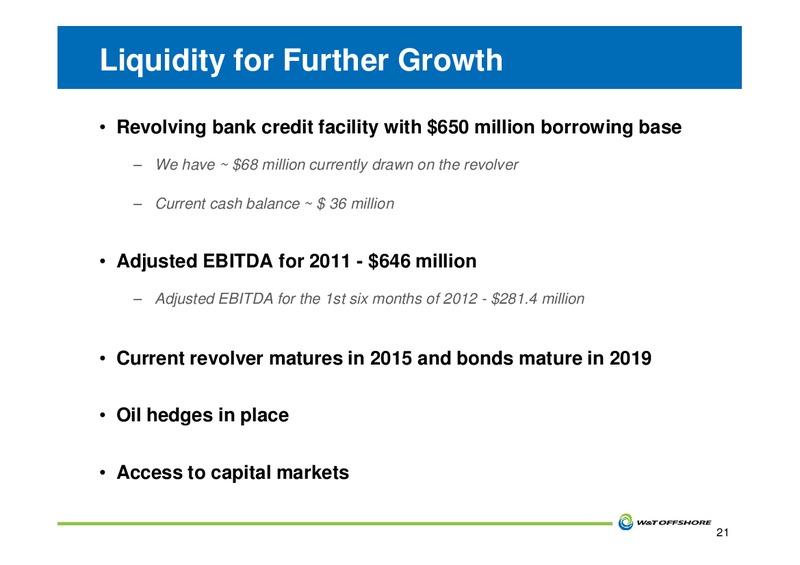
Liquidity for Further Growth Revolving bank credit facility with 650 million borrowing base We have 68 million currently drawn on the revolver Current cash balance 36 million Adjusted EBITDA for 2011 - 646 million Adjusted EBITDA…
Cash Generation Remains Key 2013 Estimates of Free Cash Flow at 90 Oil and 3.50 Natural Gas 100 0 -100 -200 in millions -300 -400 W&T Offshore is the only one of these companies predicted to -500 generate free cash…
Returning Cash to Investors In 2011, we paid the most dividends and had the highest dividend yield* (3.7%) among our peers**, whose average yield was close to 0%. Quarterly dividend has been increased three times since going public…
Why Invest in W&T Company remains focused on growth at a reasonable price History of acquiring assets at an attractive valuation History of taking advantage of previously neglected properties and successfully exploiting acquired…
Reconciliation of Net Income to EBITDA The following table presents a reconciliation of our consolidated net income to consolidated EBITDA to Adjusted EBITDA: Year Ended December 31, Six Months Ended June 30, 2009 2010 2011 2011…
2011 Year End Proved Reserves As of December 31, 2011 Total Equivalent Reserves Barrel Natural Gas % of Classification of Oil NGLs Natural Gas Equivalent Equivalent Total Proved Reserves (MMBbls) (MMGals) (Bcf) (MMBoe) (Bcfe)…
Financial Commodity Derivatives Oil Collars Weighted Average Contract Price Barrels Nymex Pricing ( per barrel) 2012 per Day Floor Ceiling Third Quarter 1,348 75.00 97.88 Fourth Quarter 2,728 75.00 98.99 Oil Swaps Barrels…
W&T Offshore, Inc. (NYSE: WTI) Nine Greenway Plaza, Suite 300 Houston, TX 77046 Main line: 713-626-8525 Fax: 713-626-8527 Investor Relations: 713-297-8024 www.wtoffshore.com www.investorrelationswtoffshore.com
 Loading...